Meet the Top 101 in Crypto

Pudgy Penguins (PENGU) Price Spikes 52% but Momentum May Slow With Upside Room Tightening

Published 09 May 2025
Nikola Lazic
Authors
Edited by Ryan James

Key Takeaways

  • PENGU completed a 5-wave impulse structure.
  • RSI divergence signals short-term exhaustion risk.
  • Correction is likely before the next major move.

Pudgy Pengiuns (PENGU) has posted an aggressive breakout, reclaiming key resistance levels on both intraday and higher time frames.

The price surged 52% since yesterday after a long accumulation and bottoming formation, prompting expectations of a completed impulse wave.

While short-term overextension is visible, broader market structure suggests a corrective retracement may follow before continuation.

PENGU Price Analysis

The 4H chart displays a clean, rounded bottom formation that led to a breakout above the descending trendline and a reclaim of the 0.236 Fib level at $0.0137.

Bullish momentum has extended toward the 0.382 Fib, reaching $0.017 at its highest point today.

However, it is currently at $0.0153, as initial sellers’ pressure has encountered.

PENGU price analysis
PENGUUSD | Credit: Nikola Lazic/TradingView

This structure aligns with a cup formation of the cup and handle pattern after a prolonged bottoming stage.

There could be more short-term upside before we see the handle as a significant retracement to retest some broken resistance levels for support.

The Relative Strength Index (RSI) in this time frame shows bearish divergence, with prices making higher highs while the RSI made a lower high.

This adds credibility to the likelihood of a corrective structure unfolding in the coming days.

Today’s fast reaction to the upward spike and the wick on the 4-hour chart could be interpreted as the first sign of caution.

However, the overall structure remains bullish, and the likelihood of an interaction with the $0.0199 Fib level is high.

PENGU Price Prediction

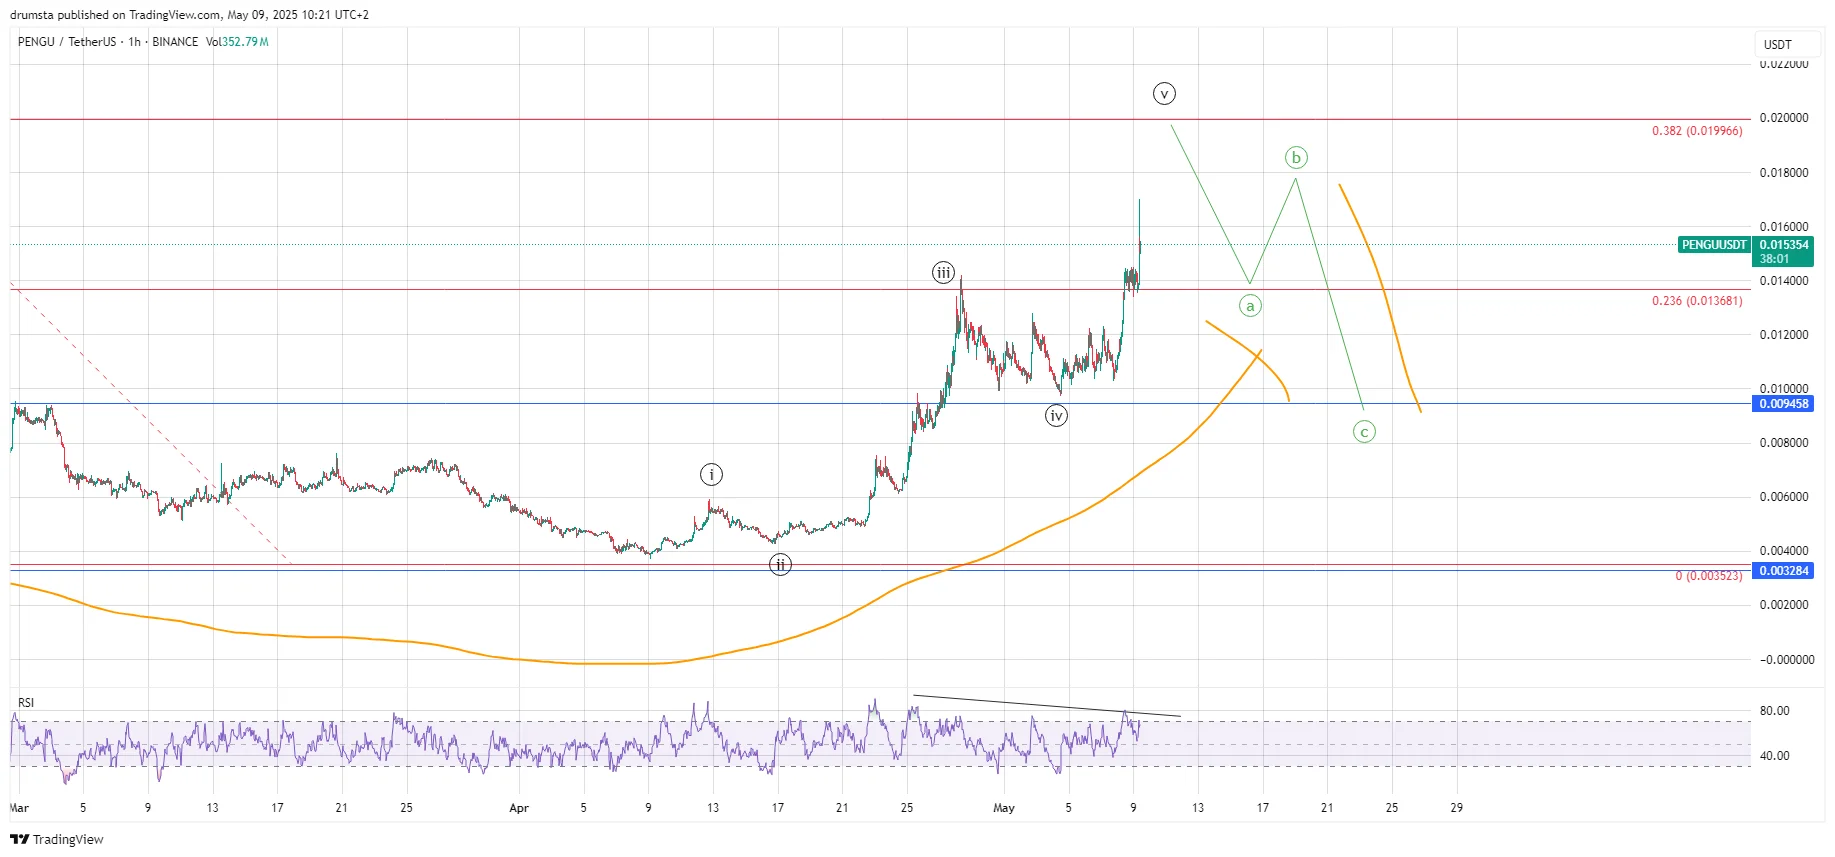
The 1H chart confirms the final leg of an impulsive structure, with a clean five-wave count culminating at today’s high.

The price still has the potential to continue upward, but sellers could step in soon.

Following the peak, a corrective ABC pattern should form, with wave A retesting the 0.236 Fibonacci level at $0.013.

A lower high would validate the corrective stage assumption; in this case, wave C should make a lower low, preferably at $0.0094 horizontal support.

PENGU price prediction
PENGUUSD | Credit: Nikola Lazic/TradingView

The green projection shows a shallow retracement scenario, forming a zigzag where wave “c” ends above $0.01, maintaining overall bullish structure.

This would be the handle counterpart of the mentioned cup and handle formation, which is a bullish pattern, indicating that the price bottomed out and is primed for continuous growth.

However, if that level gets broken, macro support at $0.0032 will become important, although this is unlikely unless sentiment shifts drastically.

RSI on the 1-h is diverging from price, supporting the thesis of short-term exhaustion. Volume spikes during the last leg of wave (v) also suggest distribution.

If a clean “ABC” correction plays out and bullish reversal signals appear near support, a second impulsive wave could lift PENGU back above $0.02 and potentially toward the 0.5 Fib zone at $0.025.

Key Levels to Watch

  • Immediate Resistance: $0.016 (wave v top).
  • Fibonacci Rejection Zone: $0.0199 (0.382 Fib).
  • First Support Zone: $0.0136 (0.236 Fib).
  • Structural Support: $0.0094 (wave iv low).
  • Macro Support: $0.0032 (cycle low).
Disclaimer: The information provided in this article is for informational purposes only. It is not intended to be, nor should it be construed as, financial advice. We do not make any warranties regarding the completeness, reliability, or accuracy of this information. All investments involve risk, and past performance does not guarantee future results. We recommend consulting a financial advisor before making any investment decisions.
Nikola Lazic

Nikola Lazic is a cryptocurrency analyst and investor working in the industry since 2017. He holds a bachelor's degree in Sociology, which enables him to better understand the psychology behind the crowd´s positioning. Consequently his preferred analytical tool is Elliott Wave Theory in combination with price action analysis.

Combining his experience in trading and investing with knowledge in content writing he strives to bring the most accurate and actionable information.

Expertise: Cryptocurrencies, Technical analysis, Elliott Wave Theory, On-chain metrics, Research reports.

Related

Survey Icon
Help us improve
1 of 4
Is this your first time here?
What brought you here today?
What are you most interested in?
Would you be interested in:
Thank you icon
Thank you for your feedback!
DMCA.com Protection Status