Ethereum’s (ETH) price surged on May 8 and crossed $2,000.
Ethereum’s Pectra upgrade went live on the mainnet on May 7.
Has Ethereum started a bullish trend reversal, or is this a relief rally?
Ethereum has been one of the best performers in the crypto market his week, rallying by over 20%.
Ethereum’s upward movement accelerated after the Pectra upgrade went live on May 7. The ETH price has gained against USD and Bitcoin (BTC), reducing the latter’s dominance.
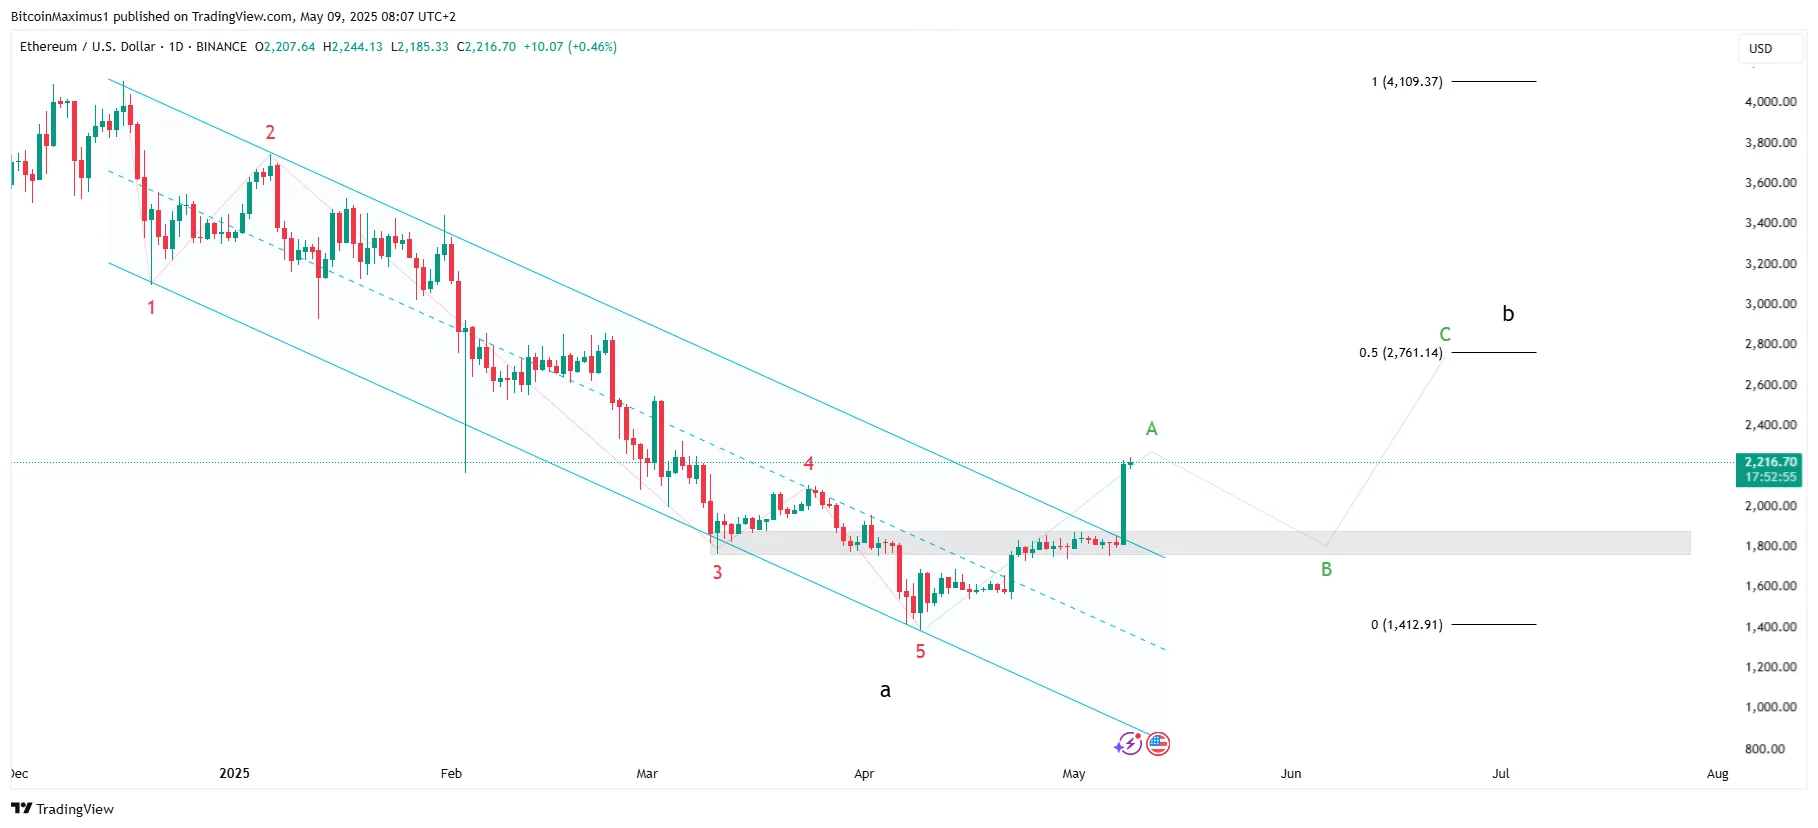
With market sentiment flipping bullish, let’s analyze the Ethereum price movement and determine if the price has started a bullish trend reversal.
Why is Ethereum Going Up?
Ethereum’s weekly time frame analysis shows the price has bounced 60% since its April lows of $1,383, finally crossing $2,000 this week.
After creating a bullish weekly candlestick, the price trades inside the $2,200 horizontal resistance area, a key level that provided support for more than a year.
Until the price reclaims it, the ongoing increase might be a retest of the area as resistance after ETH broke down in March (red icon).
Technical indicators have not flipped bullish yet. The Relative Strength Index (RSI) is below 50, and the Moving Average Convergence/Divergence (MACD) has not made a bullish cross yet.
Ethereum’s long-term wave count gives a bearish price analysis. It suggests that ETH is in wave Y of a W-X-Y corrective structure (red) that started with the 2021 all-time high.
If the count is accurate, ETH will not reach a new all-time high this cycle. Instead, it will eventually break down below its previous bear market low, which has never happened before.
Disclaimer:
The information provided in this article is for informational purposes only. It is not intended to be, nor should it be construed as, financial advice. We do not make any warranties regarding the completeness, reliability, or accuracy of this information. All investments involve risk, and past performance does not guarantee future results. We recommend consulting a financial advisor before making any investment decisions.
Valdrin Tahiri is a cryptocurrency analyst and reporter at CCN, specializing in technical analysis with a focus on Elliott Wave theory, on-chain metrics, and fundamental research. He brings over seven years of experience in the crypto space as both a trader and writer.
He discovered cryptocurrencies in 2017 while earning his MSc in Financial Markets at the Barcelona School of Economics, which sparked a deep interest in blockchain and market dynamics. Since then, he’s contributed to top crypto outlets like BeInCrypto and CoinGape.
Valdrin also served as Community Manager of BeInCrypto’s Telegram group for three years, helping grow it into one of the largest crypto communities worldwide. His expertise in market structure and price patterns allows him to break down complex trends into clear, actionable insights.
He’s published thousands of articles covering altcoins, Bitcoin cycles, and macro trends.