$MSTR Down 66%: Is Michael Saylor’s Bitcoin Strategy at Solvency Risk If BTC Breaks $75K?
Share
Key Takeaways
MSTR rebounds after 66% crash, breaking falling-wedge resistance.
Rising CMF, BBP, and active addresses support bullish momentum.
Sustained buying pressure could send it to $0.068 in the short term.
There is no denying that the past few months have been brutal for the MSTR2100 (MSTR) memecoin, which has mirrored the slide in Strategy’s stock.
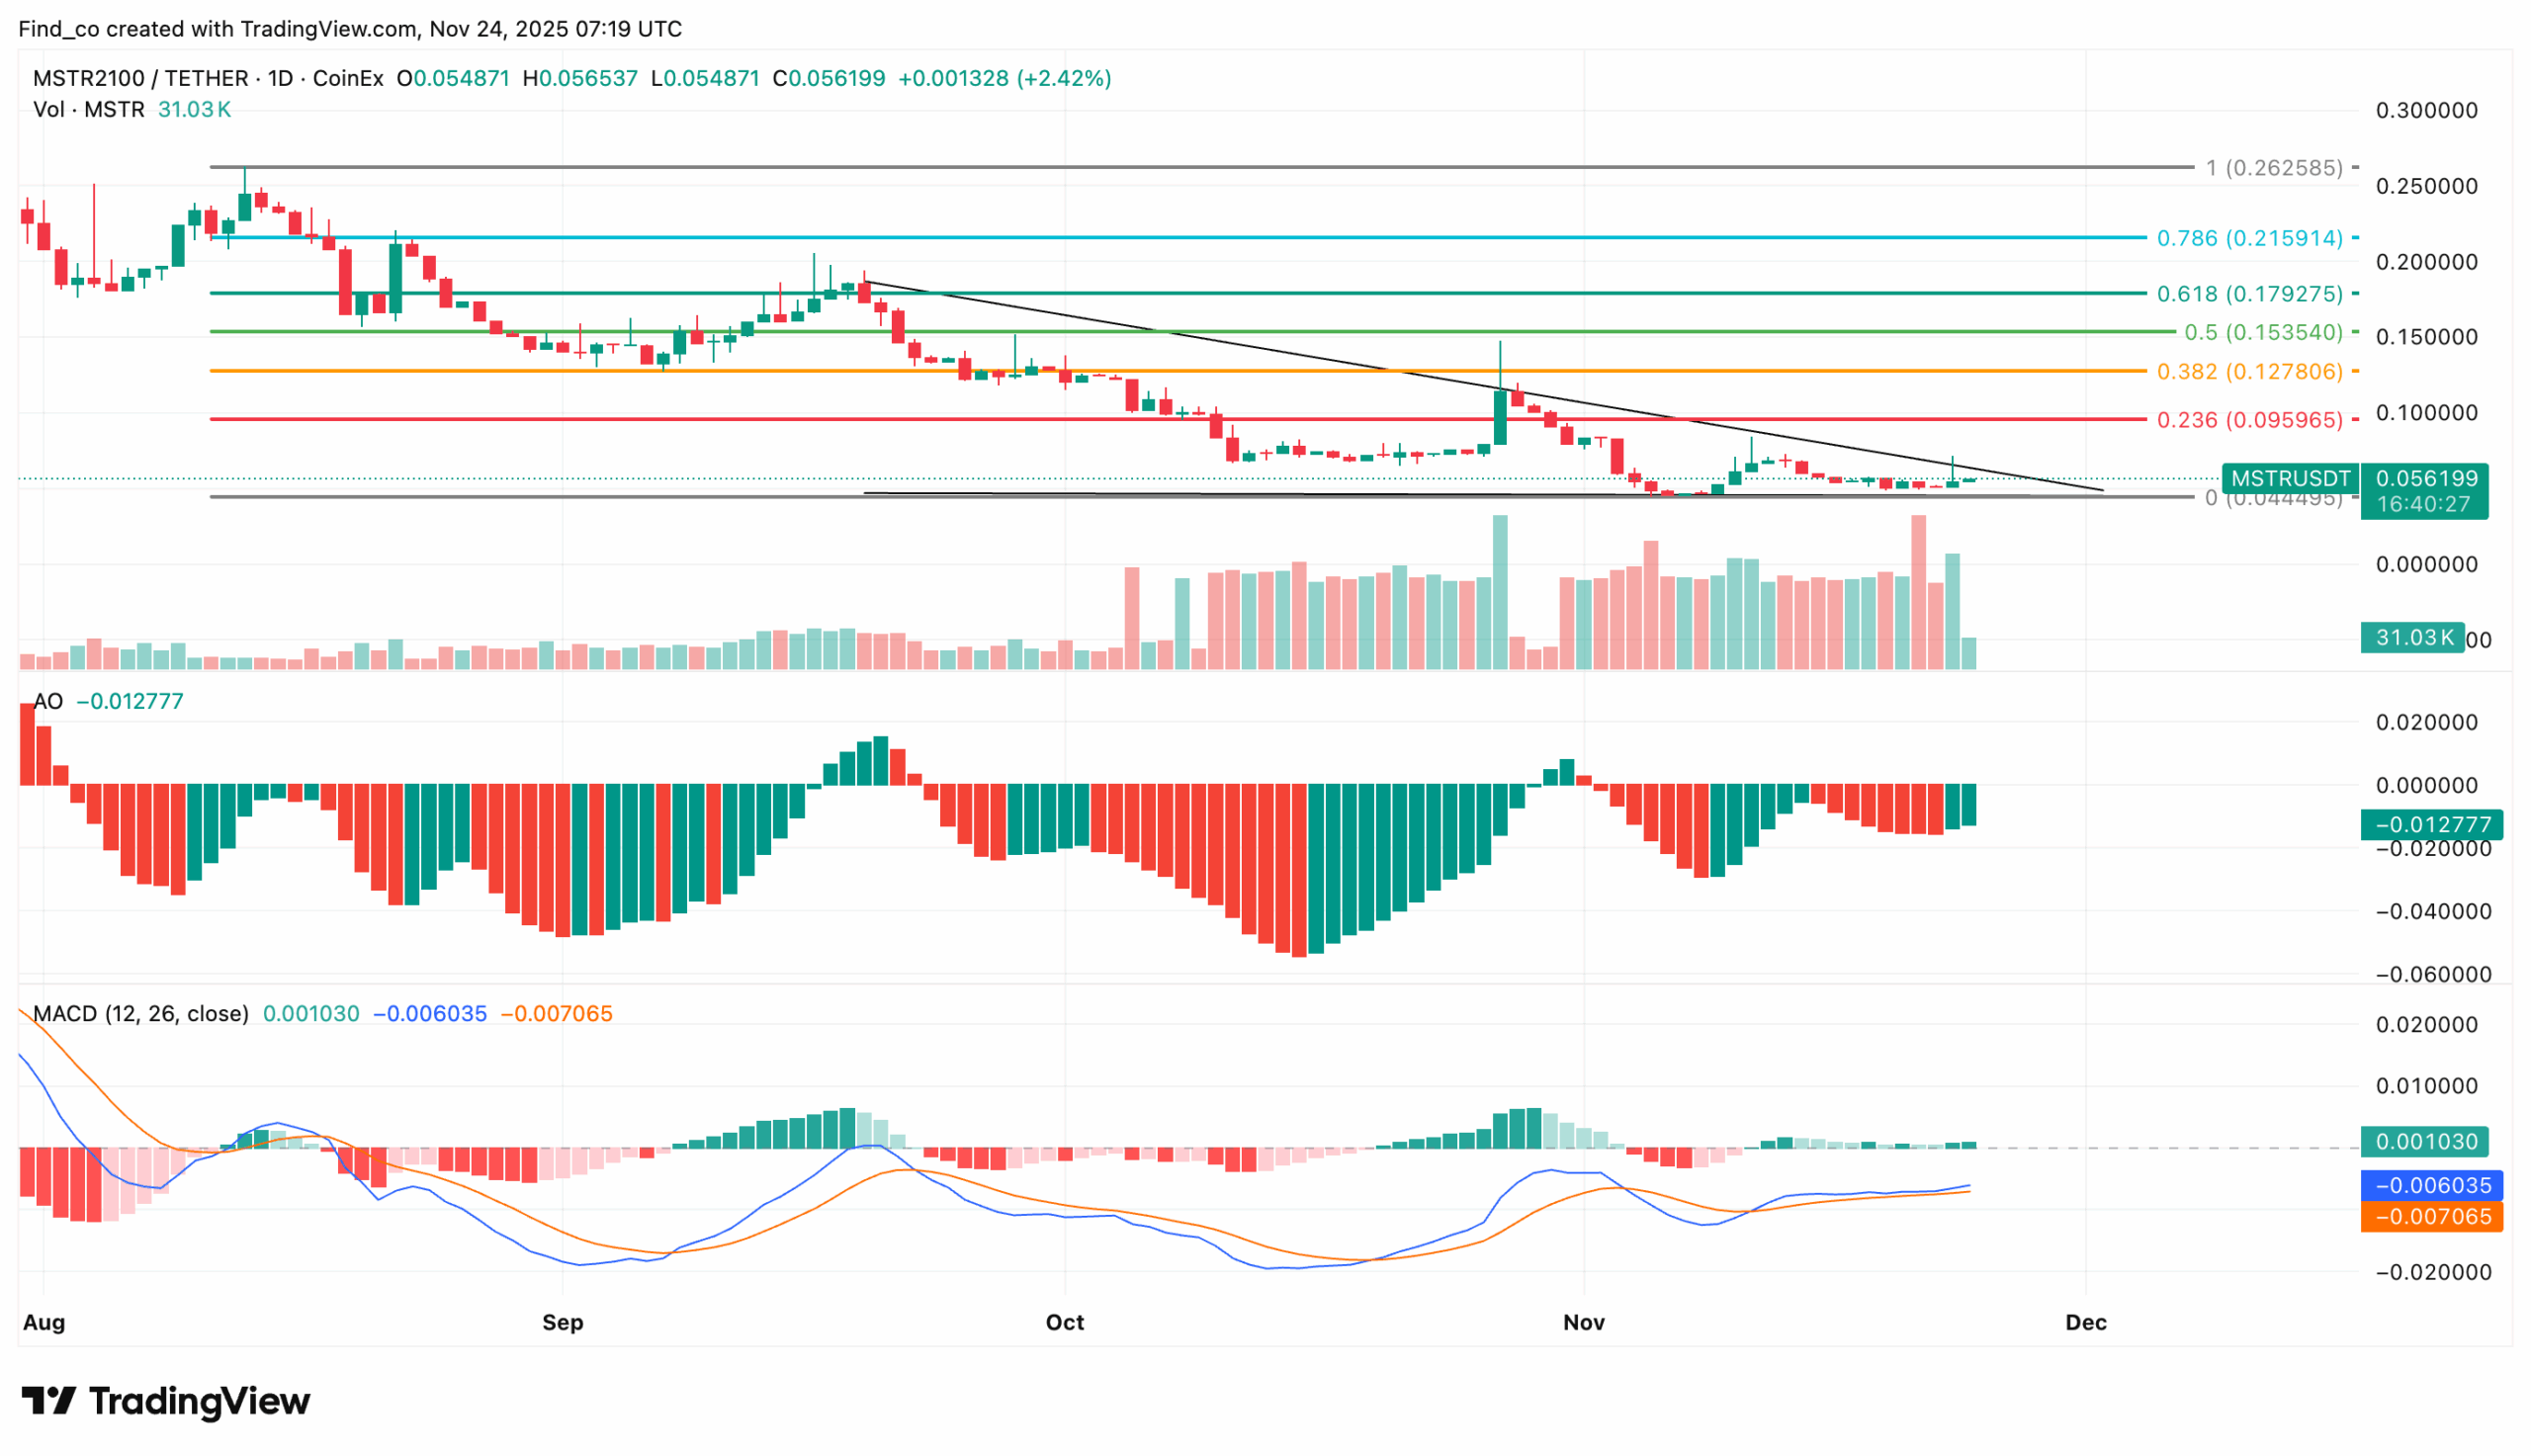
The token has dropped 66% over the last 90 days, wiping out most of its earlier gains.
However, over the past 24 hours, MSTR finally showed signs of life, bouncing sharply off its recent lows.
Is this the beginning of a meaningful recovery or just another brief fakeout in a larger downtrend? Here’s what the charts suggest.
MSTR2100 Tests Key Trendline
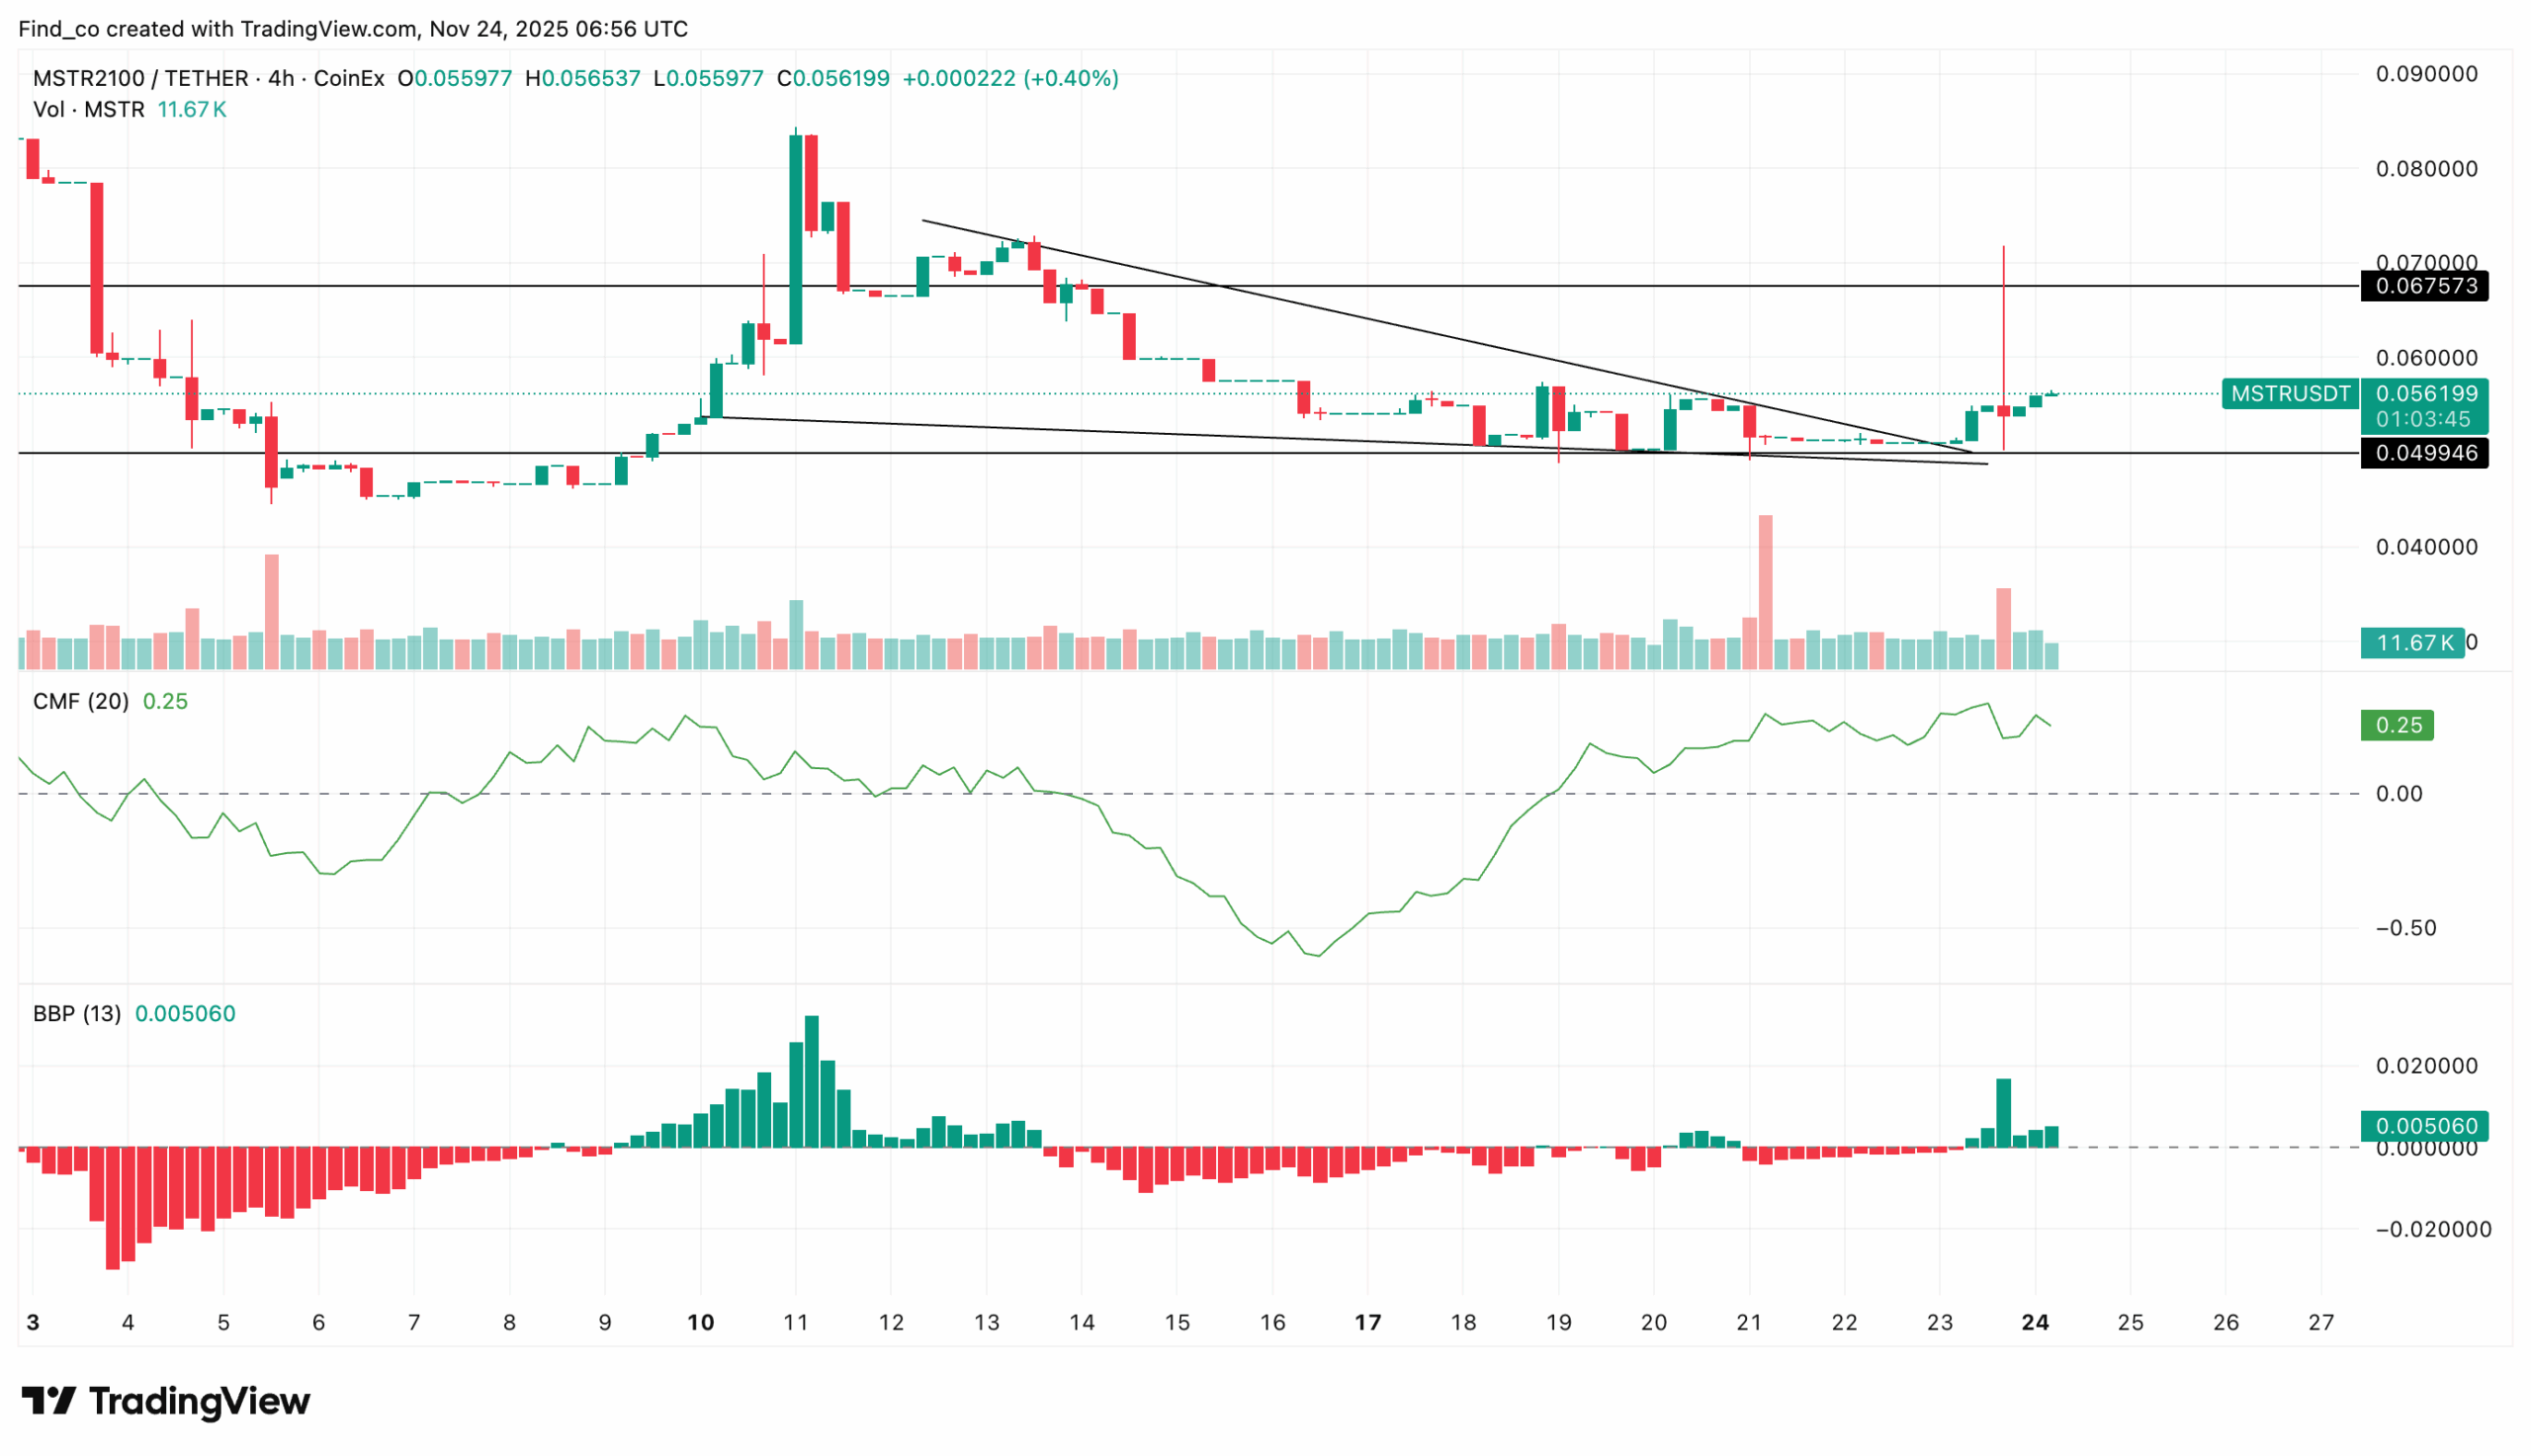
On the 4-hour chart, MSTR’s price has bounced sharply after breaking above the upper trendline of a falling wedge, signaling a potential shift in market structure.
Previously, the token consistently formed lower highs and lower lows; however, the trend has now shifted.
Bulls have successfully defended the $0.05 support, preventing the price from reverting to its former downtrend.
Get These Top Crypto Casino Offers Now!
Sponsored
Disclosure
We sometimes use affiliate links in our content, when clicking on those we might receive a commission at no extra cost to you. By using this website you agree to our terms and conditions and privacy policy.
If these conditions hold, MSTR may continue its rebound toward higher resistance zones.
Engagement Reinforces Recovery
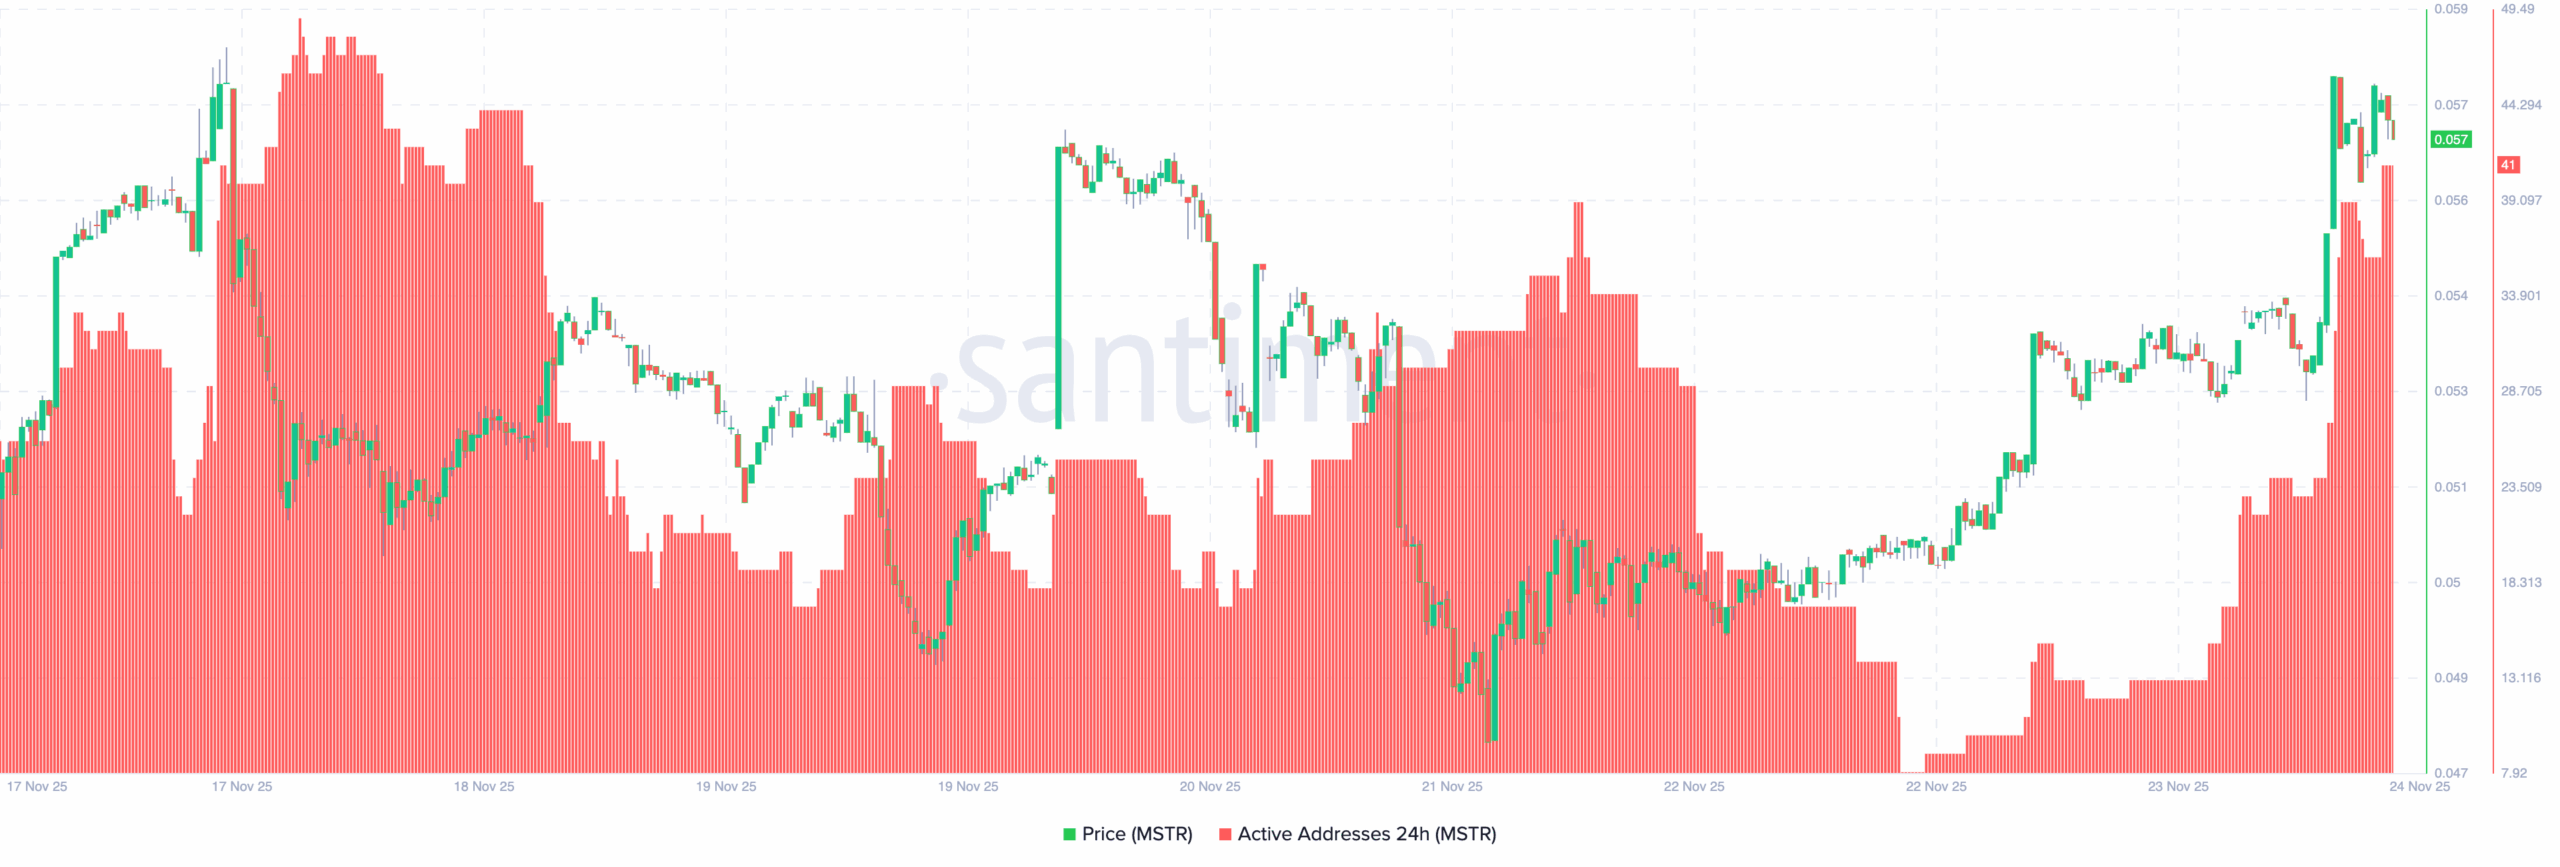
From an on-chain perspective, the number of active addresses has also increased, indicating a rise in participation in the MSTR network.
Typically, this trend precedes or confirms bullish momentum, as it indicates that more participants are interacting with the token rather than leaving their wallets dormant.
Increased activity can enhance liquidity, strengthen market depth, and attract new buyers.
Therefore, if active address growth continues, it could reinforce the recent upward shift in MSTR’s price.
Disclaimer:
The information provided in this article is for informational purposes only. It is not intended to be, nor should it be construed as, financial advice. We do not make any warranties regarding the completeness, reliability, or accuracy of this information. All investments involve risk, and past performance does not guarantee future results. We recommend consulting a financial advisor before making any investment decisions.
Victor Olanrewaju is a crypto analyst and reporter at CCN with deep roots in on-chain research and technical analysis. His crypto journey began in 2017, but it was the 2020 Uniswap airdrop that sparked a full-time pivot into the space.
With a foundation in copywriting, Victor honed his craft creating high-converting content for leading crypto brokers — most notably an XRP price prediction that ranked #1 on Google during the 2021 bull run.
He later joined AMBCrypto in 2022, where he combined storytelling with technical and on-chain analysis to cover key market narratives.
In 2024, he expanded his expertise at BeInCrypto, collaborating with analysts and using tools like Glassnode, Santiment, and IntoTheBlock to break down Bitcoin and altcoin trends.
At CCN, Victor covers the top cryptocurrencies, memecoins, macro shifts, blending real-time insights with deep-dive metrics.
He holds a Bachelor’s degree in Physics from the University of Ibadan, equipping him to simplify complex data for a wide audience. Follow his work or connect on LinkedIn or X.