Can Litecoin Prevent a Breakdown? | Credit: Hameem Sarwar
Share
Key Takeaways
Litecoin is currently trading below the critical $110 resistance level.
LTC fell in December 2024 but is retesting its previous breakout level.
Will LTC regain momentum and move above $100, or will it break down instead?
After a long decline since June 2023, Litecoin (LTC) sprang to life in November 2024, surging by an impressive 120% in under two months.
However, the rally was short-lived. Instead of closing the year on a high note, Litecoin tumbled 40% from its Dec. 5 peak of $147.22.
As 2025 unfolds, the LTC finds itself teetering near a crucial support level. With technical charts suggesting a potential breakdown, the pressing question is whether Litecoin can rally for a rebound or if further declines are on the horizon.
Since June 2023, Litecoin (LTC) has been caught in a downward spiral, locked by a descending resistance trend line. Throughout this decline, LTC consistently failed to overcome the $110 horizontal resistance level, forming a series of lower highs.
The tide seemed to turn in November 2024 when Litecoin broke through this stubborn resistance, sparking optimism among investors. The breakout, which saw LTC climb above $110, suggested a potential shift towards a bullish trend.
However, the rally was short-lived. Litecoin quickly fell back below the $110 threshold, dampening the initial excitement.
Despite this setback, there’s a glimmer of hope: LTC has twice validated the descending resistance line as a support level, evidenced by long lower wicks on the weekly chart.
On the technical front, the indicators are sending mixed signals. Both the Relative Strength Index (RSI) and the Moving Average Convergence/Divergence (MACD) are trending downward.
Yet, neither has triggered bearish divergence, and both remain above their bullish thresholds of 50 and 0, respectively.
The current technical setup offers no clear verdict on whether LTC’s trend will turn bullish or continue its bearish trajectory, leaving the market in a state of cautious anticipation.
Is the Correction Over?
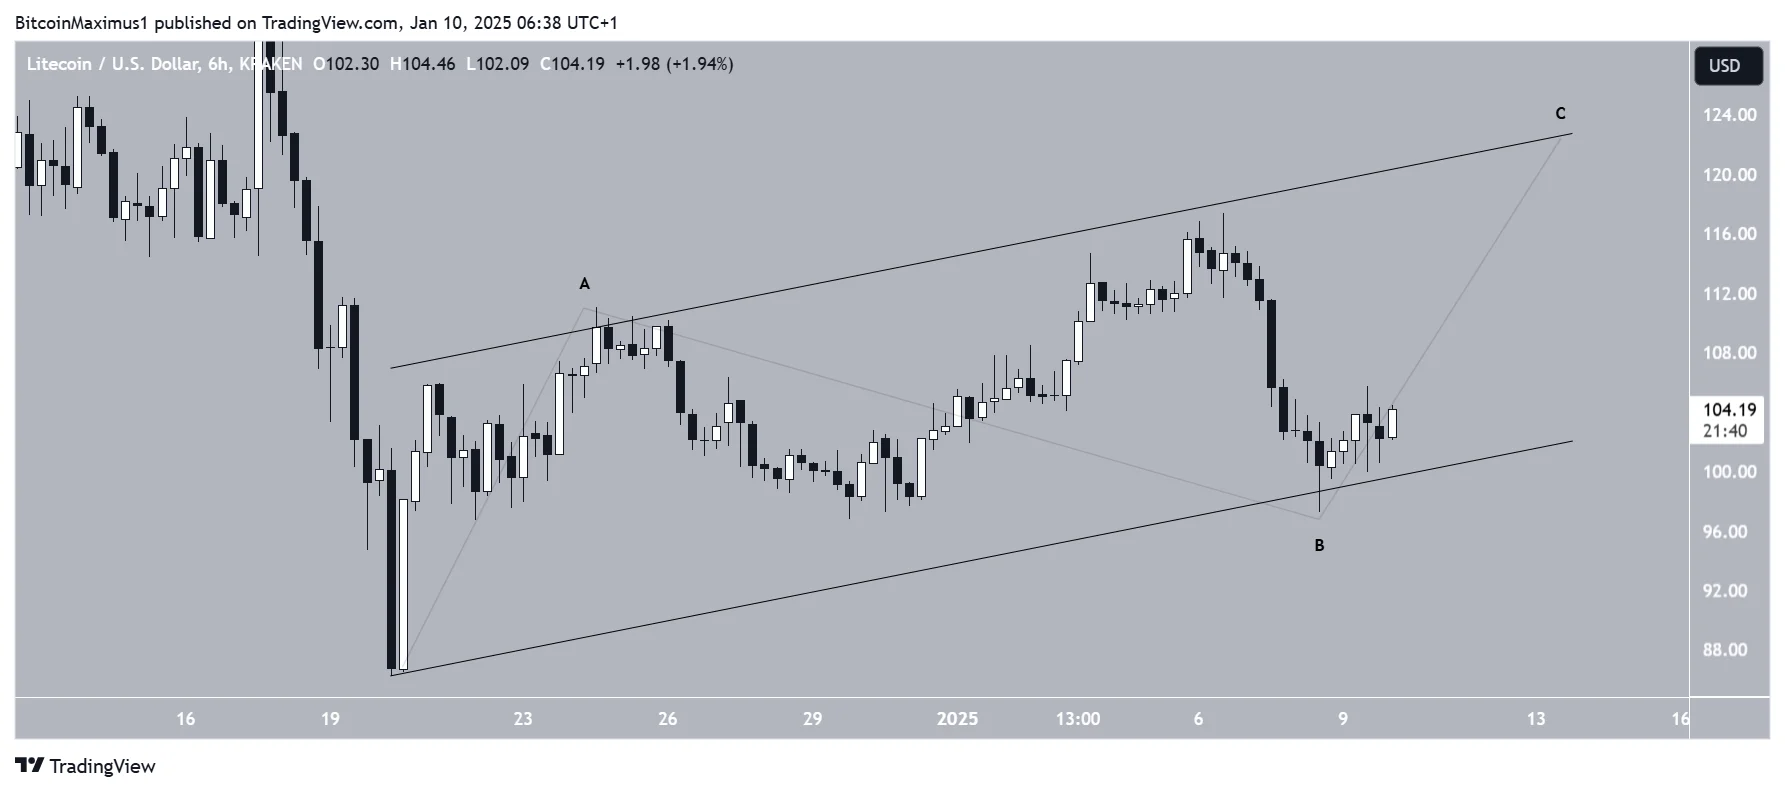
Litecoin’s recent wave count suggests a completed A-B-C corrective pattern since Dec. 5, 2024. The symmetry between waves A and C, with an equal ratio, reinforces the validity of this structure.
In the broader context, wave C appears to have finalized a fourth-wave pullback, aligning with a long-term trend where the low point validated the resistance trend line connecting waves one and two.
If this wave count holds, Litecoin may have started its fifth and final wave of upward movement, targeting a price of $184. This target is derived from the 1.61 external Fibonacci retracement of wave four.
While the wave count is positive, there is no confluence with technical indicators since the RSI and MACD are neutral.
Adding to the uncertainty, the recent short-term bounce appears as a corrective A-B-C structure within a parallel channel, suggesting both the recent decline and rebound are corrective in nature.
Given this mixed technical landscape, neither the weekly nor daily time frames offer a clear signal on whether Litecoin’s trend is bullish or bearish. The short-term outlook leans bullish, but the reaction at the crucial $110 level will likely provide clearer direction for the long-term trend.
Future Trend Unclear
Litecoin showed promise by breaking out from a long-term resistance trend line and the $110 area but squashed it with the following breakdown below. While LTC still trades above the resistance trend line, it needs to move above $110 to begin a bullish trend. Conversely, falling below the trend line will mean the trend is bearish instead.
Disclaimer:
The information provided in this article is for informational purposes only. It is not intended to be, nor should it be construed as, financial advice. We do not make any warranties regarding the completeness, reliability, or accuracy of this information. All investments involve risk, and past performance does not guarantee future results. We recommend consulting a financial advisor before making any investment decisions.
Valdrin Tahiri is a cryptocurrency analyst and reporter at CCN, specializing in technical analysis with a focus on Elliott Wave theory, on-chain metrics, and fundamental research. He brings over seven years of experience in the crypto space as both a trader and writer.
He discovered cryptocurrencies in 2017 while earning his MSc in Financial Markets at the Barcelona School of Economics, which sparked a deep interest in blockchain and market dynamics. Since then, he’s contributed to top crypto outlets like BeInCrypto and CoinGape.
Valdrin also served as Community Manager of BeInCrypto’s Telegram group for three years, helping grow it into one of the largest crypto communities worldwide. His expertise in market structure and price patterns allows him to break down complex trends into clear, actionable insights.
He’s published thousands of articles covering altcoins, Bitcoin cycles, and macro trends.