KAVA price recovers over 20% since the recent sharp decline. Is this an early sign of a new bullish advancement?
Share
Key Takeaways
The ABC correction points to potential support at $0.38 or $0.28 before recovery.
Breaking the $0.63 resistance is crucial for bullish confirmation.
A move above $0.74 invalidates bearish scenarios and signals continuation upward.
KAVA has shown significant recovery since its accumulation phase between July and November, breaking out from $0.28 to a high of $0.74 in December.
Despite this, rejection at resistance and a pullback to $0.48 signal ongoing corrective movement. Momentum above $0.58 is critical for further bullish progress.
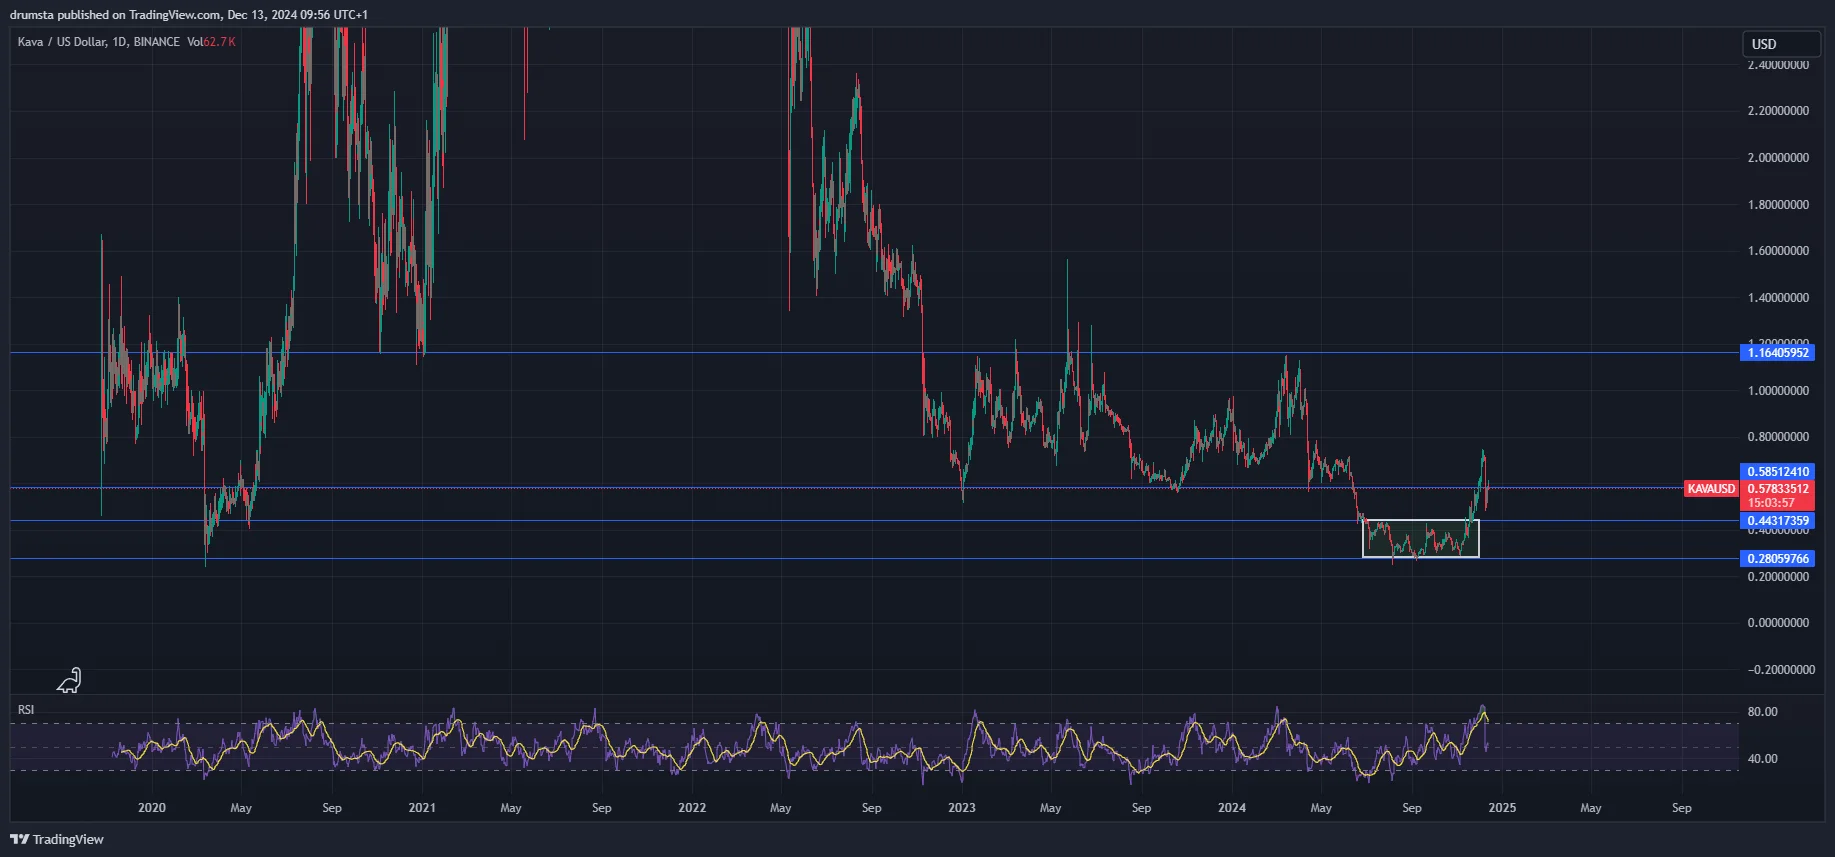
The KAVA chart on the daily timeframe shows a clear accumulation phase, marked by the boxed range near the lows from July 3 to November 4.
These lows, around $0.28, were last seen in March 2020 and were the lowest price ever. A breakout occurred in mid-November, pushing prices higher above the next resistance level of $0.58 and a high of $0.74 on Dec. 6.
KAVAUSD breakout from accumulation phase | Credit: Nikola Lazic/TradingView
This recent breakout suggested a shift in market sentiment, but rejection at resistance is notable.
The daily chart Relative Strength Index (RSI) indicates reached overbought conditions following the last peak, after which it fell to mid-range at 50% following the 33% price decrease to a low of $0.48.
The overall trend remains bearish from the macro perspective, but the recovery from the range lows signals a potential bottom formation.
From Dec. 10, we saw a recovery to $0.61, but the price is now trading slightly lower, up by 20% since its last low.
Sustained momentum above $0.58 is critical to confirm a bullish reversal. Key indicators suggest consolidation or a retest of breakout levels before further moves.
Key Observations:
The price formed a clear accumulation range near $0.28–$0.44 before breaking out.
$0.58 acts as immediate resistance, while $1.16 represents a higher target.
RSI suggests improving momentum and leaving oversold territory.
Rejection at $0.58 could signal a retest of lower levels.
Sustained movement above $0.58 is required for bullish confirmation.
KAVA Price Prediction
The 4-hour chart shows a potential Elliott Wave count, with the recent high marking the completion of wave (v). A corrective ABC pattern appears to be forming, with wave (a) potentially complete and wave (b) in progress.
Fibonacci retracement levels indicate key areas for potential reversal during the correction.
KAVAUSD two outlooks possible | Credit: Nikola Lazic/TradingView
Two possibilities are ahead as the price reached the 0.5 Fib level on Dec. 10. Either the correction is finished, and a new upward advancement started, or it has one more downtrend to 0.786 before it ends.
The RSI is neutral, suggesting room for further corrective movement before a definitive trend emerges.
To confirm either outlook, we will look at the current high end, as we primarily assume it’s the (b) wave, which should exceed the $0.63 resistance at the 0.236 Fib.
If wave (c) follows, the price could test deeper support near $0.38 or $0.28, aligning with the 0.786 and full retracement levels. A recovery above $0.74 would invalidate the correction scenario, confirming renewed bullish momentum.
Key Levels to Watch:
Resistance: $0.58 (0.236 Fib), $0.63 (0.382 Fib), and $0.74.
A break above $0.74 confirms a bullish continuation.
Failure to hold $0.44 increases the likelihood of testing $0.38 or $0.28.
Disclaimer:
The information provided in this article is for informational purposes only. It is not intended to be, nor should it be construed as, financial advice. We do not make any warranties regarding the completeness, reliability, or accuracy of this information. All investments involve risk, and past performance does not guarantee future results. We recommend consulting a financial advisor before making any investment decisions.
Nikola Lazic is a cryptocurrency analyst and investor working in the industry since 2017. He holds a bachelor's degree in Sociology, which enables him to better understand the psychology behind the crowd´s positioning. Consequently his preferred analytical tool is Elliott Wave Theory in combination with price action analysis.
Combining his experience in trading and investing with knowledge in content writing he strives to bring the most accurate and actionable information.