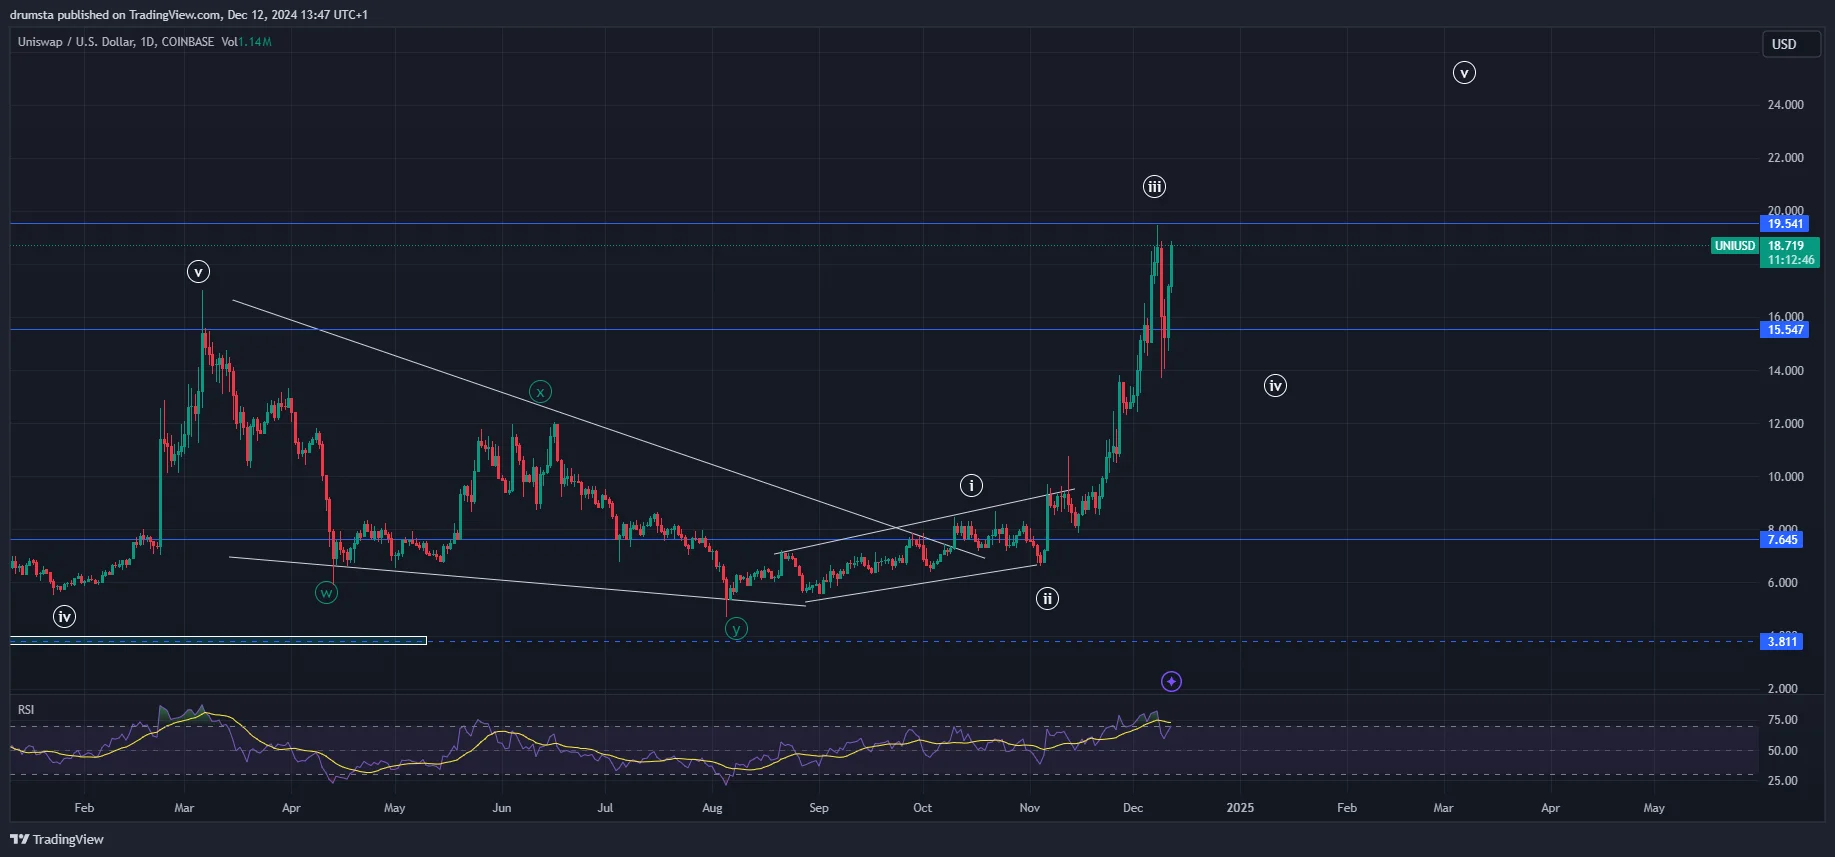
The UNI daily chart shows a strong breakout from a descending triangle in late October, followed by an impulsive five-wave structure.
Before entering a corrective phase, the price peaked at $19.54 in wave (iii) on Dec 8. The breakout from the triangle in early November was supported by increased volume, signaling renewed bullish sentiment and upward momentum.
UNIUSD at a prior high | Credit: Nikola Lazic/TradingView
Following the peak, UNI retraced to $14.41 on Dec 10, aligning with prior resistance turned support. The RSI cooled from overbought conditions, indicating a consolidation phase or deeper correction.
Maintaining support above $14.41 would confirm a bullish continuation, while a breakdown could target deeper retracement levels.
If bullish momentum resumes, UNI could retest the $19.54 peak and aim for higher Fibonacci extensions. Conversely, failure to hold current support could lead to a correction toward $12 or lower.
Key Observations:
UNI broke out of a descending triangle, signaling a bullish reversal.
Immediate support lies at $14.41, aligning with prior resistance.
RSI cooling suggests consolidation before the next move.
Uni Price Prediction
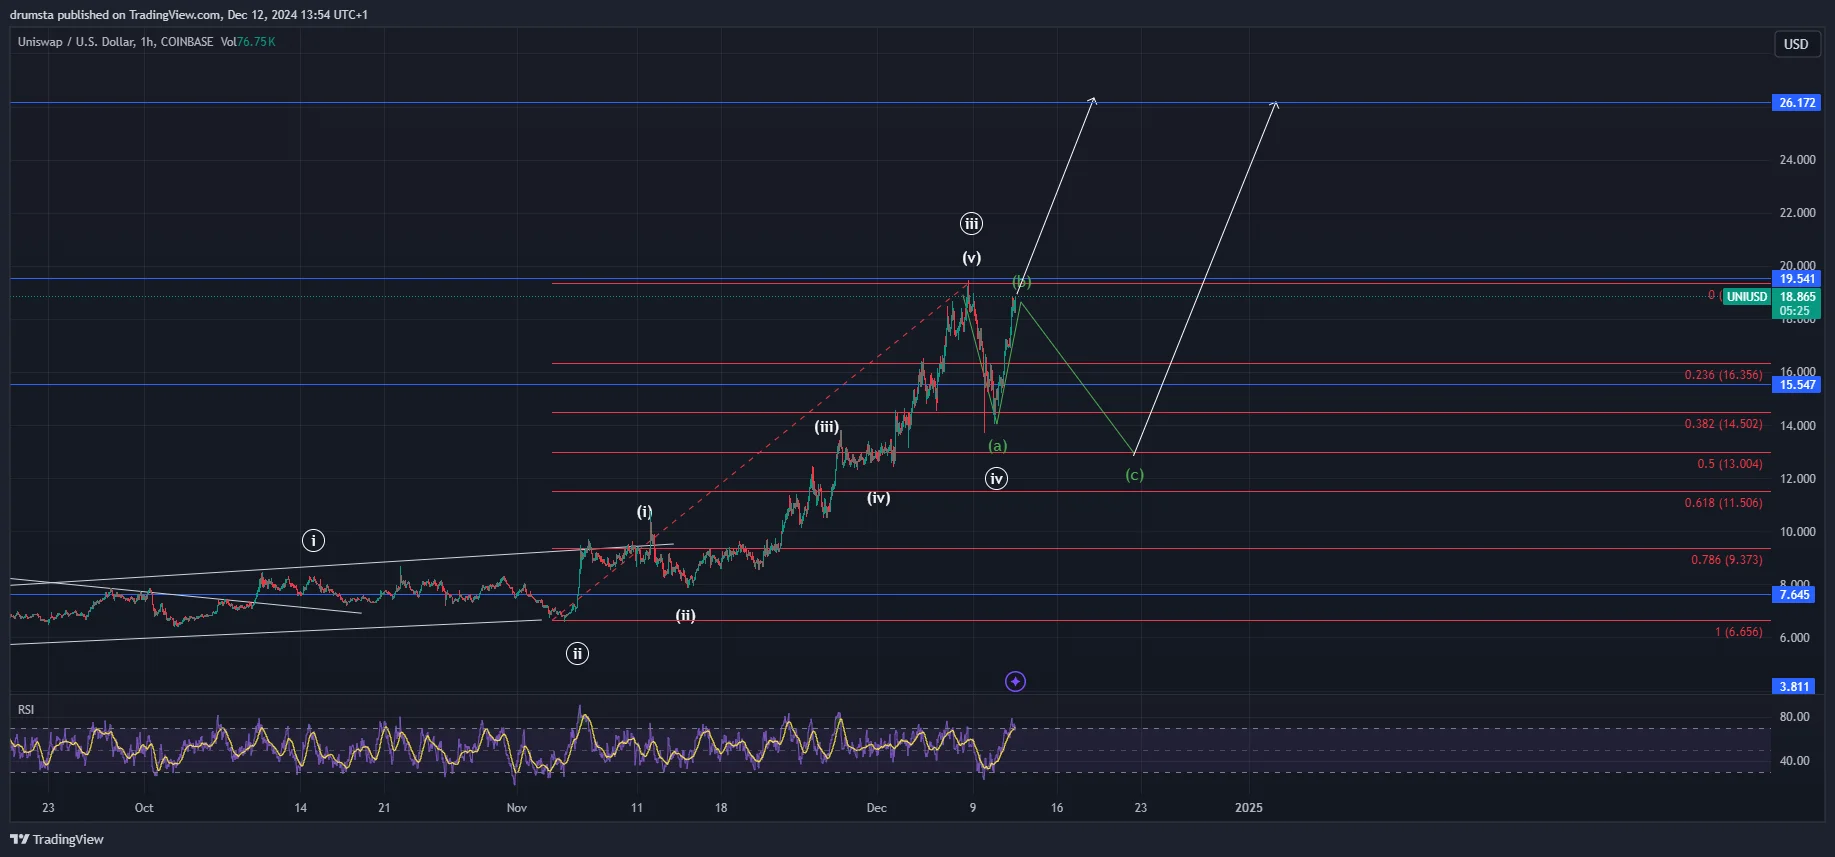
The UNI hourly chart illustrates the token entering a corrective ABC pattern following a five-wave impulsive structure peaking at $19.54.
Wave (a) has retraced to $14.41, aligning with the 0.382 Fibonacci retracement level. Wave (b) has shown recovery toward $18.87, signaling potential resistance before wave (c) continues.
UNIUSD further correction more likely | Credit: Nikola Lazic/TradingView
The RSI indicates recovering momentum after wave (a), suggesting wave (b) may be near its peak.
Immediate resistance is near $19.54, coinciding with the previous peak. Failure to sustain momentum could result in a deeper correction targeting $14.50 (0.382 Fibonacci retracement). Maintaining support at $14.50 is critical to avoid a prolonged bearish structure.
If UNI sustains bullish momentum, a breakout above $19.54 could target $26.17, aligning with Fibonacci extensions for wave (v).
However, continued correction could push the price toward $13 or lower, providing accumulation opportunities before the next bullish rally.
Key Levels to Watch:
Support Levels:
$14.50: Major support near the 0.382 Fibonacci retracement.
$13.00: Critical support at the 0.5 Fibonacci retracement.
Resistance Levels:
$19.54: Key resistance at the previous peak.
$26.17: Wave (v) target based on Fibonacci projections.
Disclaimer:
The information provided in this article is for informational purposes only. It is not intended to be, nor should it be construed as, financial advice. We do not make any warranties regarding the completeness, reliability, or accuracy of this information. All investments involve risk, and past performance does not guarantee future results. We recommend consulting a financial advisor before making any investment decisions.
Nikola Lazic is a cryptocurrency analyst and investor working in the industry since 2017. He holds a bachelor's degree in Sociology, which enables him to better understand the psychology behind the crowd´s positioning. Consequently his preferred analytical tool is Elliott Wave Theory in combination with price action analysis.
Combining his experience in trading and investing with knowledge in content writing he strives to bring the most accurate and actionable information.