Key Takeaways
- Kaia (KAIA) has created a bullish triple-bottom pattern.
- The price also broke out from a descending wedge pattern.
- Can KAIA begin an upward movement toward new highs?
The KAIA blockchain officially launched on Aug. 29, following the merger of the Klaytn and Finschia blockchains. This highly anticipated merger, completed in October, fueled an impressive 260% rally through the end of November 2024.
However, December brought a sharp reality check as KAIA’s price plummeted by 55%, wiping out much of its earlier gains.
Now, as 2025 unfolds, renewed optimism is emerging. KAIA has formed a bullish pattern, sparking speculation that the correction may finally be behind it.
KAIA Eyes Bullish Reversal Amid Optimism
After peaking at $0.42 in December, KAIA’s price swiftly declined, forming a descending wedge—a pattern often seen as a precursor to a bullish breakout.
At the start of 2025, KAIA broke out from this pattern, signaling a potential end to the correction. This breakout was accompanied by a successful retest of the $0.21 horizontal support area, further solidifying the bullish case.
Notably, KAIA formed a triple bottom pattern within this support zone, a formation typically indicating a bullish reversal.
For this pattern to be confirmed, KAIA must close above the critical $0.24 horizontal resistance.
Should it succeed, the price could target the next resistance zone between $0.30 and $0.33, defined by the 0.5-0.618 Fibonacci retracement levels.
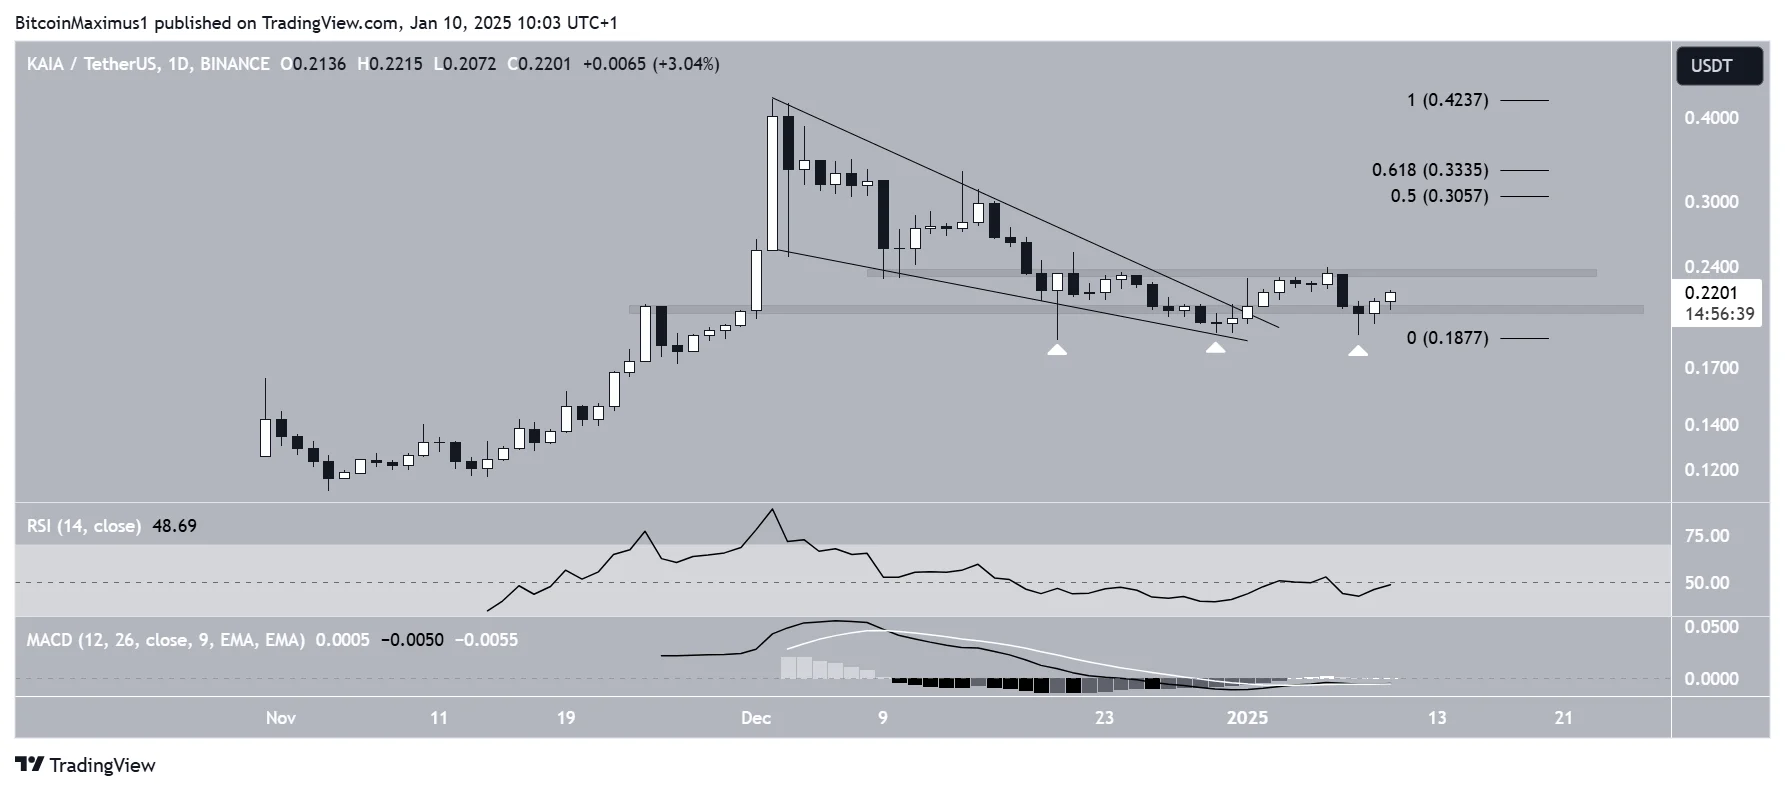
- KAIA/USDT Daily Chart | Credit: Valdrin Tahiri/TradingView
However, despite these encouraging signs, technical indicators remain cautious.
The Relative Strength Index (RSI) and Moving Average Convergence/Divergence (MACD) both trend upward but have yet to breach their bullish thresholds at 50 and 0, respectively.
Given this mixed technical outlook, it remains uncertain if KAIA’s bullish pattern will fully materialize. The coming days will be crucial in determining whether KAIA can sustain its upward momentum or if further consolidation lies ahead.
Bullish KAIA Prediction
While the price action and indicator readings are inconclusive, the wave count suggests new highs are likely.
The most likely wave count shows that KAIA has just completed a textbook fourth wave pullback by bouncing (white icons) at the previous ascending parallel channel.
This fits with the bullish triple-bottom pattern and suggests new highs are in store. Initially, the KAIA price will likely face resistance at $0.30-$0.33.
If it breaks through, the KAIA price can reach a high of $0.56. The 1.61 external Fibonacci retracement of wave four creates this target.
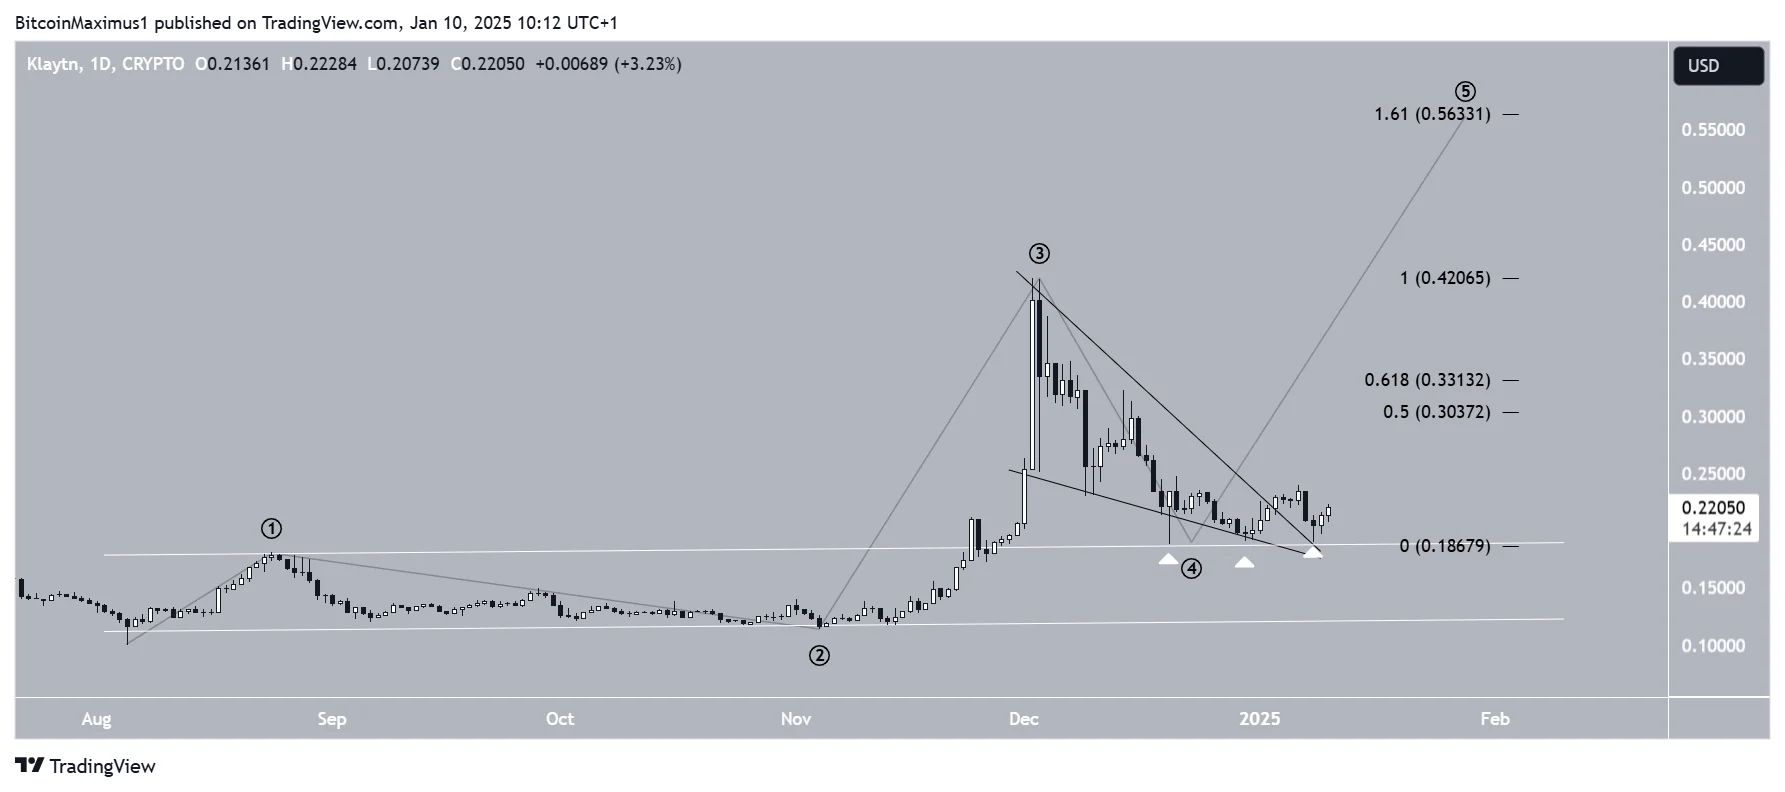
- KAIA/USDT Daily Chart | Credit: Valdrin Tahiri/TradingView
Since the high would mark the completion of a five-wave increase, KAIA could begin a lengthy correction after the upward movement is over.
New KAIA Highs Incoming
KAIA has created a bullish pattern inside horizontal support. It broke out from a descending wedge afterward, signaling a new upward movement. The wave count suggests KAIA will first increase toward $0.30-$0.33 and can reach $0.56 if it breaks out.
The information provided in this article is for informational purposes only. It is not intended to be, nor should it be construed as, financial advice. We do not make any warranties regarding the completeness, reliability, or accuracy of this information. All investments involve risk, and past performance does not guarantee future results. We recommend consulting a financial advisor before making any investment decisions.

Valdrin Tahiri is a cryptocurrency analyst and reporter at CCN, specializing in technical analysis with a focus on Elliott Wave theory, on-chain metrics, and fundamental research. He brings over seven years of experience in the crypto space as both a trader and writer.
He discovered cryptocurrencies in 2017 while earning his MSc in Financial Markets at the Barcelona School of Economics, which sparked a deep interest in blockchain and market dynamics. Since then, he’s contributed to top crypto outlets like BeInCrypto and CoinGape.
Valdrin also served as Community Manager of BeInCrypto’s Telegram group for three years, helping grow it into one of the largest crypto communities worldwide. His expertise in market structure and price patterns allows him to break down complex trends into clear, actionable insights.
He’s published thousands of articles covering altcoins, Bitcoin cycles, and macro trends.