HT price surges 300% in 24 hours, breaking its downtrend | Credit: Veronica Cestari
Share
Key Takeaways
Huobi Token surged 300% in 24 hours, joining BNB and OKB in the broader CEX-crypto rally.
The rising price DAA divergence has eased fears of price manipulation amid the HT breakout.
If bulls defend the current momentum, the Huobi Token market value price could climb higher.
Huobi Token (HT), the native asset of the HTX Global exchange, has surged onto the list of top-performing centralized exchange (CEX)-linked cryptos.
In the past 24 hours alone, HT’s price has skyrocketed 300%, marking one of its strongest rallies.
With the explosive move, HT’s price has climbed to its highest since February 2024 — an impressive 18-month high.
For traders familiar with recent market trends, HT’s explosive move may not be surprising.
Other CEX-linked cryptos, including BNB and OKB, have also rallied to new all-time highs in recent weeks, showing that exchange tokens are back in the spotlight.
However, the question remains: Will Huobi Token follow the same path?
Huobi Token Volatility Runs High
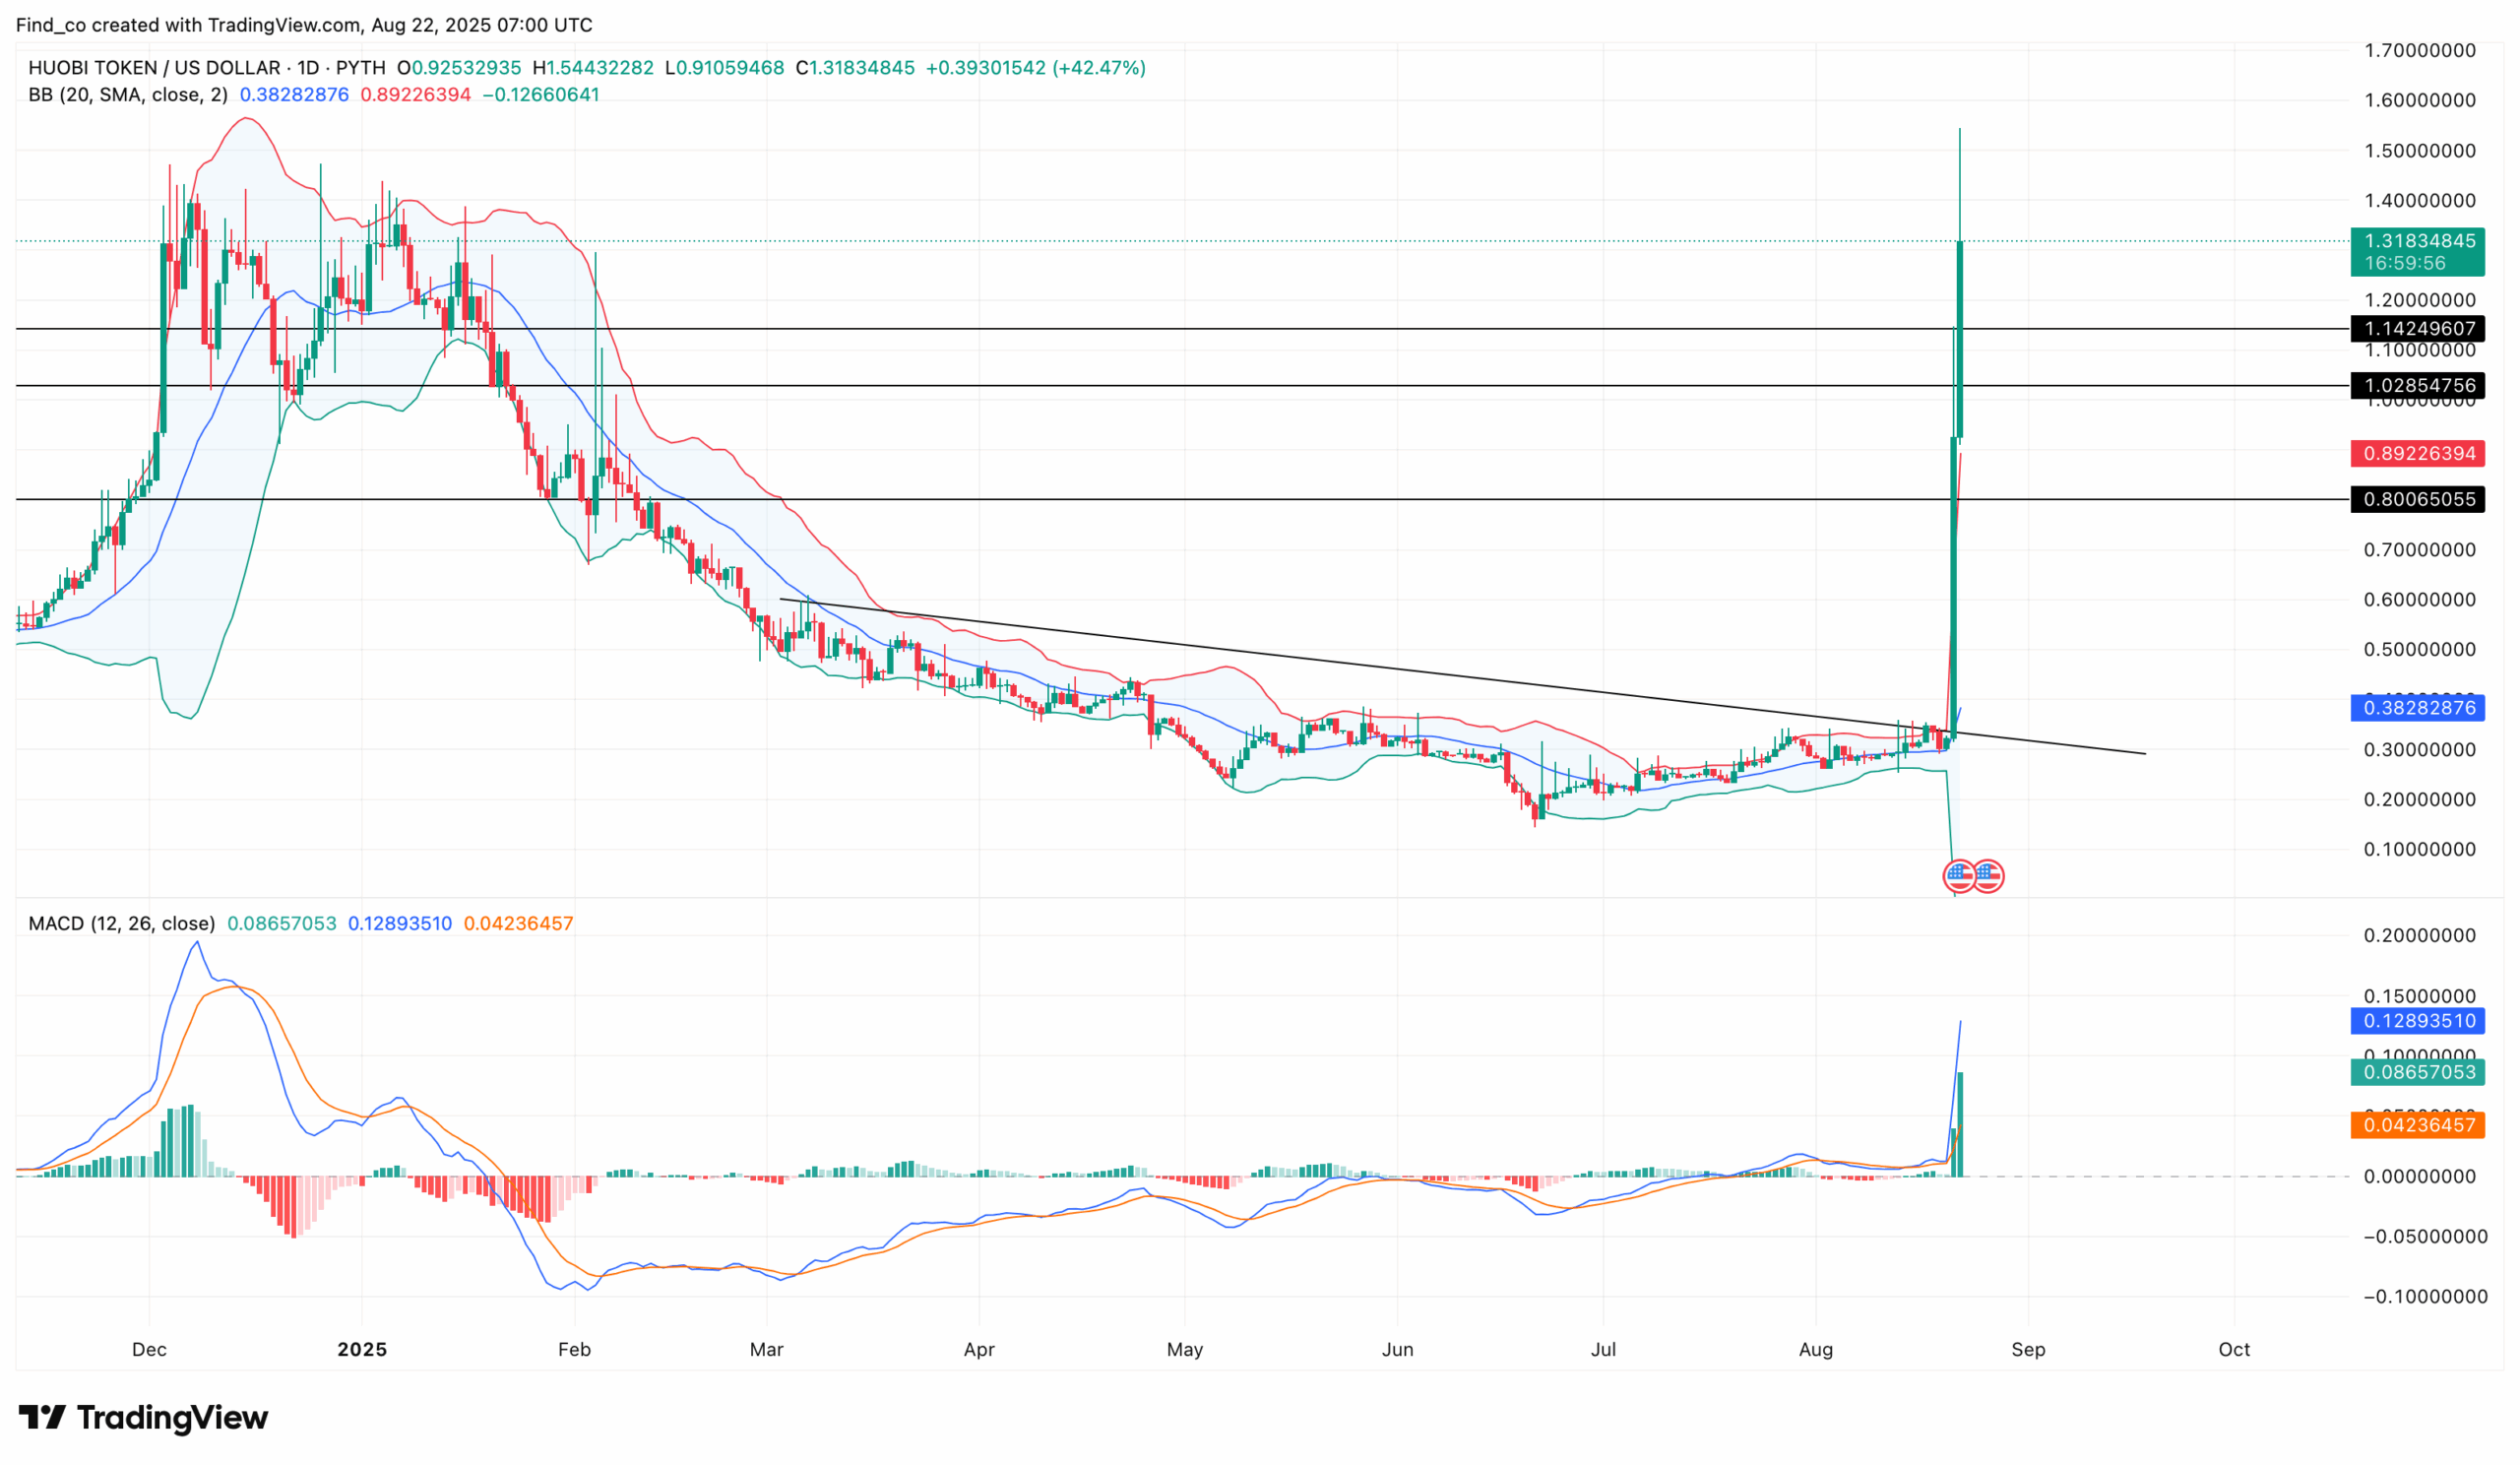
At press time, HT trades at $1.32, marking a notable recovery after breaking out of a downtrend that stretched back to March.
The daily chart shows that two consecutive bullish engulfing candles fueled HT’s surge.
This strong reversal signal confirmed buyers had regained control.
Get These Top Crypto Casino Offers Now!
Sponsored
Disclosure
We sometimes use affiliate links in our content, when clicking on those we might receive a commission at no extra cost to you. By using this website you agree to our terms and conditions and privacy policy.
Adding to the momentum, the Moving Average Convergence Divergence (MACD) has flipped bullish after a prolonged bearish stretch.
The bullish divergence suggests that buying strength is building, giving HT’s price the support it needs to sustain its rebound.
At the same time, the Bollinger Bands (BB) signal that HT is in overbought territory. The bands have expanded, indicating heightened volatility, while the price has touched the upper band — a sign of potential exhaustion in the rally.
This setup suggests that traders should exercise caution. If buying pressure fades, HT’s price could face a short-term correction toward $1.14, $1.03 or as low as $0.80.
Outside the technical outlook, a key update from HTX Global appears to have contributed to the Huobi Token rally. On Aug. 21, the exchange announced that users would experience zero freezes on deposits and withdrawals, addressing a long-standing concern in the community.
In the meantime, HT’s price surge does not appear to result from manipulation. One supporting factor is the rise in the price–Daily Active Addresses (DAA) divergence, which has jumped to 478.77%.
This spike suggests that network activity keeps pace with the rally, as more unique addresses interact with HT.
Should the price continue rising alongside the growing on-chain activity, the Huobi Token value might defy a correction as it is not artificially inflated.
HT Price Prediction: $2.08 In Sight
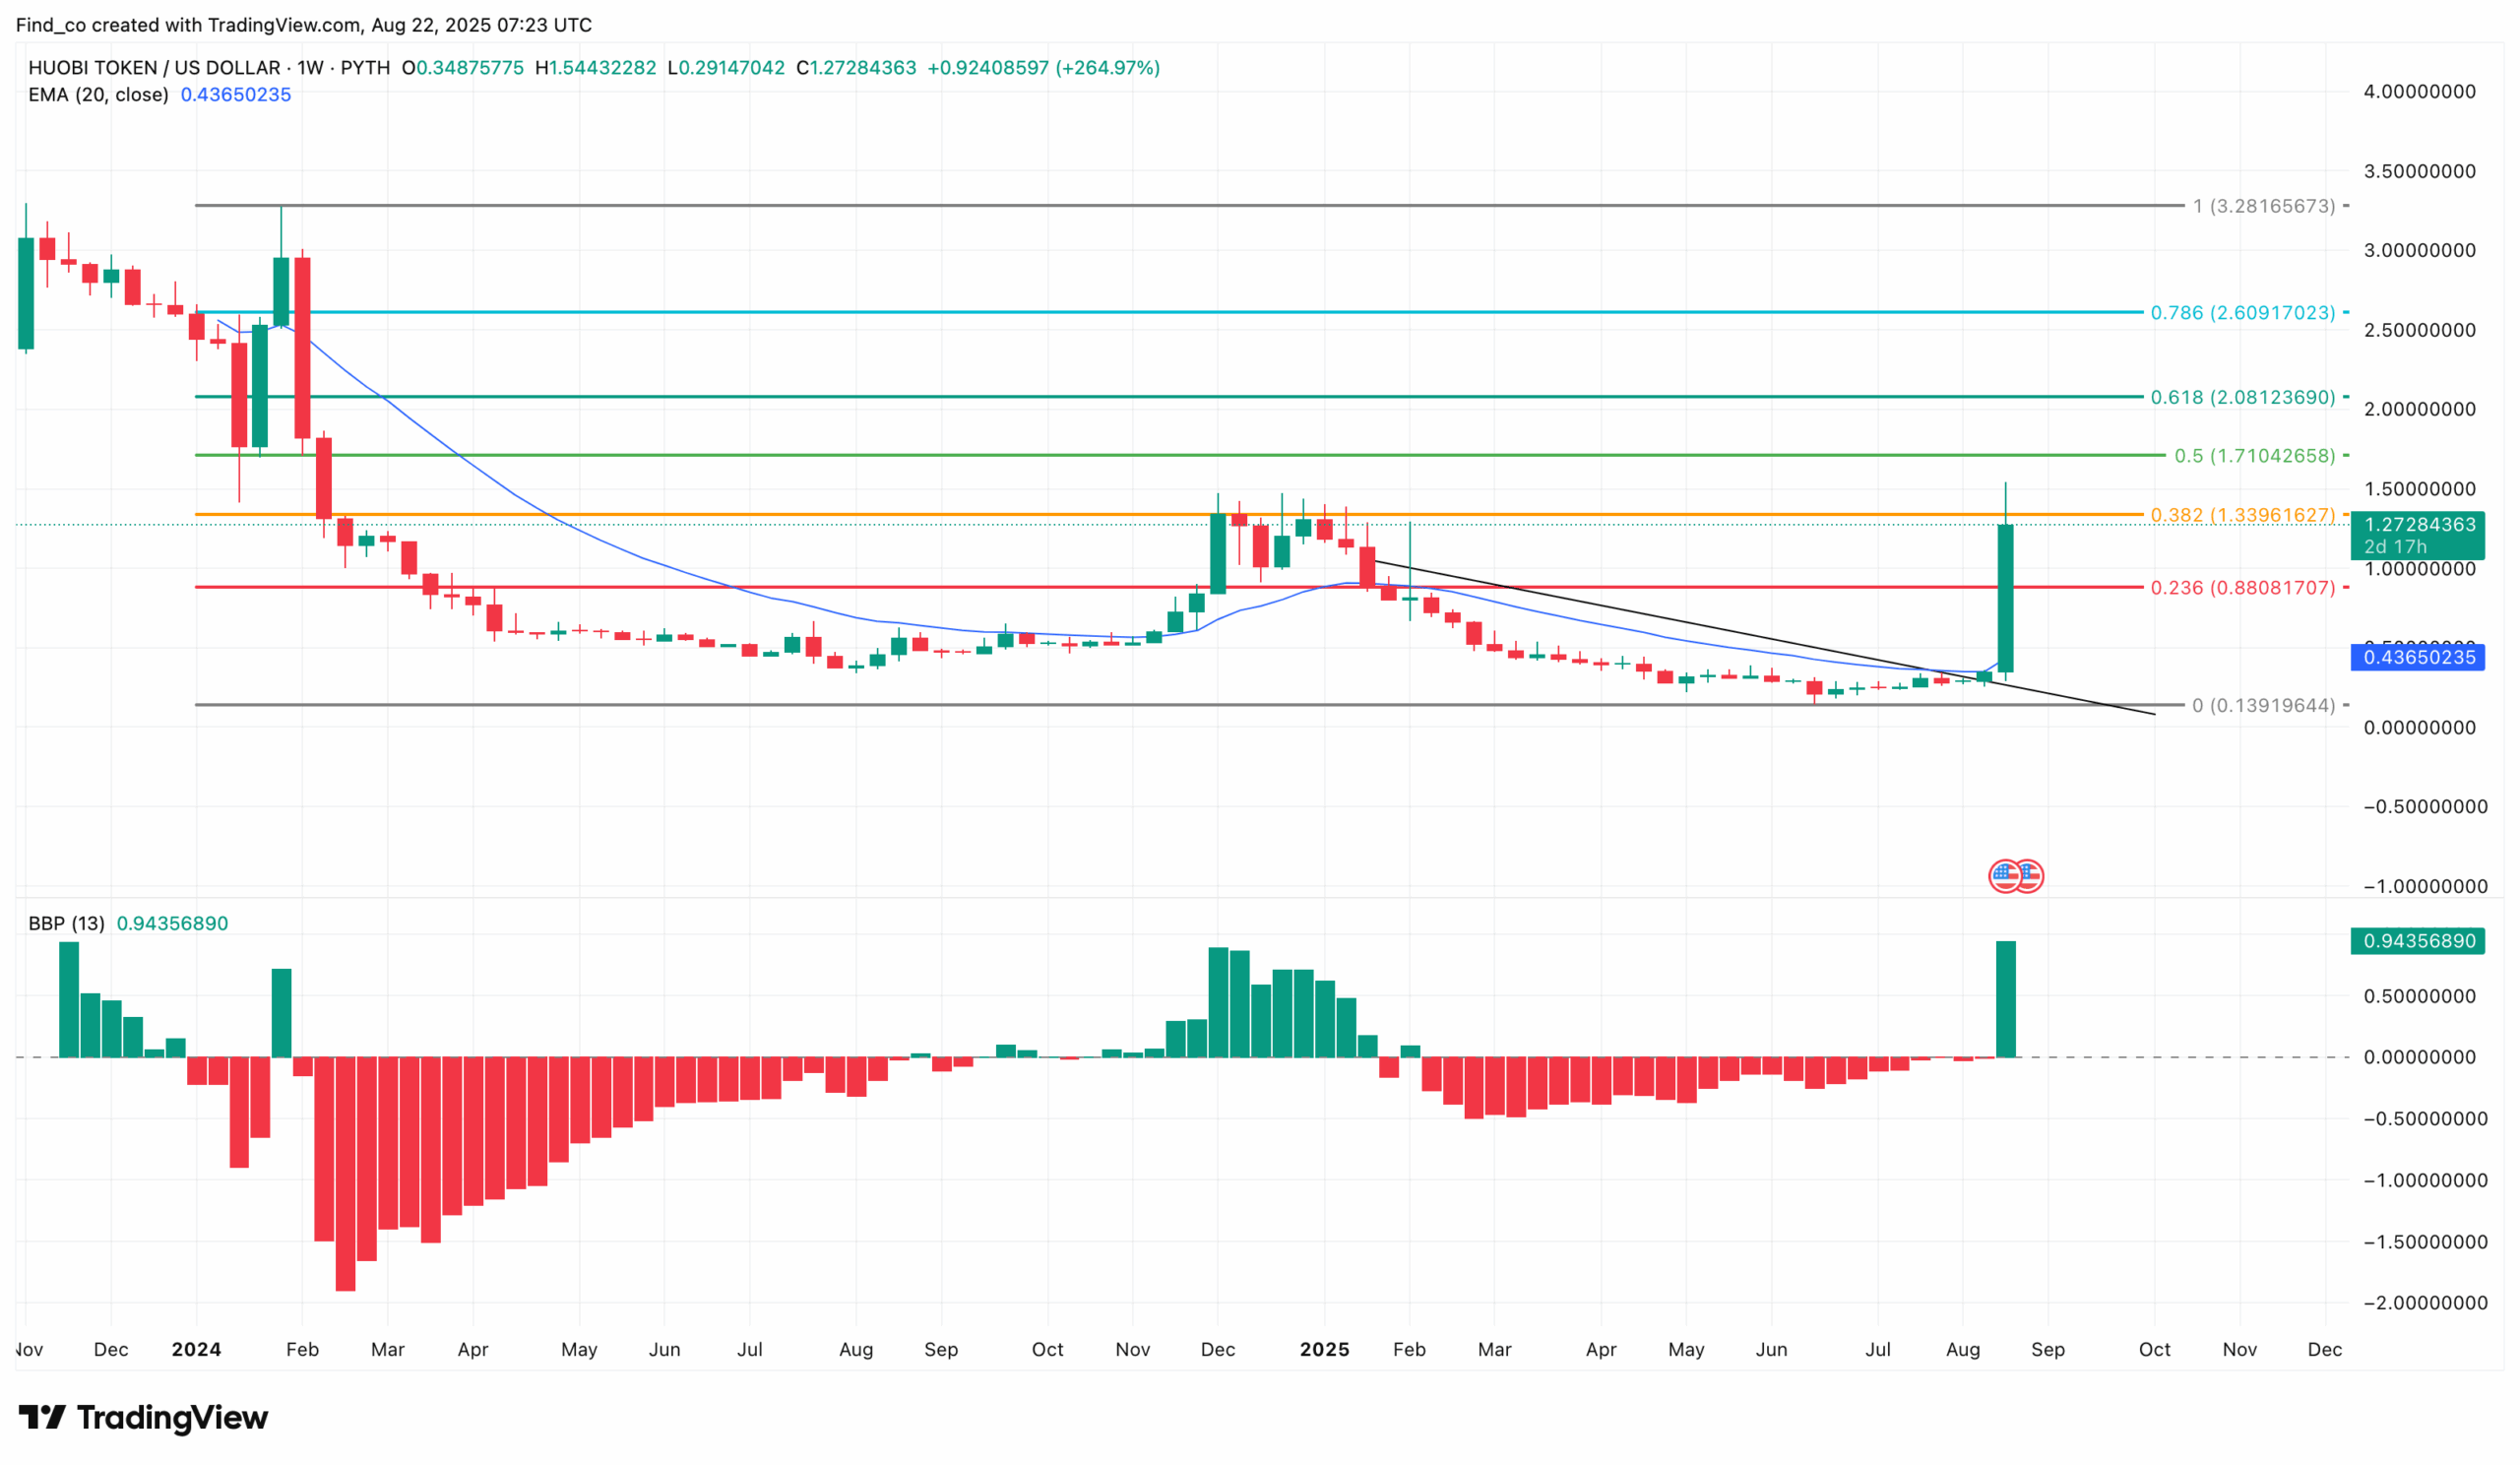
On the long-term timeframe, the weekly chart shows that HT has broken above a key resistance line. In the process, the cryptocurrency also climbed above the 20-day Exponential Moving Average (EMA), reinforcing its bullish momentum.
Adding weight to the rally, the Bull Bear Power (BBP) has turned positive for the first time since February. This shift signals buyers are regaining control on the higher timeframe, a strong confirmation that HT’s recovery may extend beyond the short-term spike.
If the current trend holds, HT’s price could brush aside the overbought signals and continue climbing. In the short term, the token may rally toward $2.08, which aligns with the 0.618 Fibonacci golden ratio.
Looking further ahead, if the broader bull market extends beyond this quarter, HT could target $3.28. However, unlike OKB and BNB, it may be difficult for Huobi Token to retest its all-time high anytime soon, as its recovery momentum still lags.
Disclaimer:
The information provided in this article is for informational purposes only. It is not intended to be, nor should it be construed as, financial advice. We do not make any warranties regarding the completeness, reliability, or accuracy of this information. All investments involve risk, and past performance does not guarantee future results. We recommend consulting a financial advisor before making any investment decisions.
Victor Olanrewaju is a crypto analyst and reporter at CCN with deep roots in on-chain research and technical analysis. His crypto journey began in 2017, but it was the 2020 Uniswap airdrop that sparked a full-time pivot into the space.
With a foundation in copywriting, Victor honed his craft creating high-converting content for leading crypto brokers — most notably an XRP price prediction that ranked #1 on Google during the 2021 bull run.
He later joined AMBCrypto in 2022, where he combined storytelling with technical and on-chain analysis to cover key market narratives.
In 2024, he expanded his expertise at BeInCrypto, collaborating with analysts and using tools like Glassnode, Santiment, and IntoTheBlock to break down Bitcoin and altcoin trends.
At CCN, Victor covers the top cryptocurrencies, memecoins, macro shifts, blending real-time insights with deep-dive metrics.
He holds a Bachelor’s degree in Physics from the University of Ibadan, equipping him to simplify complex data for a wide audience. Follow his work or connect on LinkedIn or X.