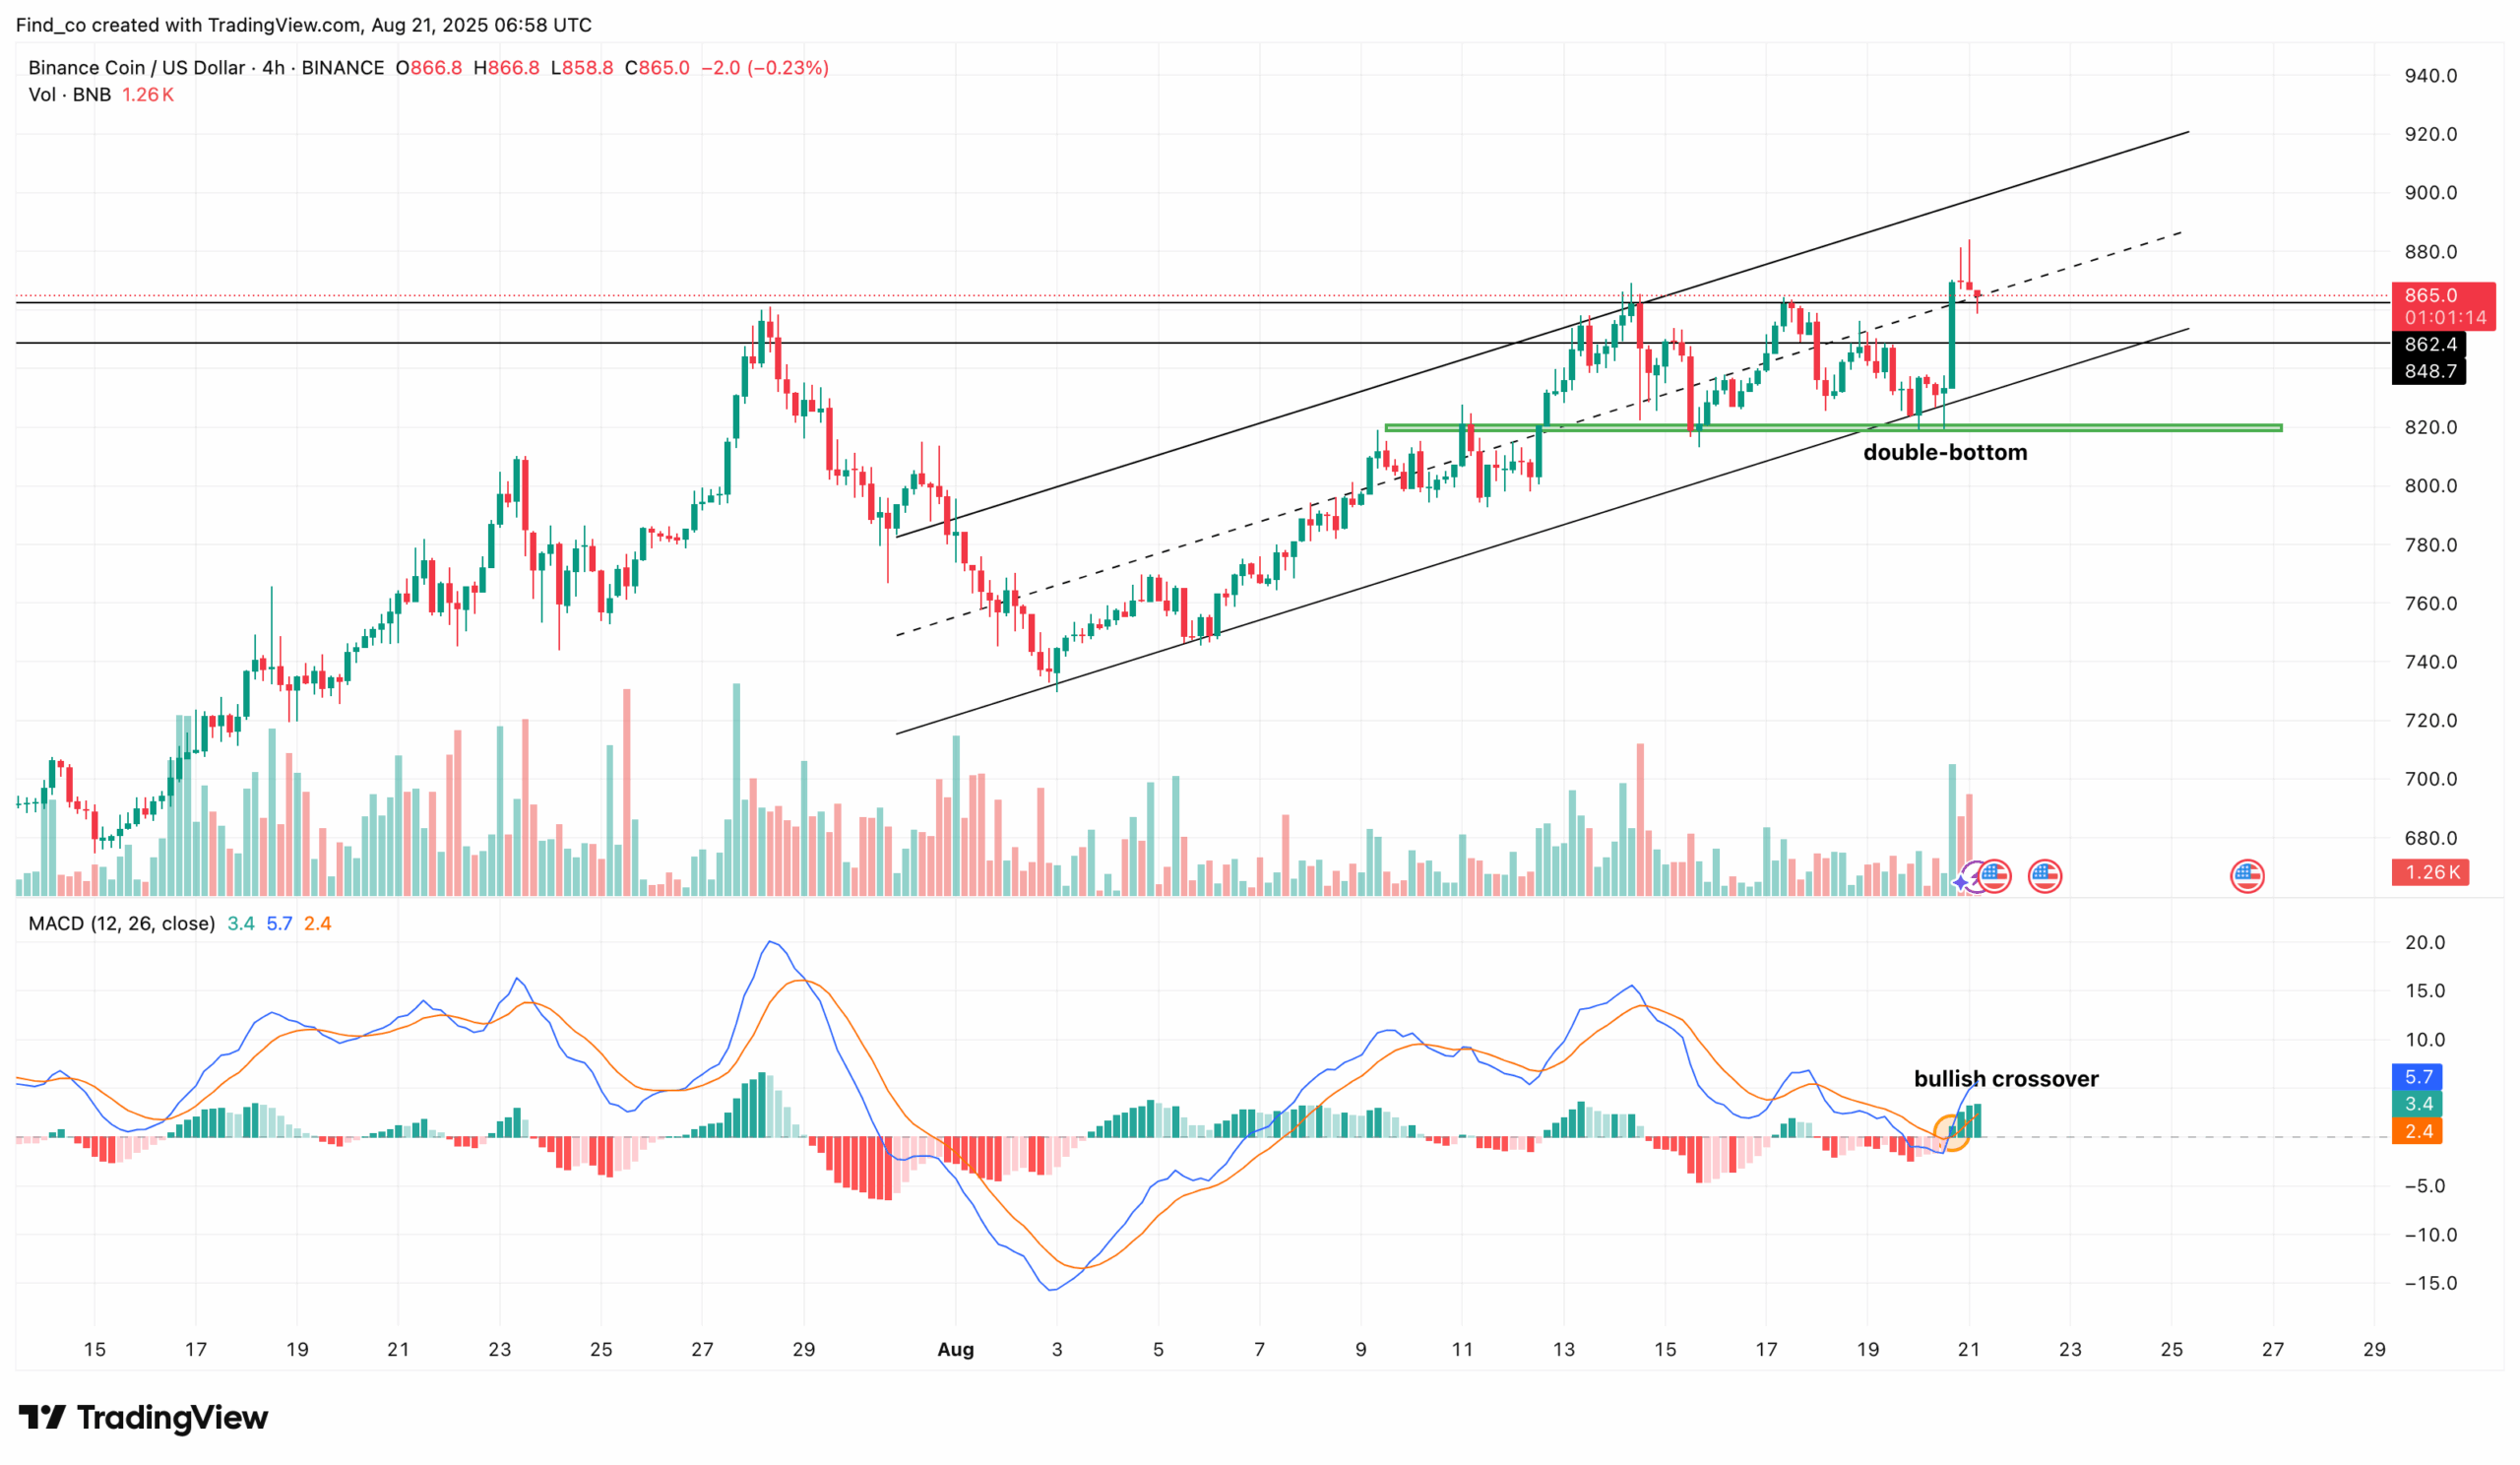
Since the beginning of August, the 4-hour chart shows BNB moving within an ascending parallel channel, steadily building bullish momentum.
The breakout’s real spark came from a double-bottom formation around $820 between Aug. 18 and 20.
This bullish reversal pattern gave buyers the confirmation they needed to push BNB past resistance at $848.72 and $862.49, and drive it to a fresh all-time high.
Get These Top Crypto Casino Offers Now!
Sponsored
Disclosure
We sometimes use affiliate links in our content, when clicking on those we might receive a commission at no extra cost to you. By using this website you agree to our terms and conditions and privacy policy.
Beyond the double-bottom setup, the Exponential Moving Averages (EMAs) flipped bullish again, fueling BNB’s breakout. On Aug.14, the 4-hour setup showed that BNB formed a death cross.
However, as of this writing, the 12 EMA (blue) has crossed above the 26 EMA (orange), creating a bullish crossover. Should this trend remain the same, BNB’s price will likely bounce from its slight dip.
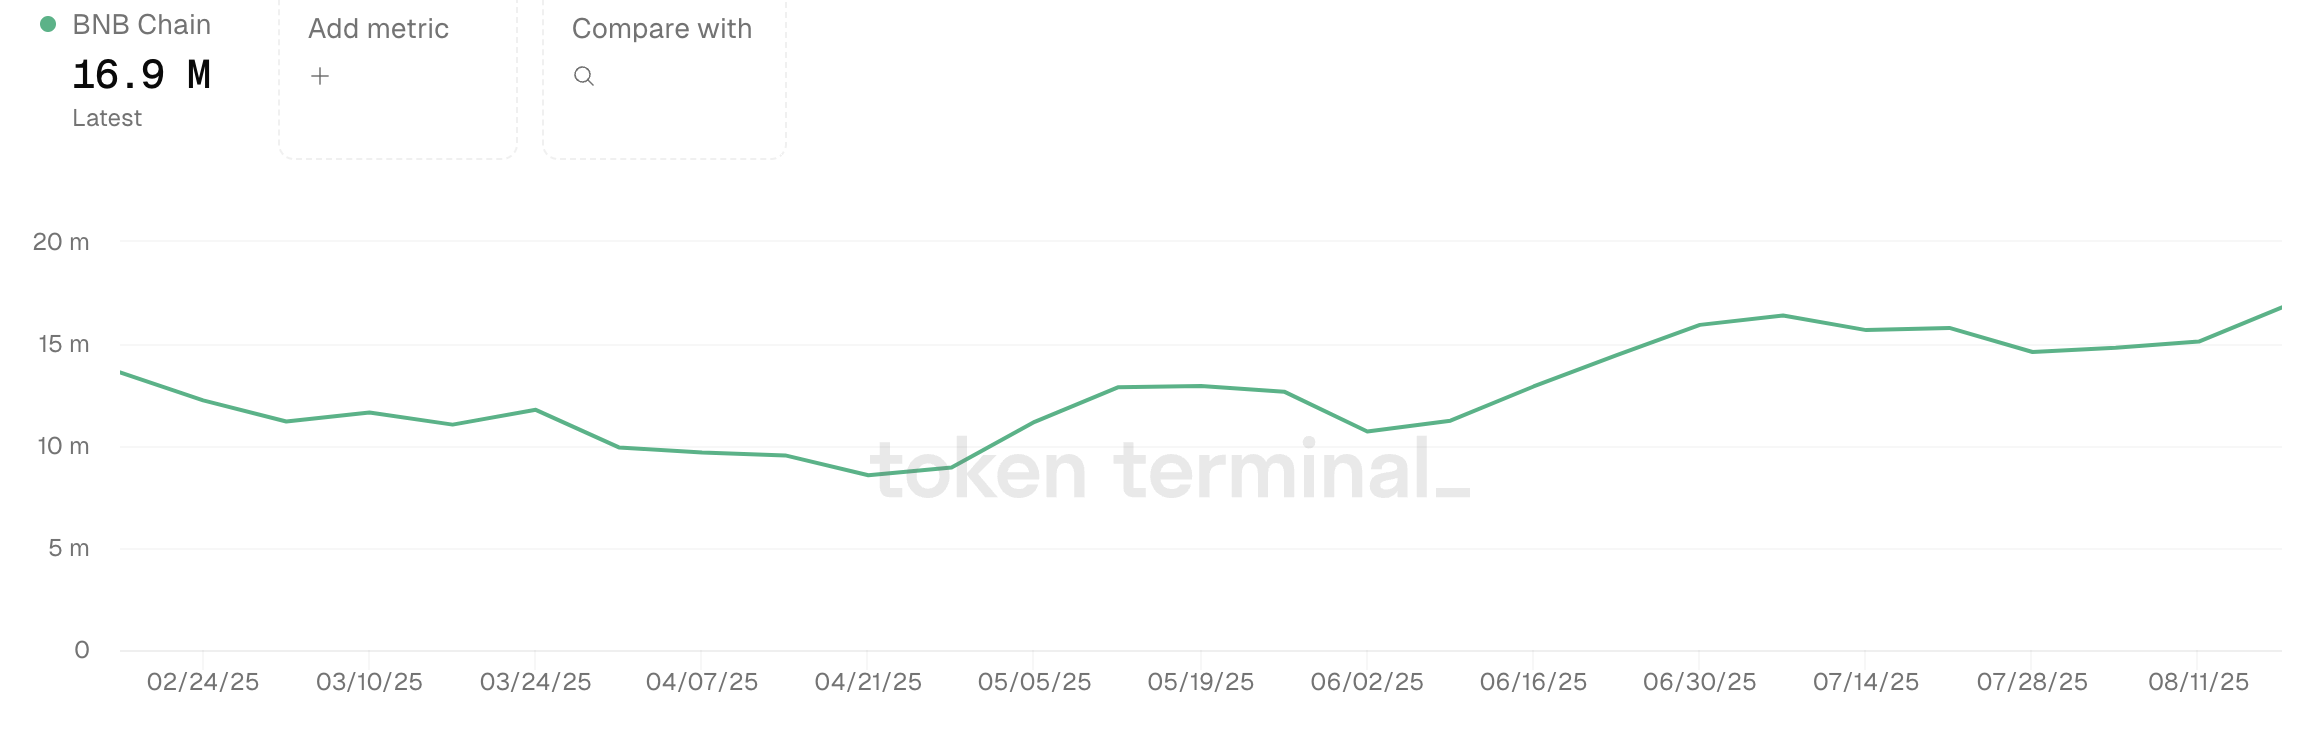
From an on-chain perspective, BNB Chain’s rising activity has been key in fueling the rally. Data from Token Terminal shows that weekly active users have surged to 16.8 million, the highest level recorded this year.
This engagement surge indicates growing adoption and places BNB Chain ahead of other leading layer-1 blockchains such as Solana, NEAR Protocol, and Tron. With user activity climbing to new heights, the network’s fundamentals align with the bullish BNB price action,
If network activity continues to explode, BNB’s price will likely surpass its new all-time high within a few weeks or months.
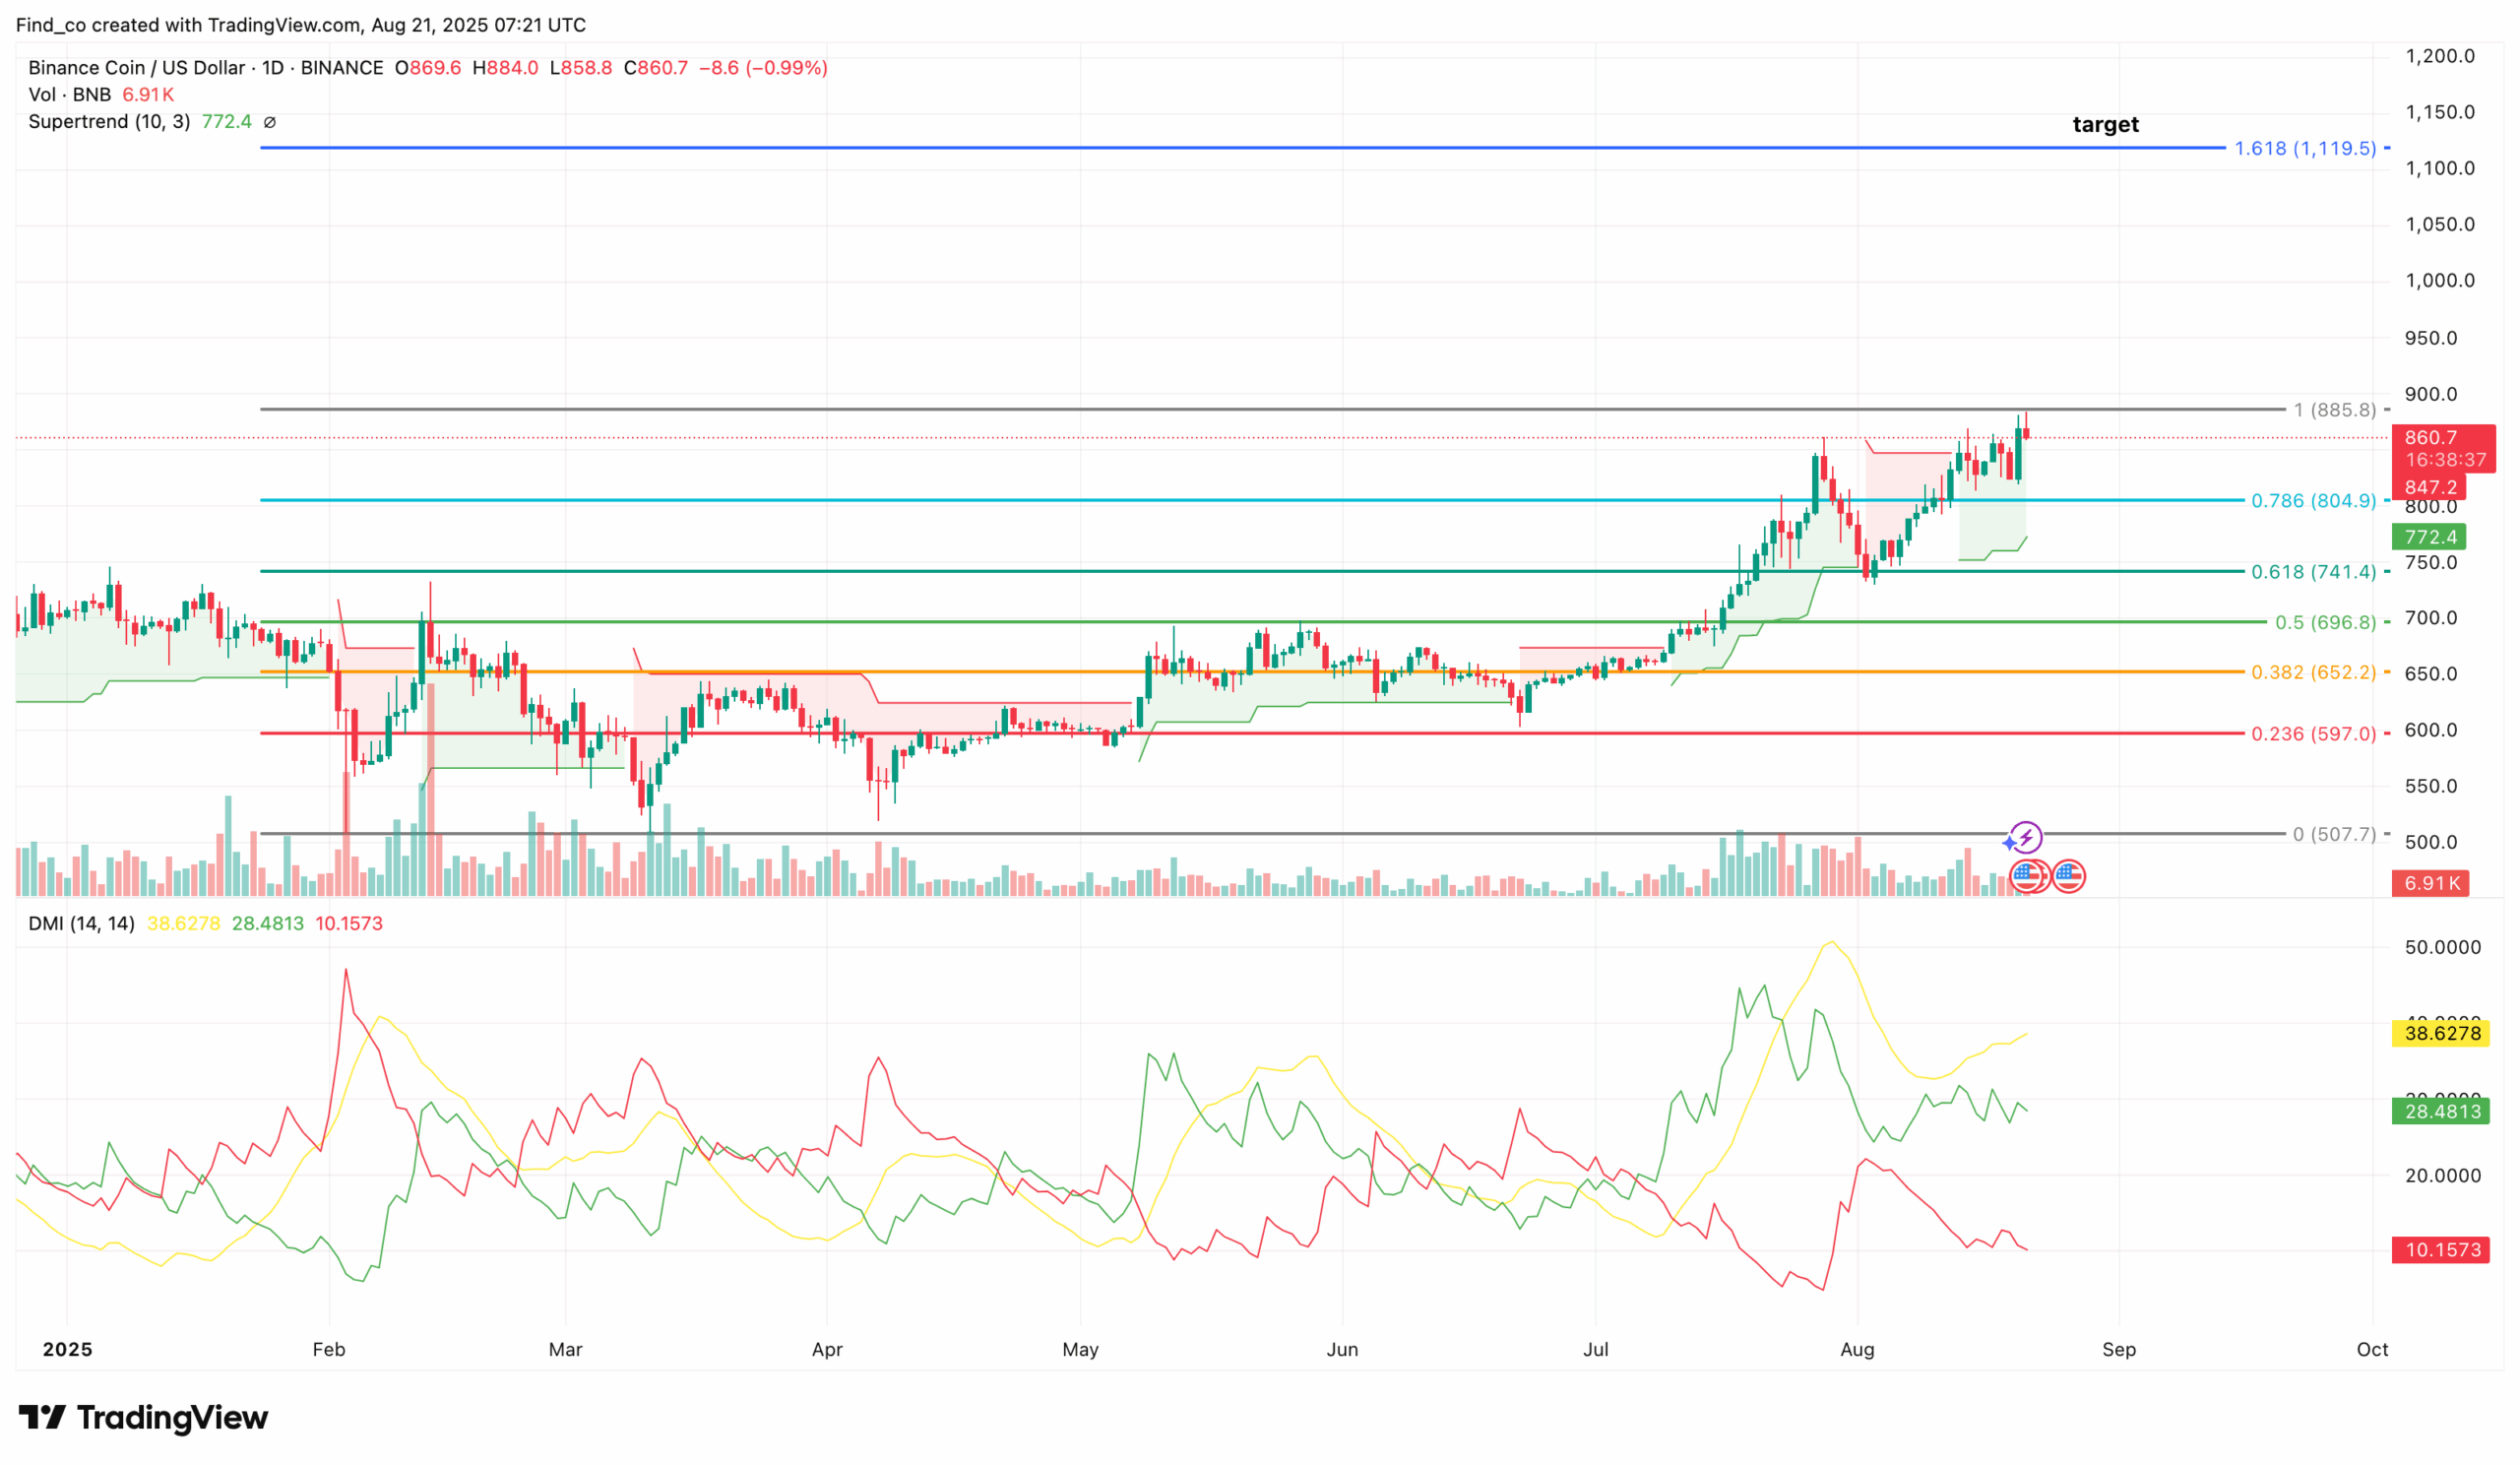
Looking ahead, BNB’s price remains bullish. On the daily chart, the Supertrend indicator’s green line has shifted below the price, confirming continued buy signals.
CCN’s analysis of the Directional Movement Index (DMI) further supports this view.
At press time, the +DMI (green) is 28.48, well above the -DMI (red) at 10.16, showing that bullish strength outweighs bearish pressure.
Meanwhile, the Average Directional Index (ADX) is 38.63, indicating that the uptrend is gaining momentum.
If this trend remains the same, BNB’s price might breach the overhead resistance at $885.80. Once this happens, the coin’s next target might be $1,120.
Disclaimer:
The information provided in this article is for informational purposes only. It is not intended to be, nor should it be construed as, financial advice. We do not make any warranties regarding the completeness, reliability, or accuracy of this information. All investments involve risk, and past performance does not guarantee future results. We recommend consulting a financial advisor before making any investment decisions.
Victor Olanrewaju is a crypto analyst and reporter at CCN with deep roots in on-chain research and technical analysis. His crypto journey began in 2017, but it was the 2020 Uniswap airdrop that sparked a full-time pivot into the space.
With a foundation in copywriting, Victor honed his craft creating high-converting content for leading crypto brokers — most notably an XRP price prediction that ranked #1 on Google during the 2021 bull run.
He later joined AMBCrypto in 2022, where he combined storytelling with technical and on-chain analysis to cover key market narratives.
In 2024, he expanded his expertise at BeInCrypto, collaborating with analysts and using tools like Glassnode, Santiment, and IntoTheBlock to break down Bitcoin and altcoin trends.
At CCN, Victor covers the top cryptocurrencies, memecoins, macro shifts, blending real-time insights with deep-dive metrics.
He holds a Bachelor’s degree in Physics from the University of Ibadan, equipping him to simplify complex data for a wide audience. Follow his work or connect on LinkedIn or X.