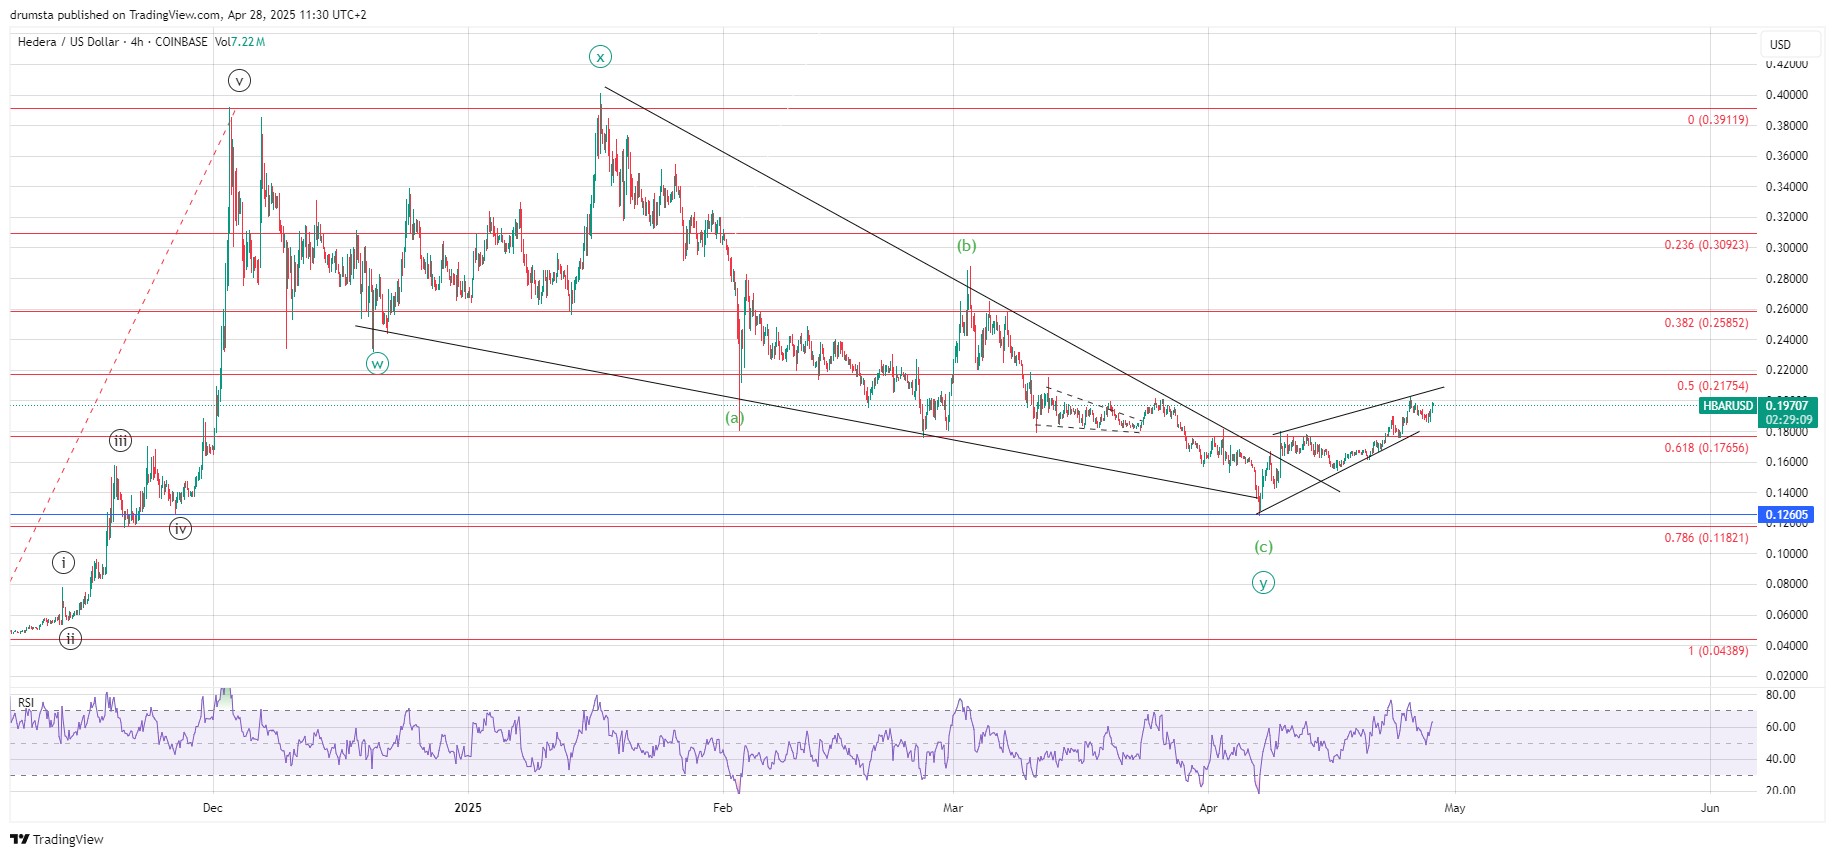
The final leg lower (wave (c) of Y) appears completed at $0.126 on April 7, slightly above the 0.786 Fibonacci retracement of the larger bullish wave.
HBARUSD descending wedge breakout | Credit: Nikola Lazic/TradingView
Since then, the price action has transitioned into a rising wedge, suggesting the current rally may be an early phase of a larger trend change, but is still vulnerable to short-term retracements.
Resistance around the 0.5 Fibonacci retracement ($0.217) remains crucial
The Relative Strength Index (RSI) on the 4-hour chart is approaching overbought territory, hinting at a potential pullback.
In addition, it shows a slightly bearish divergence, further strengthening the case for a bearish downturn.
Still, the breakout from the wedge adds bullish confidence, as wedges typically resolve upward.
If the price is sustained above $0.176 (0.618 Fib retracement), it will likely continue toward $0.217 (0.5 Fib retracement).
The structure favors an impulsive wave up beginning but requires confirmation through higher lows and a break above the $0.217 resistance.
A deep retracement below $0.176 would invalidate the immediate bullish case and suggest an extended correction.
HBAR Price Prediction
Zooming into the 1-hour chart, HBAR completed a five-wave impulse on April 25 at $0.20, followed by a sharp drop to $0.185, labeled as wave (a) of a corrective move.
The current rally appears to be wave (b), with the current price recovering to $0.197 after the wave (a) decline.
HBARUSD ABC correction developing | Credit: Nikola Lazic/TradingView
Wave (b) is likely nearing completion, signaling that wave (c) to the downside could soon follow.
Expect a pullback targeting the $0.176–$0.165 zone (close to the 0.618 Fib retracement).
This aligns with typical corrections in early bullish wave developments.
Upon completing the (a)-(b)-(c) correction, a strong rally could emerge, aiming for the $0.217 resistance and potentially higher.
Short-term RSI is nearing overbought levels, confirming that caution is warranted before aggressive bullish entries.
Once wave (c) completes, ideally above $0.17, an impulsive move toward $0.22–$0.26 could be triggered.
However, failure to hold $0.176 could open room for retesting deeper levels around $0.15.
Alternatively, the current price rise is still within the five-wave structure, meaning that it currently develops its wave (v). This will be validated if HBAR surpasses its prior high.
Disclaimer:
The information provided in this article is for informational purposes only. It is not intended to be, nor should it be construed as, financial advice. We do not make any warranties regarding the completeness, reliability, or accuracy of this information. All investments involve risk, and past performance does not guarantee future results. We recommend consulting a financial advisor before making any investment decisions.
Nikola Lazic is a cryptocurrency analyst and investor working in the industry since 2017. He holds a bachelor's degree in Sociology, which enables him to better understand the psychology behind the crowd´s positioning. Consequently his preferred analytical tool is Elliott Wave Theory in combination with price action analysis.
Combining his experience in trading and investing with knowledge in content writing he strives to bring the most accurate and actionable information.