Analyzing HBAR's Movement in 2025 | Credit: Hameem Sarwar
Share
Key Takeaways
Hedera’s (HBAR) price has fallen by 55% since its cycle high.
The Hedera price reached a new yearly low on Feb. 25.
Can the HBAR price bounce, or does more downside await?
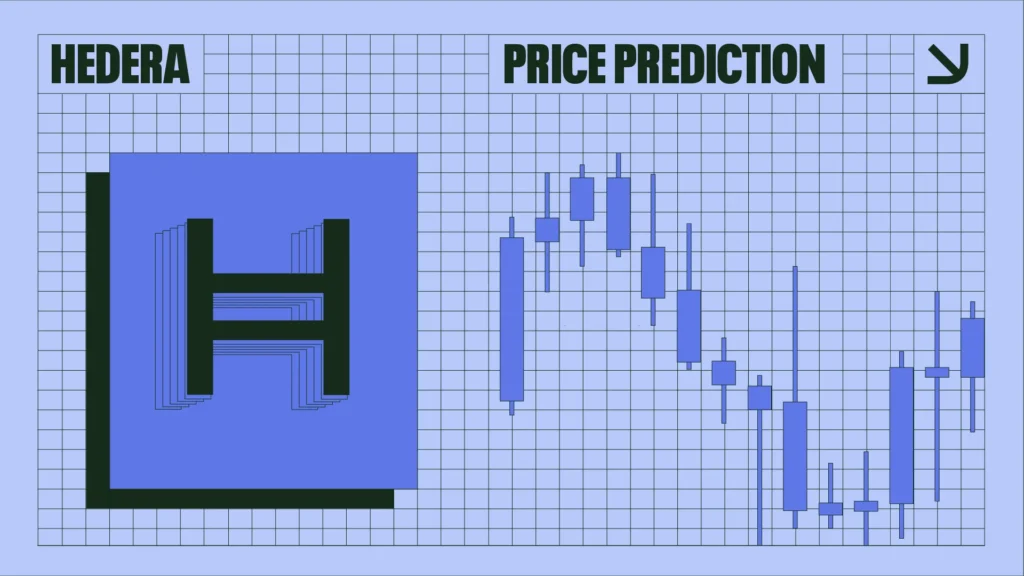
The Hedera (HBAR) price mounted an impressive rally in December 2024, which led to the cycle high of $0.401 in January 2025.
However, February has not been kind to Hedera, which has fallen 55% since the high.
Despite the decline, there was positive HBAR news. Canary Capital has filed an amended S-1 form for its HBAR Exchange-Traded Fund (ETF).
According to ETF Analyst Erich Balchunas, this often happens after the Securities and Exchange Commission (SEC) comments on the previous filing, echoing Litecoin’s (LTC) filing.
Shortly afterward, they filed the 19b-4 form, which is the final step toward the ETF approval.
With HBAR teetering on the edge of a breakdown, the question remains: Can the HBAR ETF provide a much-needed boost for the price, or is Hedera doomed to fall to new lows?
The weekly HBAR chart shows that the price twice failed to break out from the $0.340 horizontal resistance area. It created three long upper wicks (red icons) before accelerating its bearish trend.
If the Hedera decrease continues, the closest horizontal support is at $0.120, created by the previous resistance level, which will likely act as support if HBAR returns to it.
Technical indicators are decisively bearish. The Relative Strength Index (RSI) has decreased below 50 while the Moving Average Convergence/Divergence (MACD) has made a bearish cross (black circles).
The daily chart aligns with this possibility. It shows HBAR decreased under a descending resistance trend line since the Jan.17 high.
While the price showed some bullish signs with a bullish hammer candlestick (green icon) on Feb. 3, it has already retraced all of its gains and now risks creating a new low.
The long-term wave count shows that HBAR has completed an upward A-B-C correction (green) since the upward movement started.
The sub-wave count (black) suggests wave C is over since a five-wave upward movement has finished.
If this is the case, it would suggest that the entire increase in this cycle is just a corrective rally in response to the five-wave decline (red) that started after the 2021 all-time high.
As a result, the HBAR price has started another five-wave decline that will eventually take it below its 2023 lows of $0.040.
Alternatively, closing above the $0.30 horizontal resistance area will mean the HBAR trend is bullish, and the upward movement is impulsive.
This seems unlikely because of the bearish price action, wave count, and indicator readings.
New Lows in 2025
All signs suggest the HBAR price has completed its market cycle.
The HBAR ETF news did not provide any relief, and a breakdown below $0.184 can accelerate the downward movement toward new lows.
Disclaimer:
The information provided in this article is for informational purposes only. It is not intended to be, nor should it be construed as, financial advice. We do not make any warranties regarding the completeness, reliability, or accuracy of this information. All investments involve risk, and past performance does not guarantee future results. We recommend consulting a financial advisor before making any investment decisions.
Valdrin Tahiri is a cryptocurrency analyst and reporter at CCN, specializing in technical analysis with a focus on Elliott Wave theory, on-chain metrics, and fundamental research. He brings over seven years of experience in the crypto space as both a trader and writer.
He discovered cryptocurrencies in 2017 while earning his MSc in Financial Markets at the Barcelona School of Economics, which sparked a deep interest in blockchain and market dynamics. Since then, he’s contributed to top crypto outlets like BeInCrypto and CoinGape.
Valdrin also served as Community Manager of BeInCrypto’s Telegram group for three years, helping grow it into one of the largest crypto communities worldwide. His expertise in market structure and price patterns allows him to break down complex trends into clear, actionable insights.
He’s published thousands of articles covering altcoins, Bitcoin cycles, and macro trends.