Can Bitcoin truly stand alongside gold in times of crisis? | Credit: Kayla Bartkowski/Getty Images
Share
Key Takeaways
Bitcoin and gold exhibit similar short-term behavior, responding in nearly the same way to geopolitical events.
Gold outperforms Bitcoin in the medium term, with stronger performance in 61.8% of events over a 90-day period.
Bitcoin offers higher average returns, particularly over the long term (180 days).
The invasion of Israel into Lebanon on Oct. 1, 2024, reignites the pressing question: How do key assets like Bitcoin (BTC) and gold react in the aftermath of major geopolitical events?
Gold has always been the go-to asset for investors during times of global uncertainty. It has instinctively served as a trusted store of value.
As Bitcoin—often referred to as “digital gold”—becomes more integrated into mainstream finance, it prompts questions about its ability to stand alongside gold in crises.
The analysis will trace Bitcoin’s and gold’s performance from 2016 to January 2025, evaluating whether Bitcoin can match gold’s long-standing resilience.
A review of historical events from 2016 to January 2025 has identified 38 significant geopolitical events that appear to warrant detailed analysis. The price performance of Bitcoin and gold was examined at intervals of 7, 30, 90, and 180 days following each event, based on the event dates.
It’s important to note that Bitcoin trades 24/7, whereas gold does not. Gold markets typically follow set trading hours across different regions, meaning they do not operate continuously over the weekend. As a result, in 52 instances, we had to use the next available trading day for gold prices.
If an event occurred on a Saturday or Sunday, the gold price from the following Monday and Bitcoin’s price from the same date were used to ensure a fair comparison.
The price data for Bitcoin was sourced from Google Finance, while the gold data was obtained from the World Gold Council. The detailed price performance of both assets, along with the corresponding geopolitical events, can be found in the table below.
Date
Event
BTC 7D
Gold 7D
BTC 30D
Gold 30D
BTC 90D
Gold 90D
BTC 180D
Gold 180d
June 23, 2016
Brexit Referendum
11.42%
4.64%
10.71%
4.04%
0.79%
5.07%
33.29%
-10.81%
June 5, 2017
Qatar Diplomatic Crisis
7.96%
-1.06%
-0.92%
-4.66%
69.03%
4.15%
342.31%
-0.51%
Jan. 22, 2018
First Trump Tariffs
8.94%
0.84%
-0.54%
-0.16%
-13.49%
-0.62%
-25.34%
-8.08%
March 1, 2018
Second Trump Tariffs
-14.69%
1.01%
-36.63%
1.23%
-32.60%
-0.54%
-35.33%
-7.30%
March 4, 2018
Sergei and Yulia Skripal Poisoning
-22.13%
-0.09%
-35.96%
0.99%
-35.25%
-1.89%
-39.39%
-8.93%
May 8, 2018
U.S. Withdrawal from Iran Nuclear Deal
-7.74%
-0.89%
-16.30%
-0.72%
-24.52%
-7.42%
-30.02%
-5.69%
May 31, 2018
Third Trump Tariffs
5.05%
-0.62%
-9.53%
-4.41%
-3.86%
-7.75%
-47.49%
-6.45%
Oct. 2, 2018
Jamal Khashoggi Murder
1.74%
-1.59%
-2.05%
2.20%
-43.06%
6.17%
-36.29%
7.37%
Feb. 26, 2019
India-Pakistan Air Strikes
1.37%
-3.11%
5.88%
-2.26%
130.63%
-3.21%
171.96%
13.49%
Aug. 2, 2019
U.S. Withdrawal from the INF Treaty
12.68%
3.88%
-1.54%
5.84%
-12.94%
4.80%
-11.72%
9.13%
Sept. 14, 2019
Saudi Oil Field Assault
-5.59%
1.66%
-18.43%
-0.44%
-29.25%
-2.04%
-52.69%
4.91%
Oct. 9, 2019
Turkey Advances into Northern Syria
-6.88%
-1.47%
2.01%
-2.86%
-5.09%
4.02%
-14.59%
9.36%
Dec. 27, 2019
COVID-19 First Outbreak
1.10%
2.46%
22.63%
4.54%
-6.87%
8.16%
28.11%
16.84%
Jan. 3, 2020
Assassination of Qasem Soleimani
11.65%
0.31%
26.64%
1.68%
-7.21%
4.39%
25.92%
14.35%
Jan. 30, 2020
WHO Declares Public Health Emergency of International Concern
2.67%
-0.95%
-6.12%
1.36%
-7.61%
7.93%
15.06%
22.98%
Feb. 20, 2020
Pre-COVID-19 Pandemic Market Selloff
-8.38%
2.04%
-32.39%
-5.78%
-1.06%
7.99%
24.41%
24.07%
March 8, 2020
Russia–Saudi Arabia Oil Price War
-36.59%
-11.05%
-9.28%
-1.39%
23.24%
1.07%
31.91%
15.17%
March 11, 2020
WHO Declares COVID-19 Pandemic
-31.95%
-9.41%
-13.48%
1.63%
23.08%
3.61%
30.62%
16.61%
Aug. 20, 2020
Poisoning of Alexei Navalny
-4.54%
-0.17%
-12.19%
-0.92%
49.91%
-2.65%
314.29%
-6.90%
Sept. 27, 2020
Second Nagorno-Karabakh War
0.91%
2.43%
27.58%
2.22%
152.77%
0.57%
414.61%
-7.11%
Feb. 1, 2021
Brexit
38.44%
-1.49%
50.36%
-8.13%
70.45%
-5.12%
16.82%
-2.76%
March 23, 2021
Suez Canal Obstruction
8.05%
-2.45%
-4.84%
3.57%
-41.76%
2.83%
-21.07%
1.83%
Aug. 15, 2021
Taliban Takeover of Afghanistan
7.78%
0.88%
2.41%
0.36%
38.32%
4.12%
-7.77%
2.51%
Aug. 30, 2021
USA Afghanistan Withdrawal
12.11%
1.28%
-11.61%
-3.41%
23.07%
-0.70%
-8.09%
6.19%
Feb. 24, 2022
Russia-Ukraine Armed Conflict
10.75%
-0.35%
22.84%
0.04%
-23.05%
-4.60%
-43.87%
-9.80%
July 8, 2022
Shinzo Abe Assassination
-3.62%
-1.84%
10.22%
2.64%
-7.62%
-1.38%
-22.03%
6.85%
Aug. 2, 2022
Pelosi’s Visit to Taiwan
0.70%
0.87%
-12.46%
-4.80%
-10.87%
-7.91%
-0.69%
8.11%
Aug. 4, 2022
Chinese military exercises around Taiwan
5.88%
0.76%
-12.47%
-4.05%
-10.88%
-7.49%
2.29%
7.89%
Sept. 26, 2022
Nord Stream pipelines sabotage
2.10%
1.52%
8.06%
1.42%
-12.02%
9.57%
41.14%
18.43%
Oct. 4, 2022
NK’s ICBM Triggers Shelter Warnings in Japan
-6.30%
-2.92%
-0.65%
-5.02%
-18.04%
5.77%
36.71%
15.65%
March 8, 2023
U.S. Regional Banking Crisis
12.21%
5.90%
28.65%
10.22%
25.48%
7.76%
18.98%
6.66%
March 19, 2023
Credit Suisse Collapse
-2.35%
-1.17%
9.36%
1.53%
-3.42%
-0.92%
-4.25%
-2.11%
April 8, 2023
Chinese military exercises around Taiwan
-0.70%
-0.32%
-6.63%
-0.05%
2.39%
-3.98%
-7.55%
-9.11%
Oct. 7, 2023
Hamas attack on Israel
3.35%
3.93%
27.05%
7.54%
60.15%
11.43%
148.34%
24.28%
April 14, 2024
Iran-Israel Armed Conflict
5.37%
-0.39%
-1.59%
0.45%
-1.29%
3.29%
-4.45%
12.33%
July 31, 2024
Yen Carry Trade Unwinding
-13.95%
-1.07%
-10.66%
3.59%
7.23%
13.14%
—
—
Sept. 17, 2024
Lebanon Pager Explosions
6.62%
2.38%
16.41%
3.57%
80.07%
2.99%
—
—
Dec. 8, 2024
The End of Assad’s Era
2.45%
0.55%
-2.86%
-0.34%
—
—
—
—
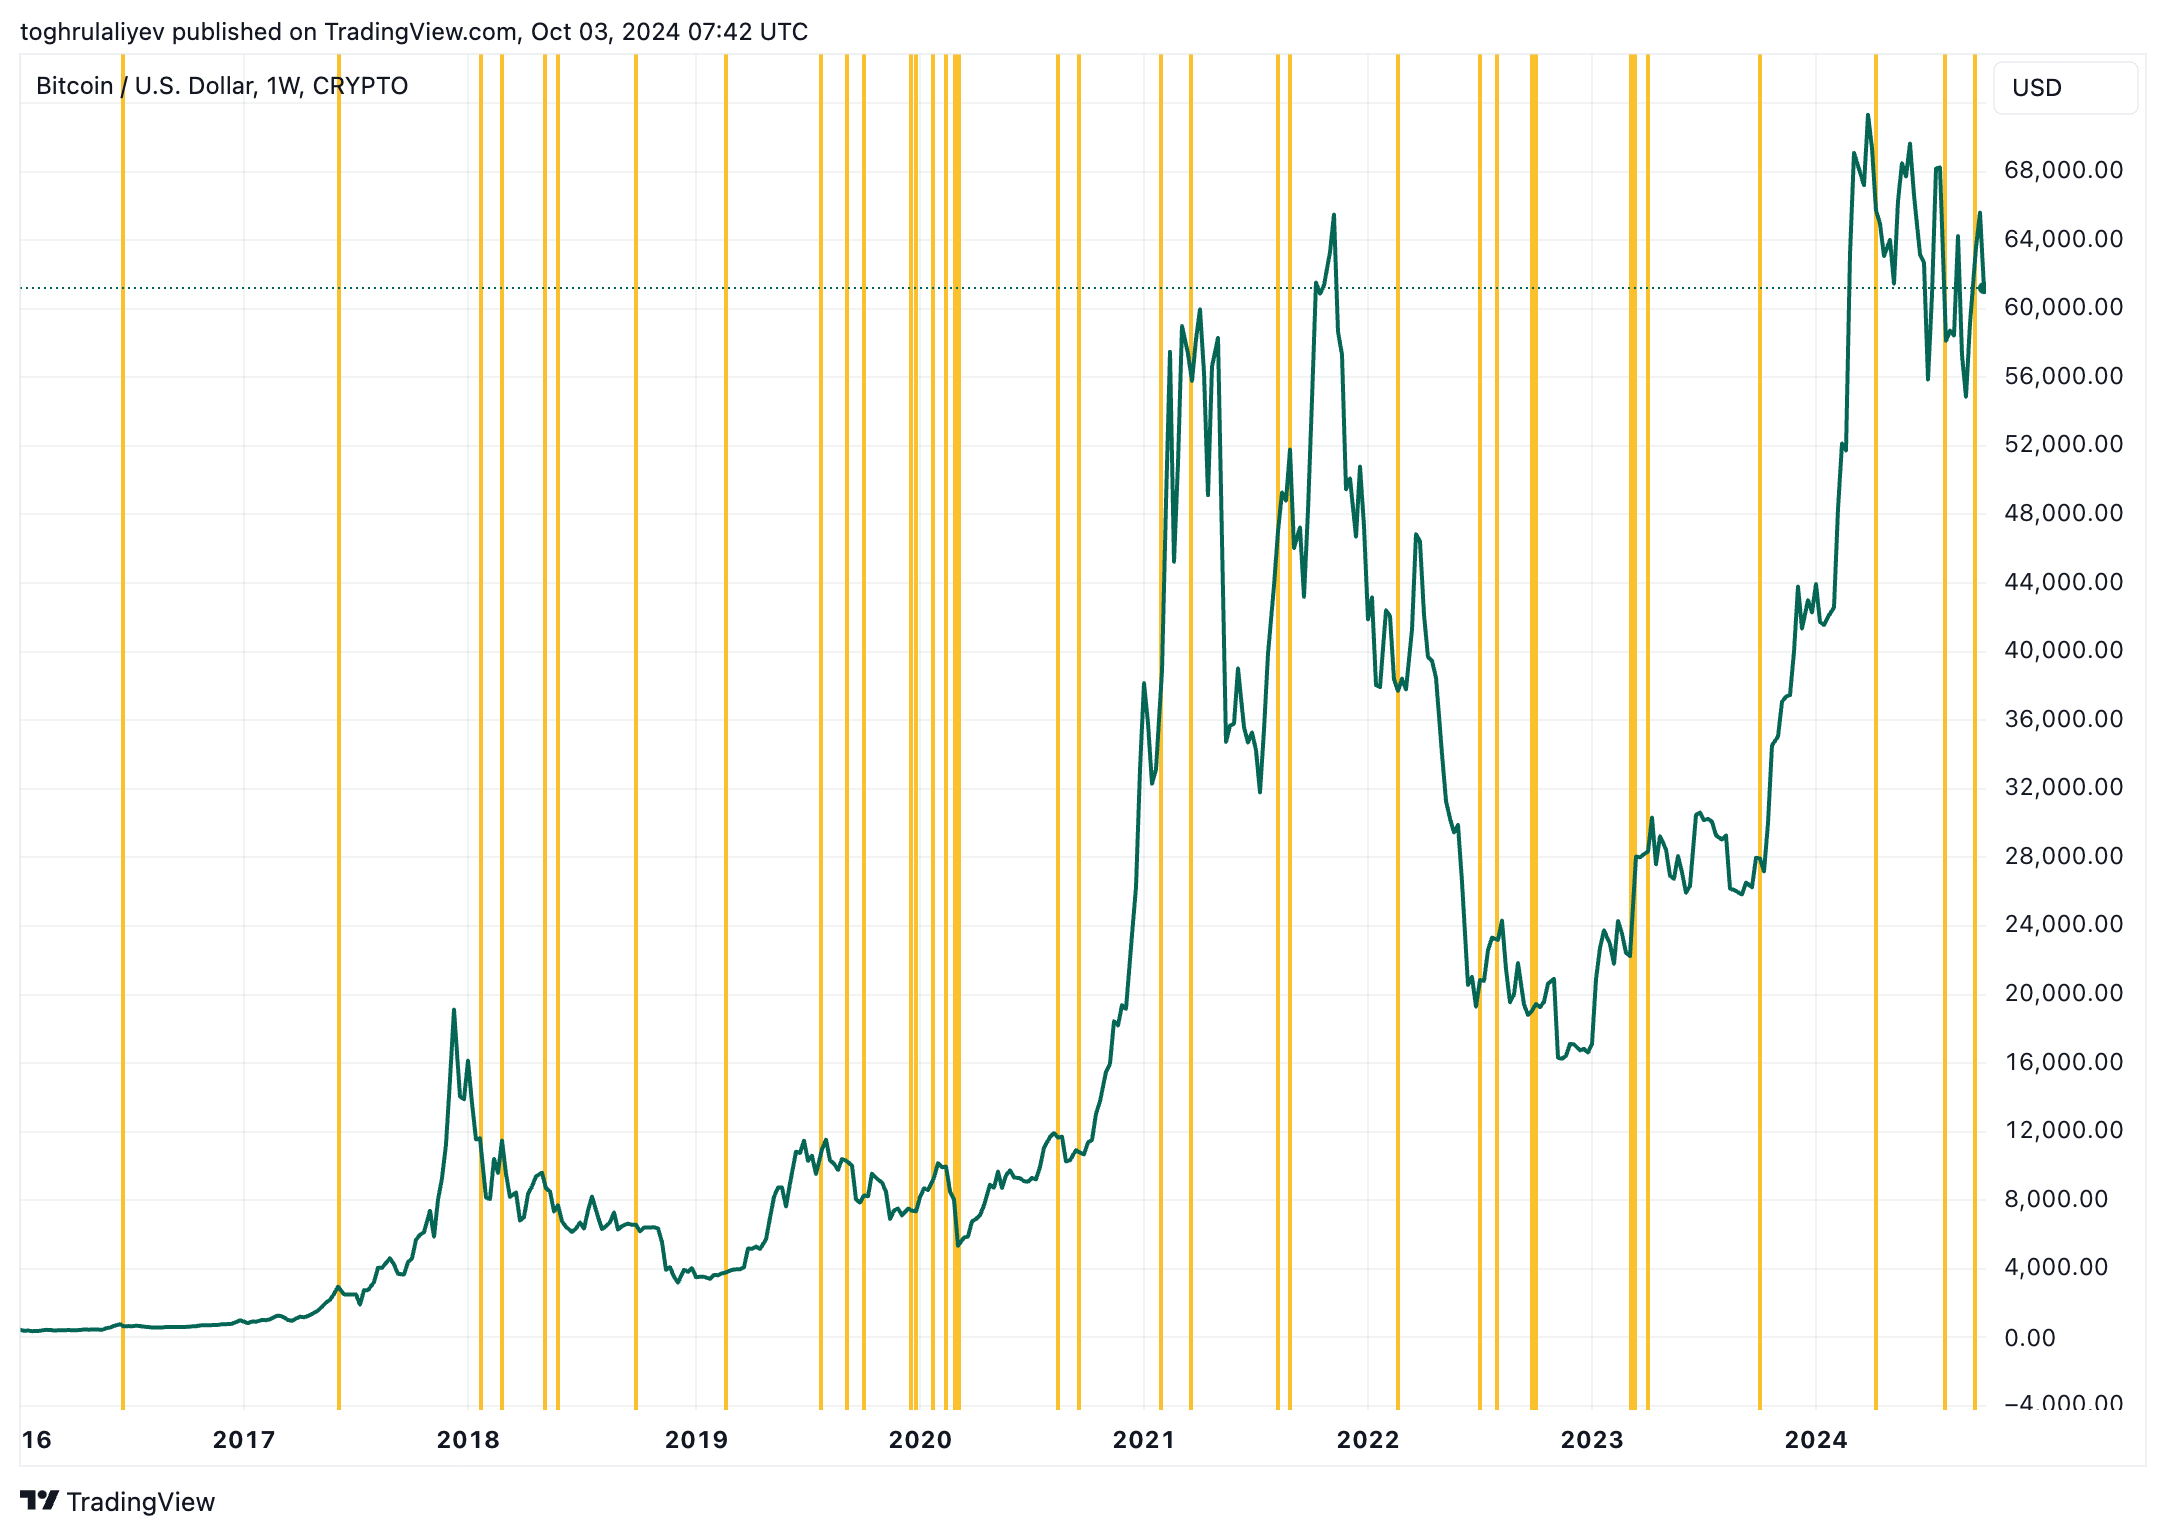
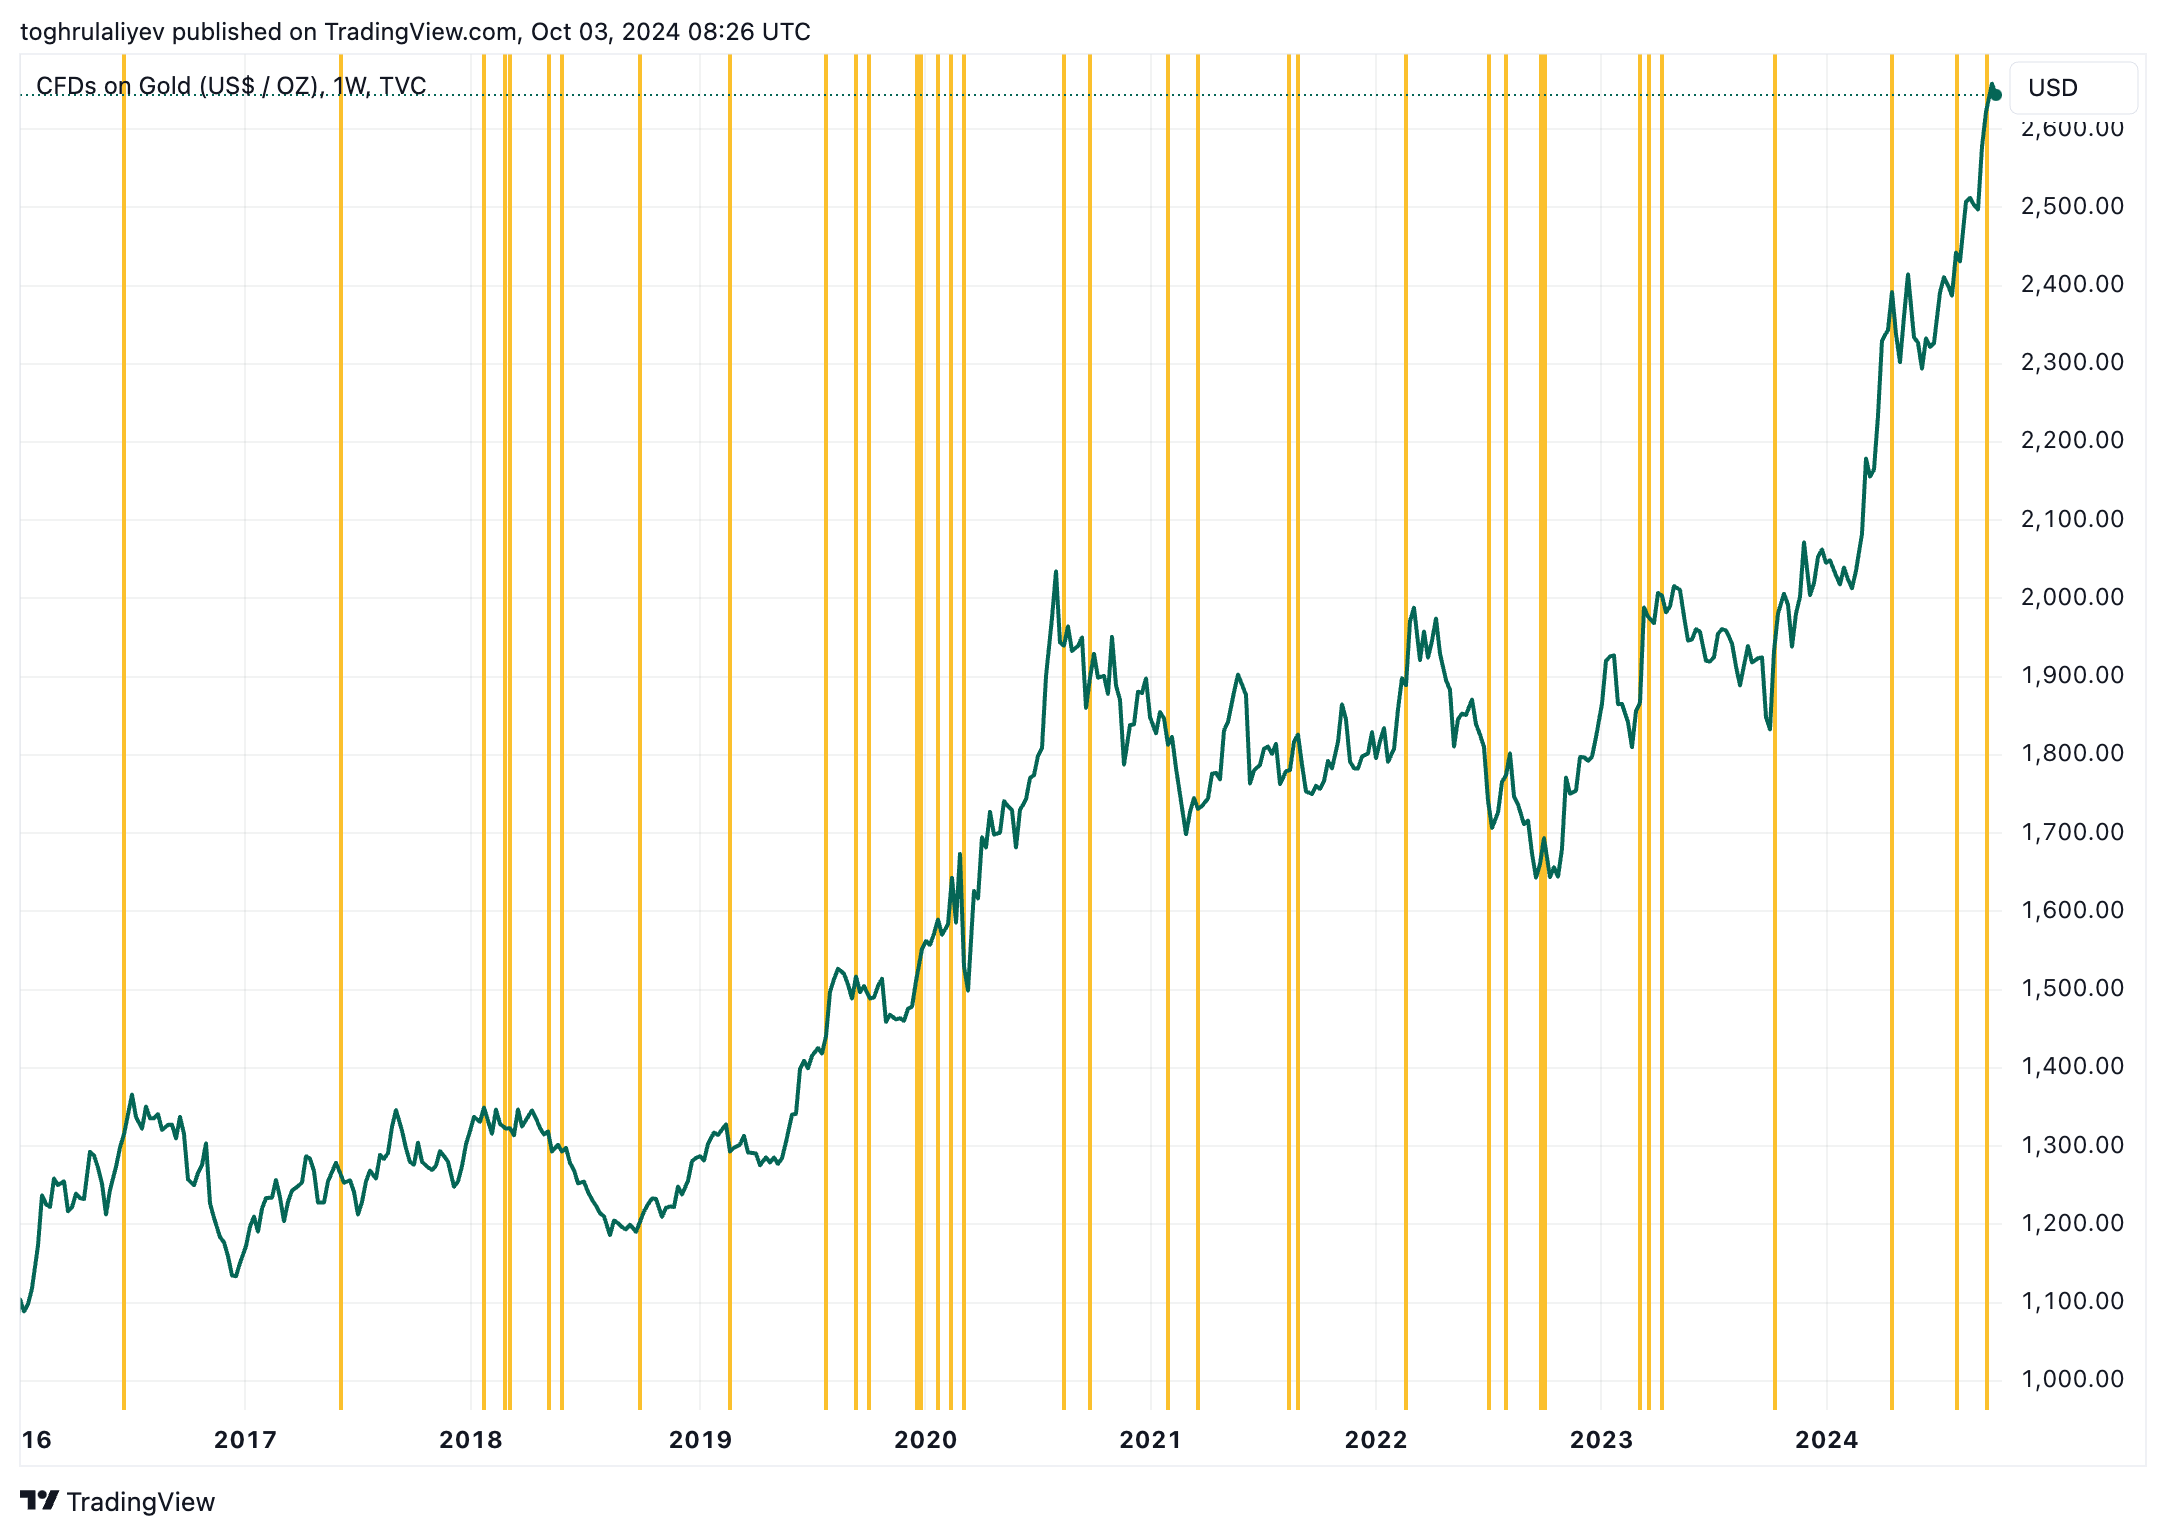
Figures 1 and 2 depict the key events on their respective price charts for easier reference.
Figure 1: Bitcoin’s Weekly Price Chart with Major Geopolitical Events. Credit: TradingView, CCNFigure 2: Gold’s Weekly Price Chart with Major Geopolitical Events. Credit: TradingView, CCN
Near-Even Split?
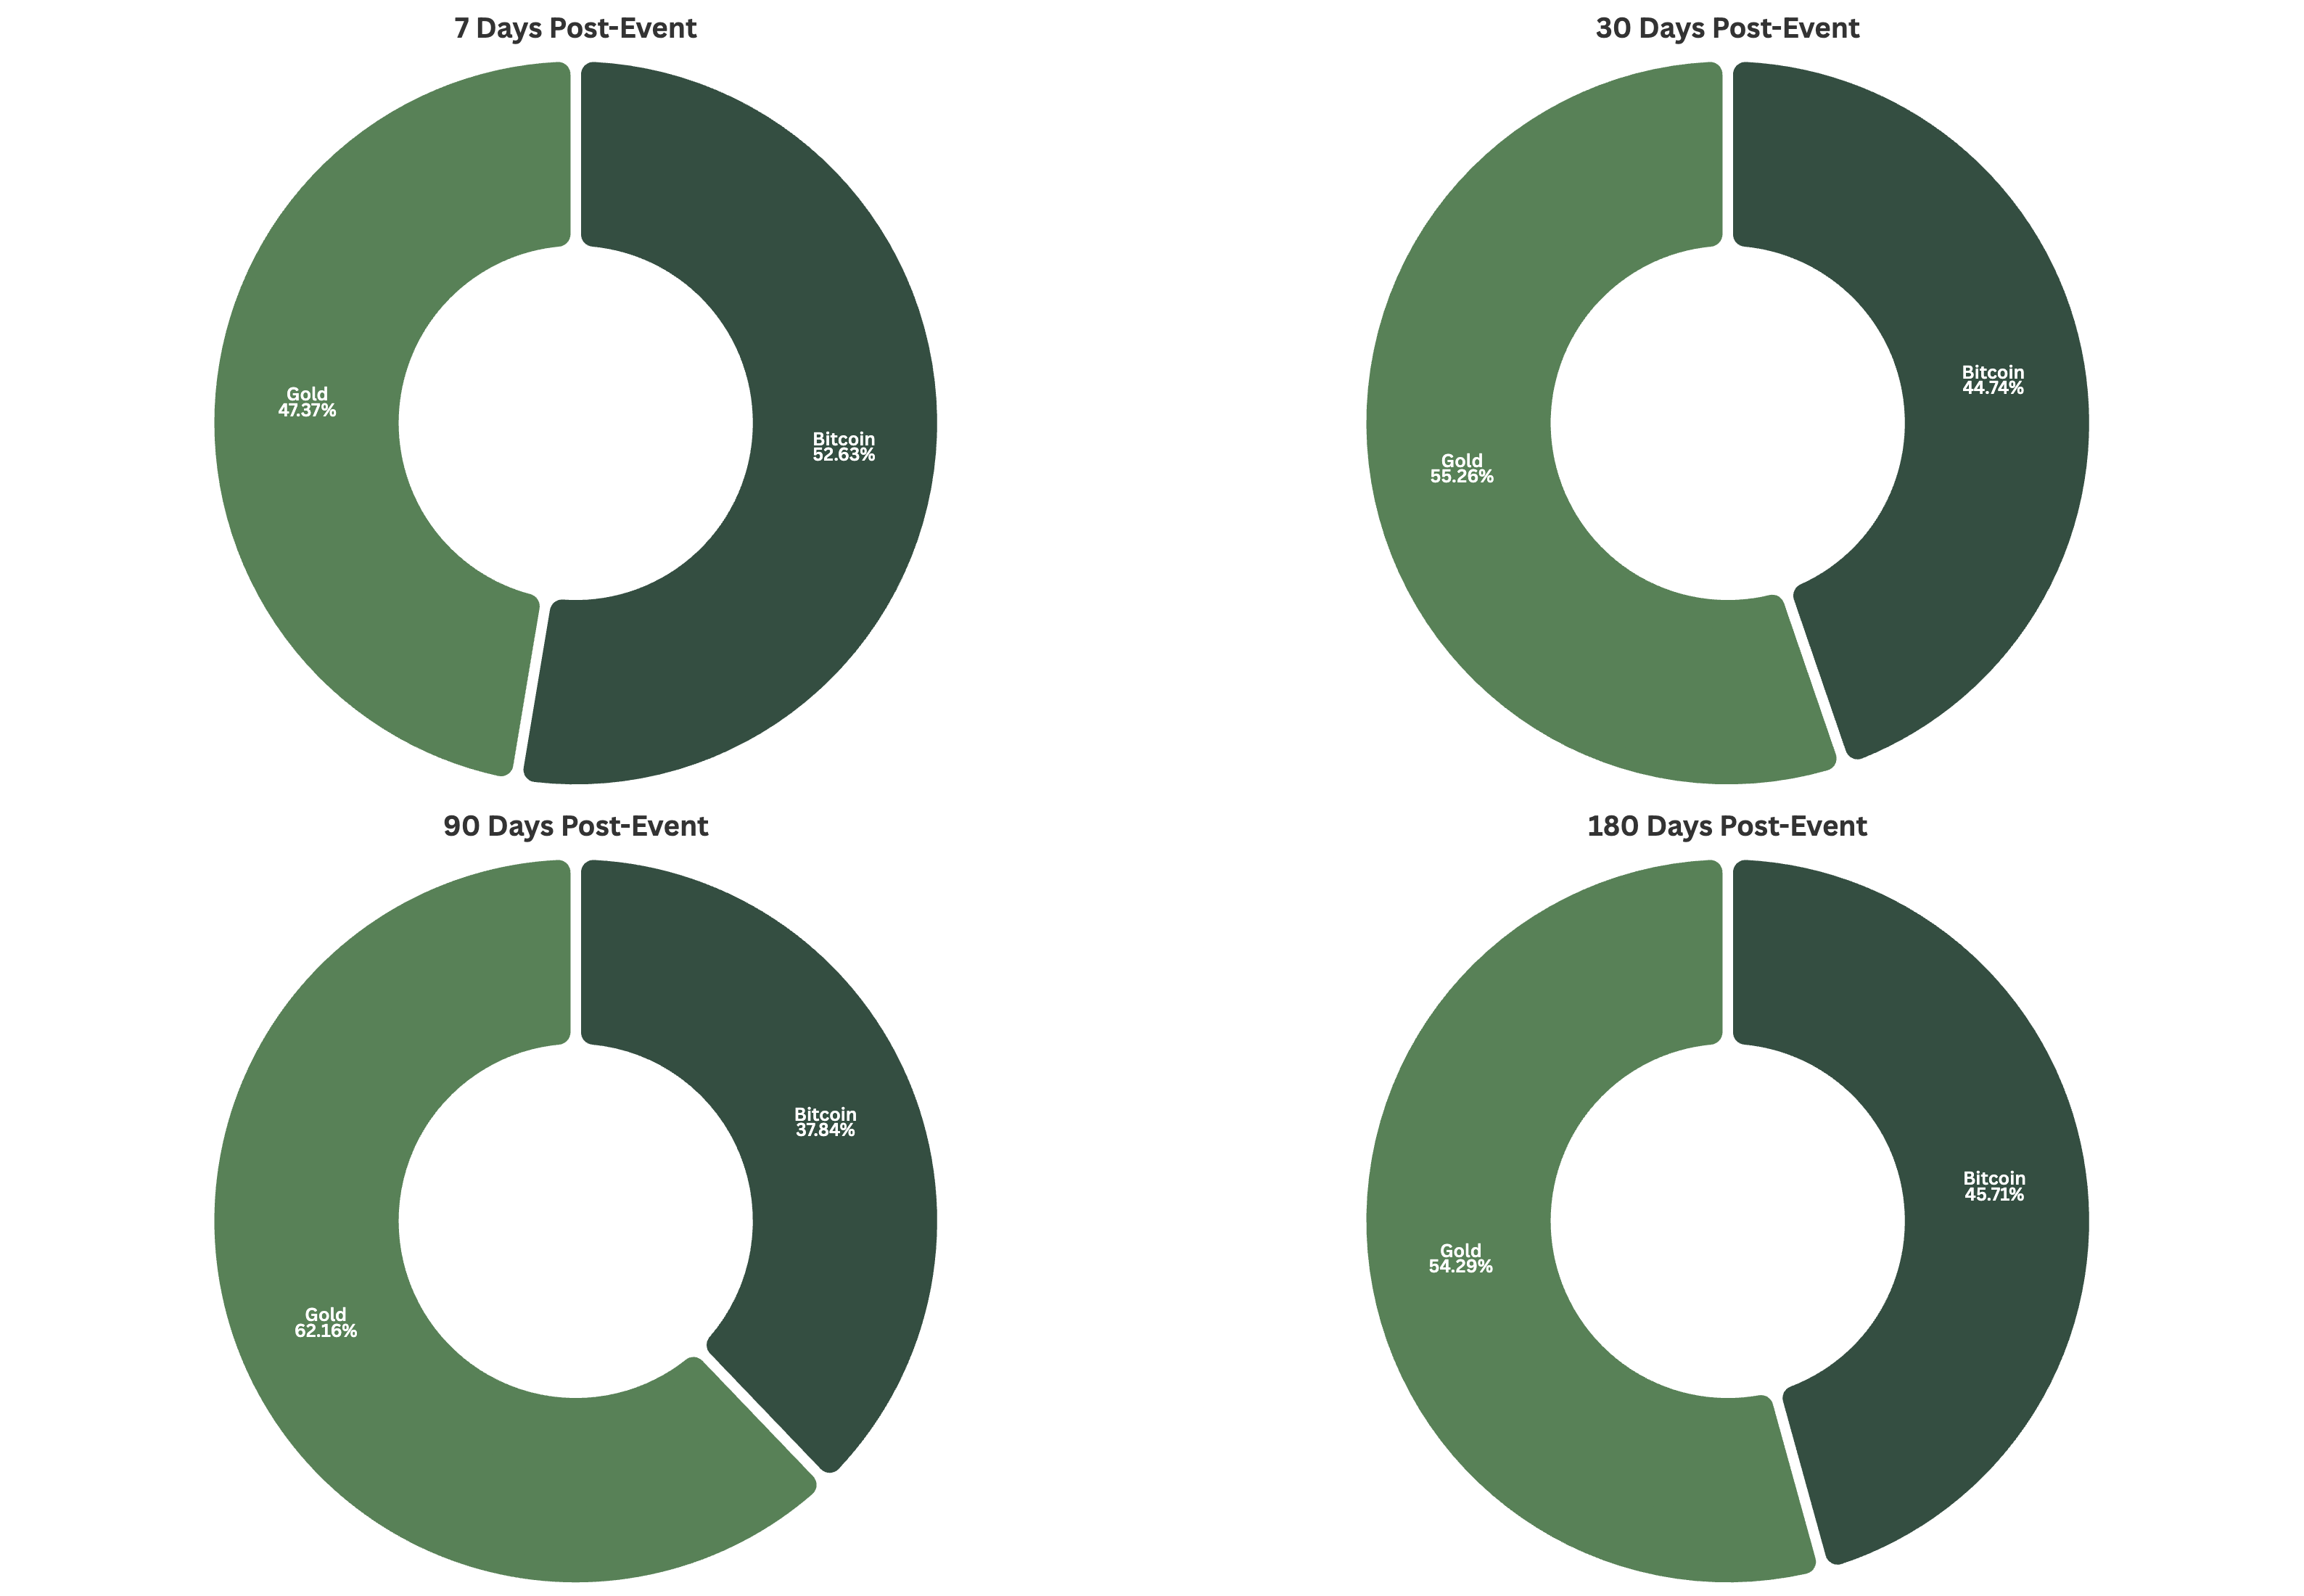
As seen in Figure 3 below, Bitcoin had a slight edge over gold in 52.63% of the geopolitical events we analyzed over a 7-day period. But gold outperformed Bitcoin in 47.37% of the cases. This minimal difference suggests that both assets had nearly identical performance.
When the analysis was extended to 30 days, gold outperformed 55.26% of the instances. Therefore, it slightly outpaces Bitcoin in four more events. Though the results are close to even, this shows a slight shift towards gold.
Figure 3: Comparative Performance of Bitcoin and Gold Post-Geopolitical Events. Credit: CCN
The disparity becomes more evident over a 90-day span. Generally, gold outperforms Bitcoin in 62.16% of the events, marking the widest gap in the analysis.
What Insights Can We Draw From the Data
Following major geopolitical events, gold and Bitcoin tend to behave largely similarly over short and long periods. However, over the medium term, gold tends to have more consistent outperformance than Bitcoin.
This suggests that gold provides greater stability after the initial market turbulence caused by geopolitical events.
Still, outperforming more often doesn’t automatically result in higher returns. What ultimately matters is the size of the gains.
The table below details the average performance of Bitcoin and gold.
BTC 7D
Gold 7D
BTC 30D
Gold 30D
BTC 90D
Gold 90D
BTC 180D
Gold 180D
0.47%
-0.13%
0.31%
0.30%
10.94%
1.64%
36.69%
5.13%
Their performance is very similar for the 7-day and 30-day periods. But at 90 days, Bitcoin’s average return jumps to 10.94%, and over 180 days, it reaches 36.69%.
Gold, however, only reaches 1.64% over 90 days and 5.13% over 180 days. Therefore, while gold might outperform Bitcoin more frequently, Bitcoin’s average returns are much higher. This is particularly evident in the medium and long term.
Disclaimer:
The information provided in this article is for informational purposes only. It is not intended to be, nor should it be construed as, financial advice. We do not make any warranties regarding the completeness, reliability, or accuracy of this information. All investments involve risk, and past performance does not guarantee future results. We recommend consulting a financial advisor before making any investment decisions.
Toghrul Aliyev is the Head of Research who began his journey in crypto in 2021. It all started with a Reddit post that went viral, leading to a writing position while he was still in medical school. As he learned more about crypto, he became deeply interested in it and decided to focus entirely on this field after completing his medical degree and becoming a doctor.
Toghrul specializes in thorough research, always aiming to find details others might miss. He also has a strong understanding of stocks, real-world asset tokenization, and related areas. He is skilled in Python and SQL, which he uses to improve his crypto analysis through data analytics and data science.
When he’s not working, Toghrul enjoys sports, hiking, reading philosophy, such as Seneca's works, and playing story-driven video games.