FARTCOIN price reached the end of a larger uptrend. Bearish signs seen hinting at the correction coming.
Share
Key Takeaways
FARTCOIN completed a five-wave impulse on the four-hour chart.
The price will likely form an ABC correction of nearly $1.10.
Key Fibonacci levels align with potential Wave C targets.
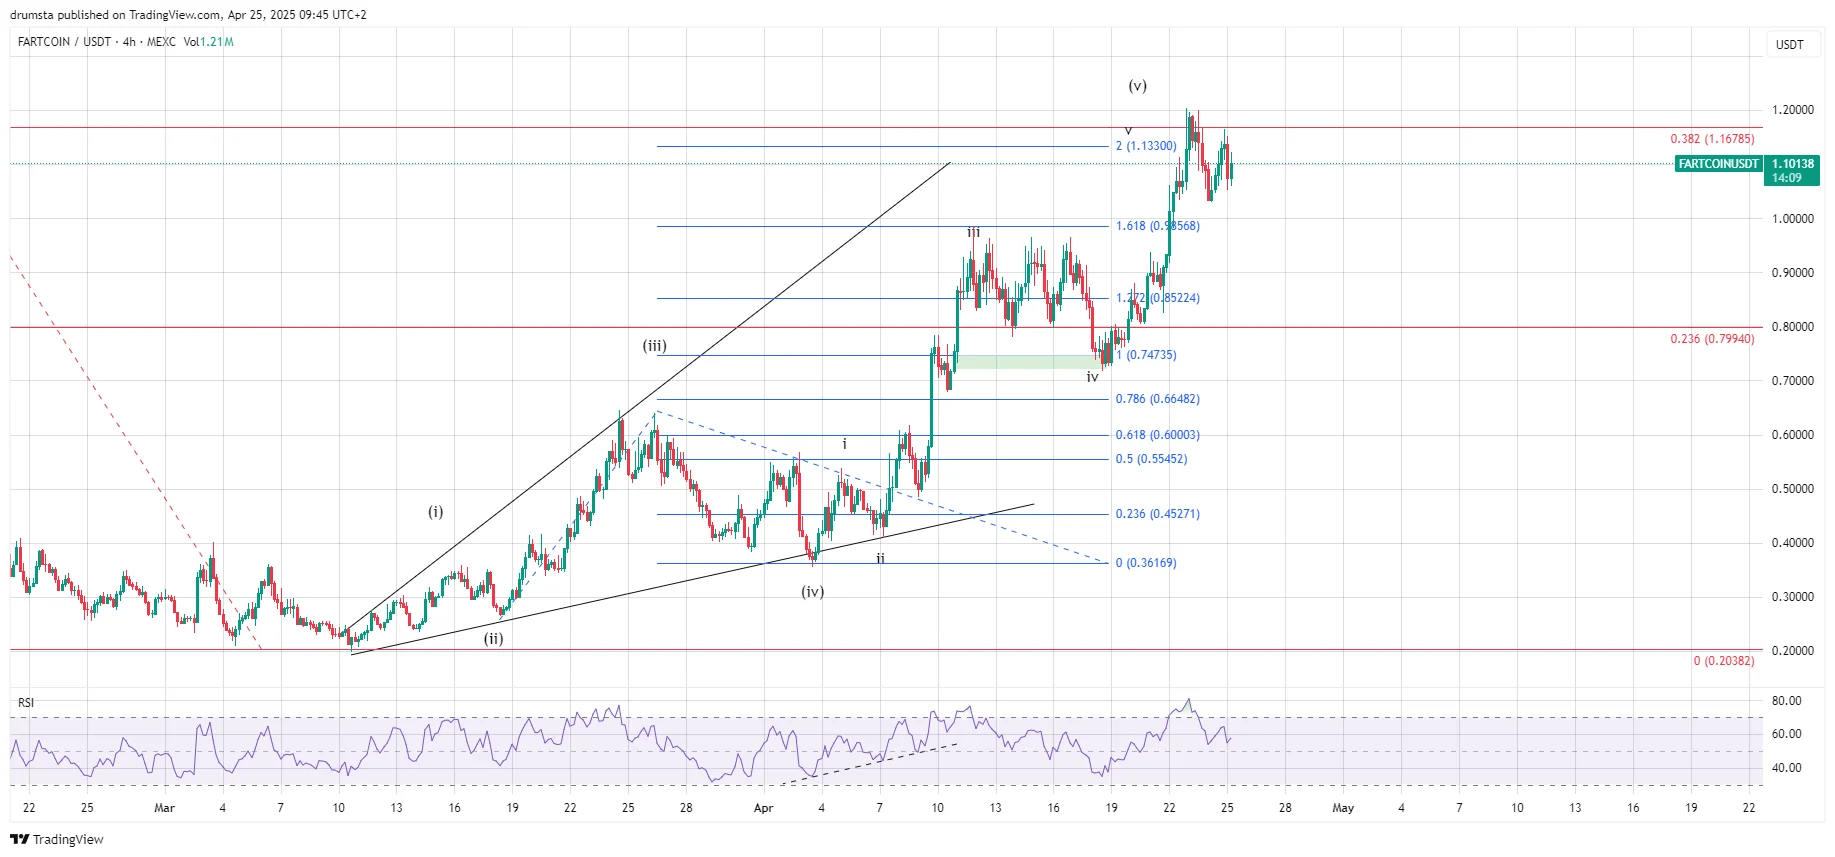
FARTCOIN recently completed a five-wave bullish structure on the higher time frame, culminating in a sharp surge to a local high at $1.133.
Now, with bearish divergences forming on RSI and a visible symmetrical triangle on the intraday chart, the asset appears to be entering a corrective ABC phase.
This analysis explores macro and micro perspectives to assess the next likely move.
FARTCOIN Price Analysis
The 4-hour chart shows a clear five-wave impulse structure, with wave (v) peaking around $1.168, slightly above the 2.0 Fib extension of the prior wave.
This move from the March lows reflects strong bullish momentum. However, the Relative Strength Index (RSI) has diverged since the third subwave of wave (v), signaling weakening momentum.
Wave (iii) ended near $0.86 (1.272 Fib), followed by a shallow wave (iv) that found support at $0.747, before rallying in wave (v).
The overlapping nature of subwaves in (v) suggests the rally may have run its course for now.
Currently, FARTCOIN is consolidating beneath the 0.382 Fib retracement from the macro decline at $1.167.
This level has acted as a resistance ceiling and coincides with historical rejection zones.
With no fresh highs being printed and a lack of volume expansion, a pullback appears more probable than continuation.
Especially since the local RSI failed to breach overbought levels convincingly.
In the larger structure, this pause could begin an ABC correction toward the $0.95–$0.98 area, which aligns with the 1.0 Fib retracement and previous structural support.
Longs should be cautious above $1.13 unless clear breakout confirmation appears.
FARTCOIN Price Prediction
Zooming into the 1-hour chart, we observe an (a)-(b)-(c) correction forming after the triangle breakout failed to extend higher.
The “b” wave bounce was capped just under the descending triangle trendline, and current price action has begun declining, suggesting the onset of wave (c).
The projected path of wave (c) aligns with multiple confluences:
0.618 Fib extension of the recent rally at $1.042,
1.0 extension of wave (a) at $0.981,
1.272 extension at $0.938 also aligns with prior range resistance turned support.
The RSI is trending downward with lower highs, supporting a continuation lower.
Unless FARTCOIN breaks above $1.103 (0.236 Fib from recent drop), the path of least resistance appears to be toward $0.95–$0.98.
Wave (c) completion in that region could mark the end of this local correction and set up for the next upward impulse if supported by strong bounce volume.
Otherwise, a deeper move toward the 1.618 extension at $0.88 can’t be ruled out.
Short-term traders should watch the triangle breakdown confirmation and potential bullish divergence on RSI for a reversal sign.
For now, momentum favors bears in the short term, with a clean wave (c) still unfolding.
Alternatively, we can see that the price is consolidating in an ABCDE corrective pattern, forming a symmetrical triangle.
Disclaimer:
The information provided in this article is for informational purposes only. It is not intended to be, nor should it be construed as, financial advice. We do not make any warranties regarding the completeness, reliability, or accuracy of this information. All investments involve risk, and past performance does not guarantee future results. We recommend consulting a financial advisor before making any investment decisions.
Nikola Lazic is a cryptocurrency analyst and investor working in the industry since 2017. He holds a bachelor's degree in Sociology, which enables him to better understand the psychology behind the crowd´s positioning. Consequently his preferred analytical tool is Elliott Wave Theory in combination with price action analysis.
Combining his experience in trading and investing with knowledge in content writing he strives to bring the most accurate and actionable information.