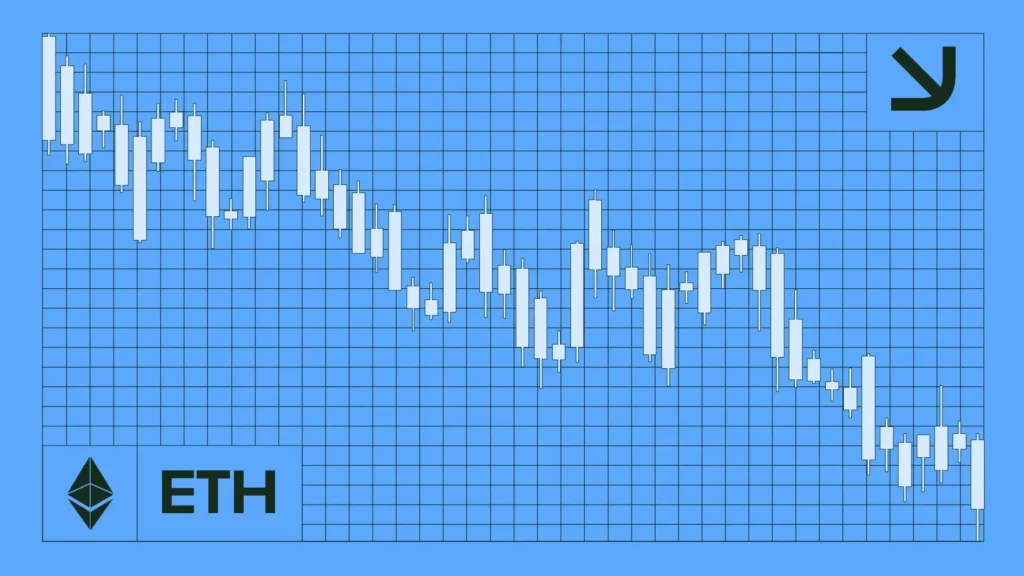
After flashing signs of dropping below $2,000 last week, the price of Ethereum (ETH) resisted the decline. In the last 24 hours, it has jumped by 10% and initially tapped $2,500.
This rebound follows the cryptocurrency’s inclusion in the U.S. crypto reserve. Despite the upswing, ETH’s price has yet to have a clear breakout that could keep it consistently rising.
At the same time, this doesn’t mean ETH will erase all its recent gains. In this analysis, CCN breaks down Ethereum’s current price action and what could be next for the second-largest cryptocurrency.
Ethereum’s price increase to $2,500 came after it completed a three-wave ABC correction. Around Fed. 3, ETH dropped to $2,443 (wave A) from a swing high of $3,471.
Some weeks after this, the value rose to $2,860 (wave B). The cryptocurrency later completed the pattern after it experienced a correction to $2,097 on Feb. 28.
While ETH hovers around $2,427 and is out of the correctional pattern, the 4-hour chart shows it is not out of the woods yet. One reason for this is that ETH is still stuck between a descending channel.
As seen below, the swing low of the descending channel is $2,088, while the swing high is $3,431. For ETH to confirm a sustained uptrend, it has to break above the overhead resistance at $2,822.
Although ETH has faced a slight pullback, it appears that it could be in line for another leg-up. One indicator supporting this position is the Chaikin Money Flow (CMF).
The CMF measures the level of accumulation and distribution. When it rises, it indicates rising accumulation, while a fall signifies distribution.
No Major Resistance
As of this writing, the CMF on the ETH/USD 4-hour chart has broken above the zero signal line, indicating increasing buying pressure. Should this remain the same, Ethereum’s price might breach the $2,822 resistance, which could give way to a higher value.
The on-chain outlook also shows that Ethereum’s price will likely break through the obstacle. According to the In/Out of Money Around Price (IOMAP), strong support for ETH lies between $2,340 and $2,411.
At this price range, 2.44 million addresses accumulated nearly 60 million ETH. The coins purchased in this region exceed those bought between $2,416 and $2,779.
Due to this, ETH might not face any notable sell-wall ahead as it attempts to break out. Should buying pressure increase, as it has lately, a quick move to $2,800 could be next, with higher targets ahead.
ETH In/Out of Money Around Price | Credit: IntoTheBlock
ETH Price Prediction: Bullish or Bearish?
Meanwhile, the daily chart appears to be a different scenario, especially as ETH’s price encountered rejection at $2,517. Besides that, the Relative Strength Index (RSI) still hovers below the neutral line.
This indicates that the momentum around ETH is not yet bullish enough to confirm the breakout toward $3,000. In addition, Ethereum’s price, while flirting with the 20-day Exponential Moving Average (EMA), has not risen above it.
Should this remain the same, ETH could keep swinging between $2,118 and $2,544. However, if buying pressure increases, Ethereum could break the resistance at the 0.618 Fibonacci level positioned at $2,879.
In that scenario, the next target for the cryptocurrency could be around $3,113. In a highly bullish scenario, the price could jump to $3,348.
On the flip side, if the cryptocurrency’s value fails to rise above $2,544, this could lead to an extended correction.
In that case, Ethereum’s value could crash below the $2,000 mark.
Disclaimer:
The information provided in this article is for informational purposes only. It is not intended to be, nor should it be construed as, financial advice. We do not make any warranties regarding the completeness, reliability, or accuracy of this information. All investments involve risk, and past performance does not guarantee future results. We recommend consulting a financial advisor before making any investment decisions.
Victor Olanrewaju is a crypto analyst and reporter at CCN with deep roots in on-chain research and technical analysis. His crypto journey began in 2017, but it was the 2020 Uniswap airdrop that sparked a full-time pivot into the space.
With a foundation in copywriting, Victor honed his craft creating high-converting content for leading crypto brokers — most notably an XRP price prediction that ranked #1 on Google during the 2021 bull run.
He later joined AMBCrypto in 2022, where he combined storytelling with technical and on-chain analysis to cover key market narratives.
In 2024, he expanded his expertise at BeInCrypto, collaborating with analysts and using tools like Glassnode, Santiment, and IntoTheBlock to break down Bitcoin and altcoin trends.
At CCN, Victor covers the top cryptocurrencies, memecoins, macro shifts, blending real-time insights with deep-dive metrics.
He holds a Bachelor’s degree in Physics from the University of Ibadan, equipping him to simplify complex data for a wide audience. Follow his work or connect on LinkedIn or X.