What’s Next for ETH in 2025 After Recent Decline Below $3,000
Share
Key Takeaways
Ethereum price faces crucial resistance at a price range with over 4 million coins in unrealized losses.
User engagement has decreased, indicating that ETH’s price might struggle to sustain the recent bounce.
Technical indicators, including the MACD, reveal that the cryptocurrency might drop below $3,000 again.
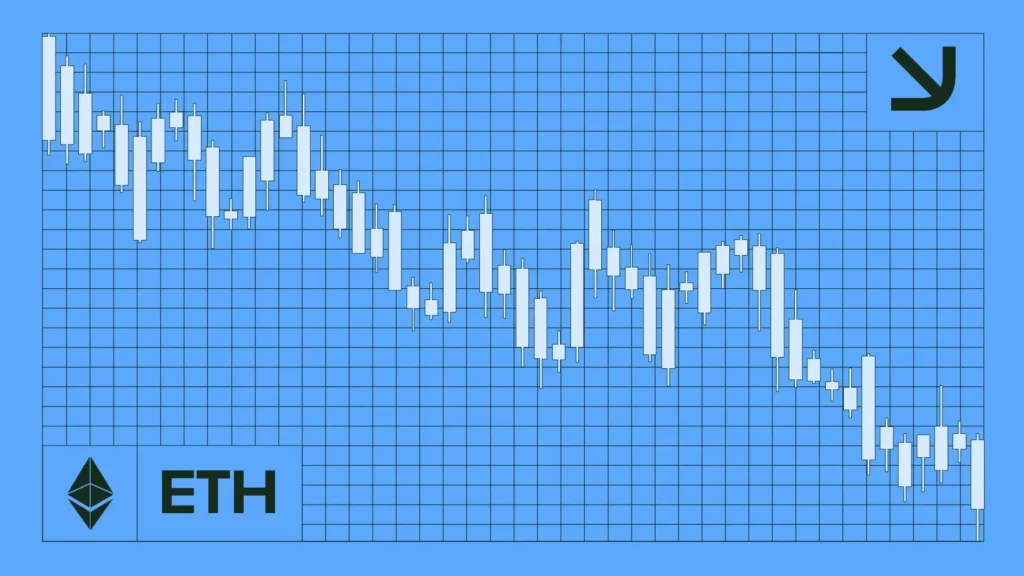
Ethereum (ETH) price briefly fell below $3,000 yesterday, Jan. 13, for the first time since November 2024.
While the price has risen above $3,100 as of this writing, that decline has again raised concerns about the cryptocurrency’s potential this year.
In 2024, many analysts predicted Ethereum (ETH) would mirror Bitcoin’s (BTC) rally and reach a new all-time high. However, despite the approval of Ethereum exchange-traded funds (ETFs), ETH failed to break past its previous peak.
With 2025 here, this analysis reveals why ETH may continue to struggle in its quest for new highs unless something changes.
On-Chain Analysis Flashes Several Negative Signals
The In/Out of Money Around Price (IOMAP) indicates that the Ethereum price might continue to struggle. The IOMAP identifies key price ranges where addresses are likely to buy or sell based on the volume at those levels.
Typically, the higher the volume cluster at a price range, the stronger the support or resistance. According to data from IntoTheBlock, the major resistance for ETH is between $3,280 and $3,376.
At this price range, 4.48 million Ethereum addresses hold 5.77 million coins at unrealized losses. Therefore, if the price moves toward this point, some of these addresses might break even.
If this occurs, the level could serve as a resistance point for ETH, hindering its ability to reach higher values.
Ethereum In/Out of Money Around Price | Credit: IntoTheBlock
Another indicator with a similar bias is the price-Daily Active Addresses (DAA) divergence. The DAA refers to the number of unique crypto addresses interacting with a specific coin on a daily basis.
When combined with the price action, the indicator shows whether user engagement can help the price continue increasing. When the price rises alongside the active addresses, it is a bullish sign, and the price can hit higher values.
But according to Santiment, Ethereum’s price DAA divergence has plummeted.
This indicates a lack of sufficient network activity to drive the price higher. If this trend continues, ETH risks falling below $3,000 again, making a rally to a new high in 2025 increasingly challenging.
From a technical standpoint, the daily chart shows that the Ethereum price has formed a head-and-shoulders pattern.
The head-and-shoulders pattern consists of three peaks. It starts with an initial uptrend (the left shoulder), then a higher one in the middle (the head), and another peak afterward (the right shoulder). A bearish head-and-shoulders pattern consists of three peaks, with the middle one being the highest.
At the same time, it is attempting to climb past the O.236 Fibonacci retracement level. However, the Moving Average Convergence Divergence (MACD) remains below the neutral line, indicating bearish momentum around ETH.
Should this remain the same, Ethereum’s price might decline to $2,914 in the short term. On the contrary, if ETH successfully breaks above the 0.382 Fib level at $3,371, the trend might change.
In that case, the cryptocurrency could rally toward $4,109. If that happens, then Ethereum might possibly climb above its all-time high before the year closes.
Disclaimer:
The information provided in this article is for informational purposes only. It is not intended to be, nor should it be construed as, financial advice. We do not make any warranties regarding the completeness, reliability, or accuracy of this information. All investments involve risk, and past performance does not guarantee future results. We recommend consulting a financial advisor before making any investment decisions.
Victor Olanrewaju is a crypto analyst and reporter at CCN with deep roots in on-chain research and technical analysis. His crypto journey began in 2017, but it was the 2020 Uniswap airdrop that sparked a full-time pivot into the space.
With a foundation in copywriting, Victor honed his craft creating high-converting content for leading crypto brokers — most notably an XRP price prediction that ranked #1 on Google during the 2021 bull run.
He later joined AMBCrypto in 2022, where he combined storytelling with technical and on-chain analysis to cover key market narratives.
In 2024, he expanded his expertise at BeInCrypto, collaborating with analysts and using tools like Glassnode, Santiment, and IntoTheBlock to break down Bitcoin and altcoin trends.
At CCN, Victor covers the top cryptocurrencies, memecoins, macro shifts, blending real-time insights with deep-dive metrics.
He holds a Bachelor’s degree in Physics from the University of Ibadan, equipping him to simplify complex data for a wide audience. Follow his work or connect on LinkedIn or X.