Ethereum rebounded from $1,500 but remains under bearish pressure below major averages. Traders watch the critical $1,770 resistance level. | Credit: CCN.com
Share
Key Takeaways
Ethereum has rebounded from the $1,500 support zone, recovering toward $1,700 after a sharp selloff, but the broader trend remains bearish.
The recovery appears to be driven primarily by oversold conditions, rather than a clear return of strong institutional buying activity.
The next few trading sessions are critical, with ETH positioned at a key technical crossroads between a broader recovery attempt and continuation of the downtrend.
Ethereum has staged a notable recovery after plunging toward the $1,500 support zone, but the second-largest cryptocurrency by market capitalization remains trapped within a broader bearish structure.
After briefly testing multi-month lows, ETH has rebounded toward $1,700, offering some relief to investors following weeks of intense selling pressure.
However, technical indicators and market sentiment suggest that the latest rally may still face significant obstacles before a sustained trend reversal can be confirmed.
While the recovery has improved short-term momentum, Ethereum continues to trade below major moving averages and a long-term descending trendline that has defined its downtrend throughout 2026.
New Trending Crypto Wallet Offers
Sponsored
Disclosure
We sometimes use affiliate links in our content, when clicking on those we might receive a commission at no extra cost to you. By using this website you agree to our terms and conditions and privacy policy.
Ethereum’s Recovery Gains Momentum but Trend Remains Bearish
Ethereum’s recent rebound was triggered after buyers aggressively defended the key $1,500 demand zone, preventing a deeper breakdown and encouraging a wave of short-term buying.
The recovery pushed ETH back above $1,640 and toward the psychologically important $1,700 level, helping restore confidence after the sharp selloff.
Despite this bounce, the broader technical picture remains firmly tilted toward sellers. Ethereum continues to trade below its 100-day moving average near $2,100 and its 200-day moving average around $2,400, two indicators that typically define the long-term trend.
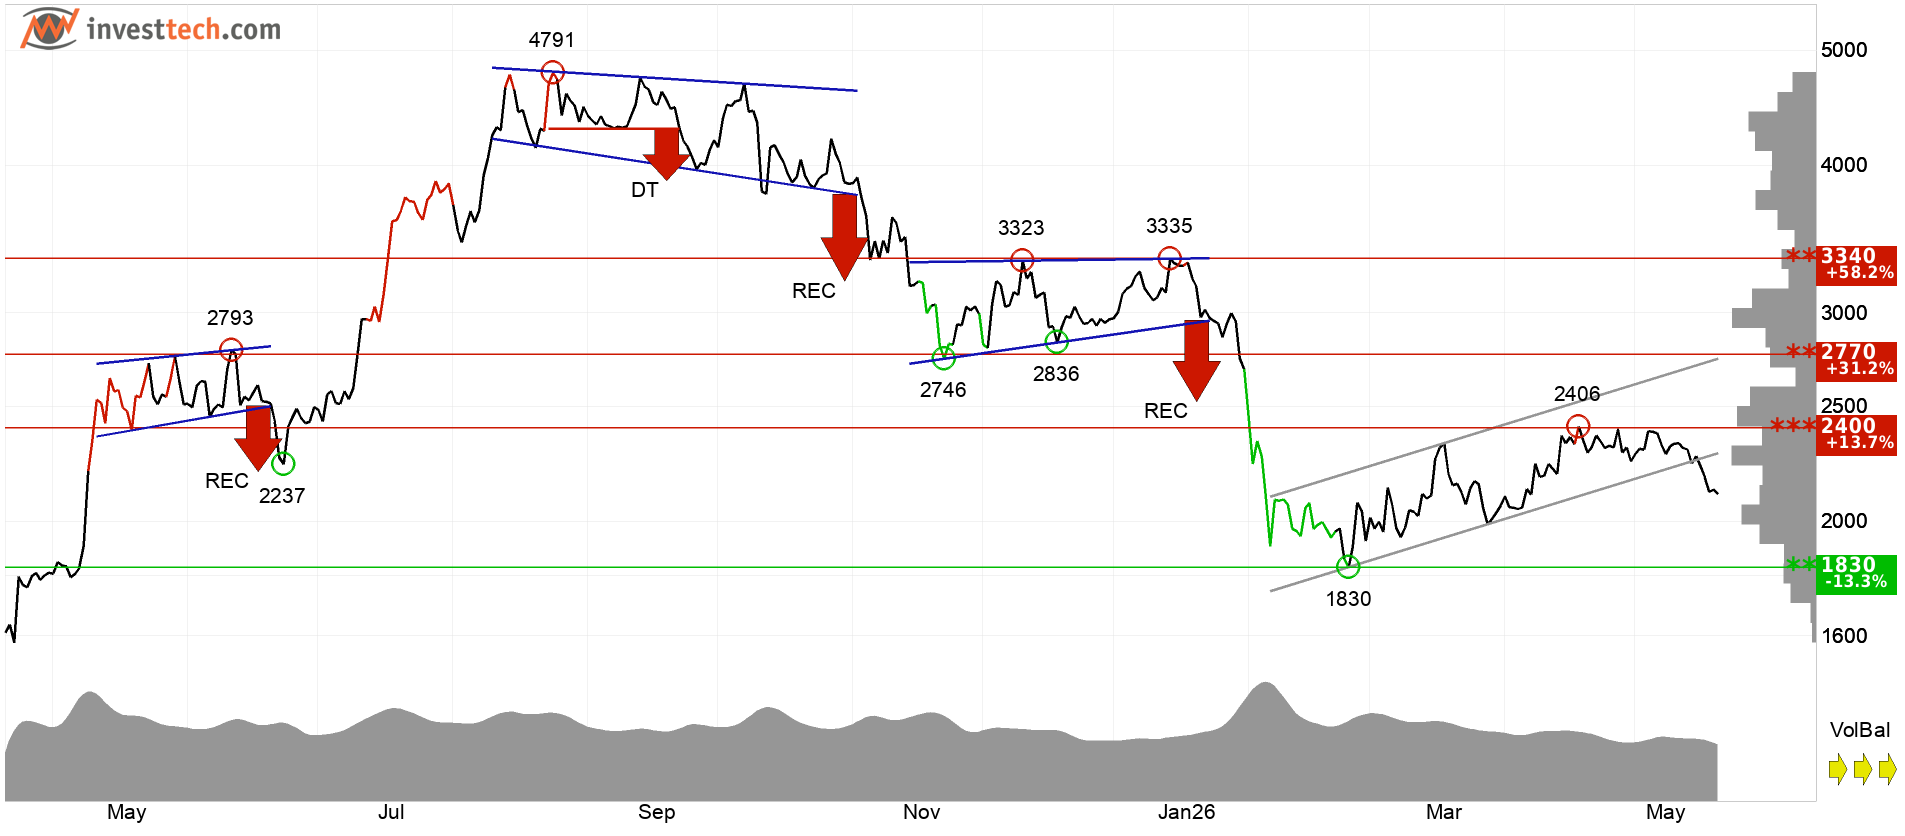
Ethereum has broken through the floor of a rising trend channel. | Credit: InvestTech
As long as ETH remains below these levels, market participants are likely to view rallies as corrective moves rather than the beginning of a new bull cycle.
Adding to the bearish outlook is the long-term descending trendline that has consistently rejected upside attempts over recent months. The trendline remains intact and continues to serve as a significant barrier to any meaningful recovery.
At the same time, momentum indicators are beginning to show early signs of stabilization. Relative Strength Index (RSI) readings recovered from oversold territory, suggesting that selling pressure has eased following the recent capitulation event.
This improvement in momentum may support additional upside in the near term, but it does not yet invalidate the prevailing bearish structure.
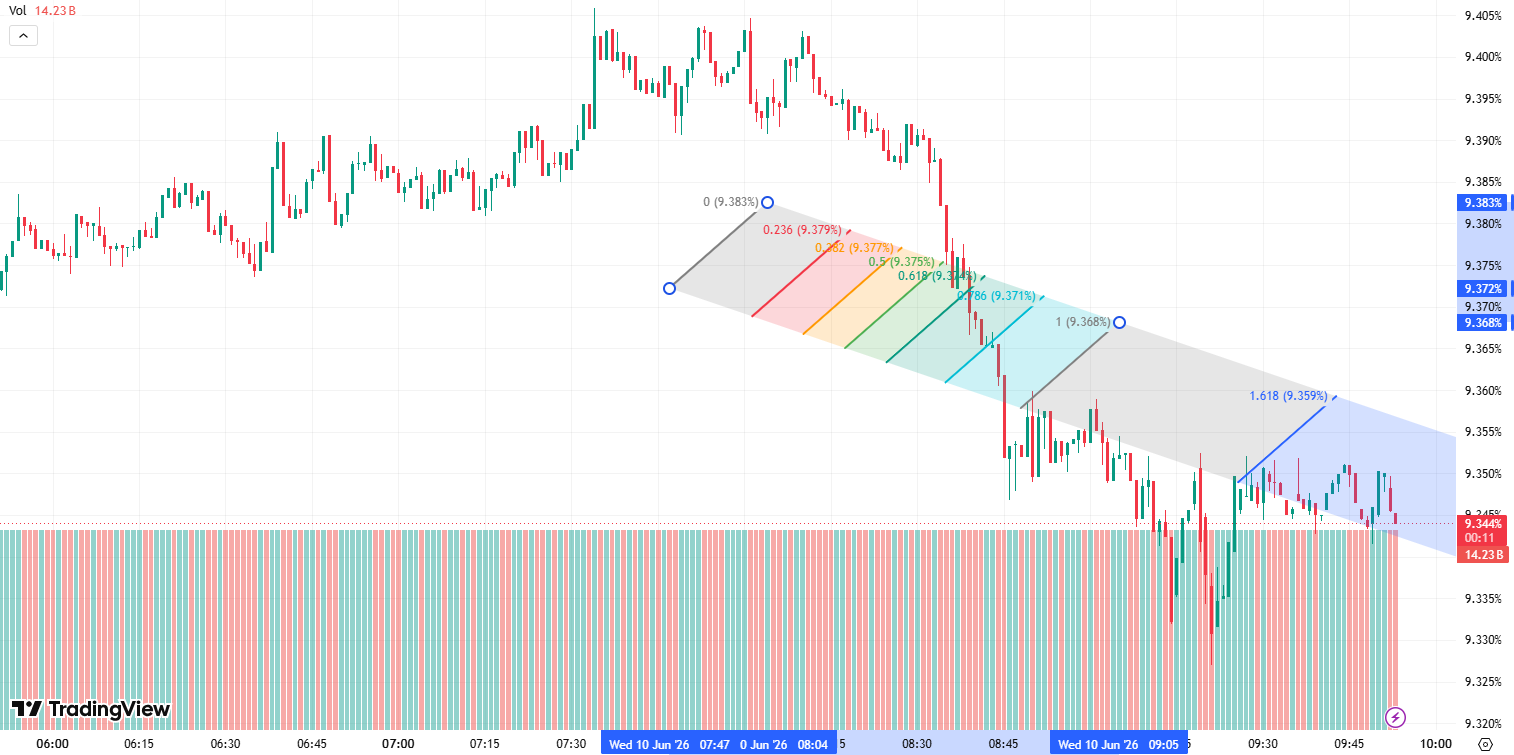
Key Fibonacci Resistance Levels Could Decide Ethereum’s Next Move
Technical analysts are closely watching a cluster of Fibonacci retracement levels that may determine the next major direction for ETH.
The first significant resistance lies near the 0.5 Fibonacci retracement level at approximately $1,770. This area represents the most immediate obstacle for bulls and coincides with a zone where sellers could re-enter the market following the recent rebound.
Ethereum faces further resistance at $1,830, the 0.618 retracement level. | Credit: TradingView
Beyond that, Ethereum faces additional resistance at $1,830, the 0.618 retracement level, followed by a stronger barrier at $1,920, the 0.786 retracement level. Together, these levels form a major supply zone that could cap upside momentum if broader market conditions remain weak.
On lower timeframes, ETH is currently receiving support from a bullish fair value gap around $1,640. This zone has acted as an important demand area during the recovery and may continue to provide a foundation for further gains as long as buyers remain active.
If Ethereum successfully breaks above $1,770 and maintains momentum, traders could target $1,830 and potentially $1,920 in a larger short-squeeze scenario.
However, failure to overcome resistance may encourage renewed selling pressure and increase the risk of another move toward the $1,500 low.
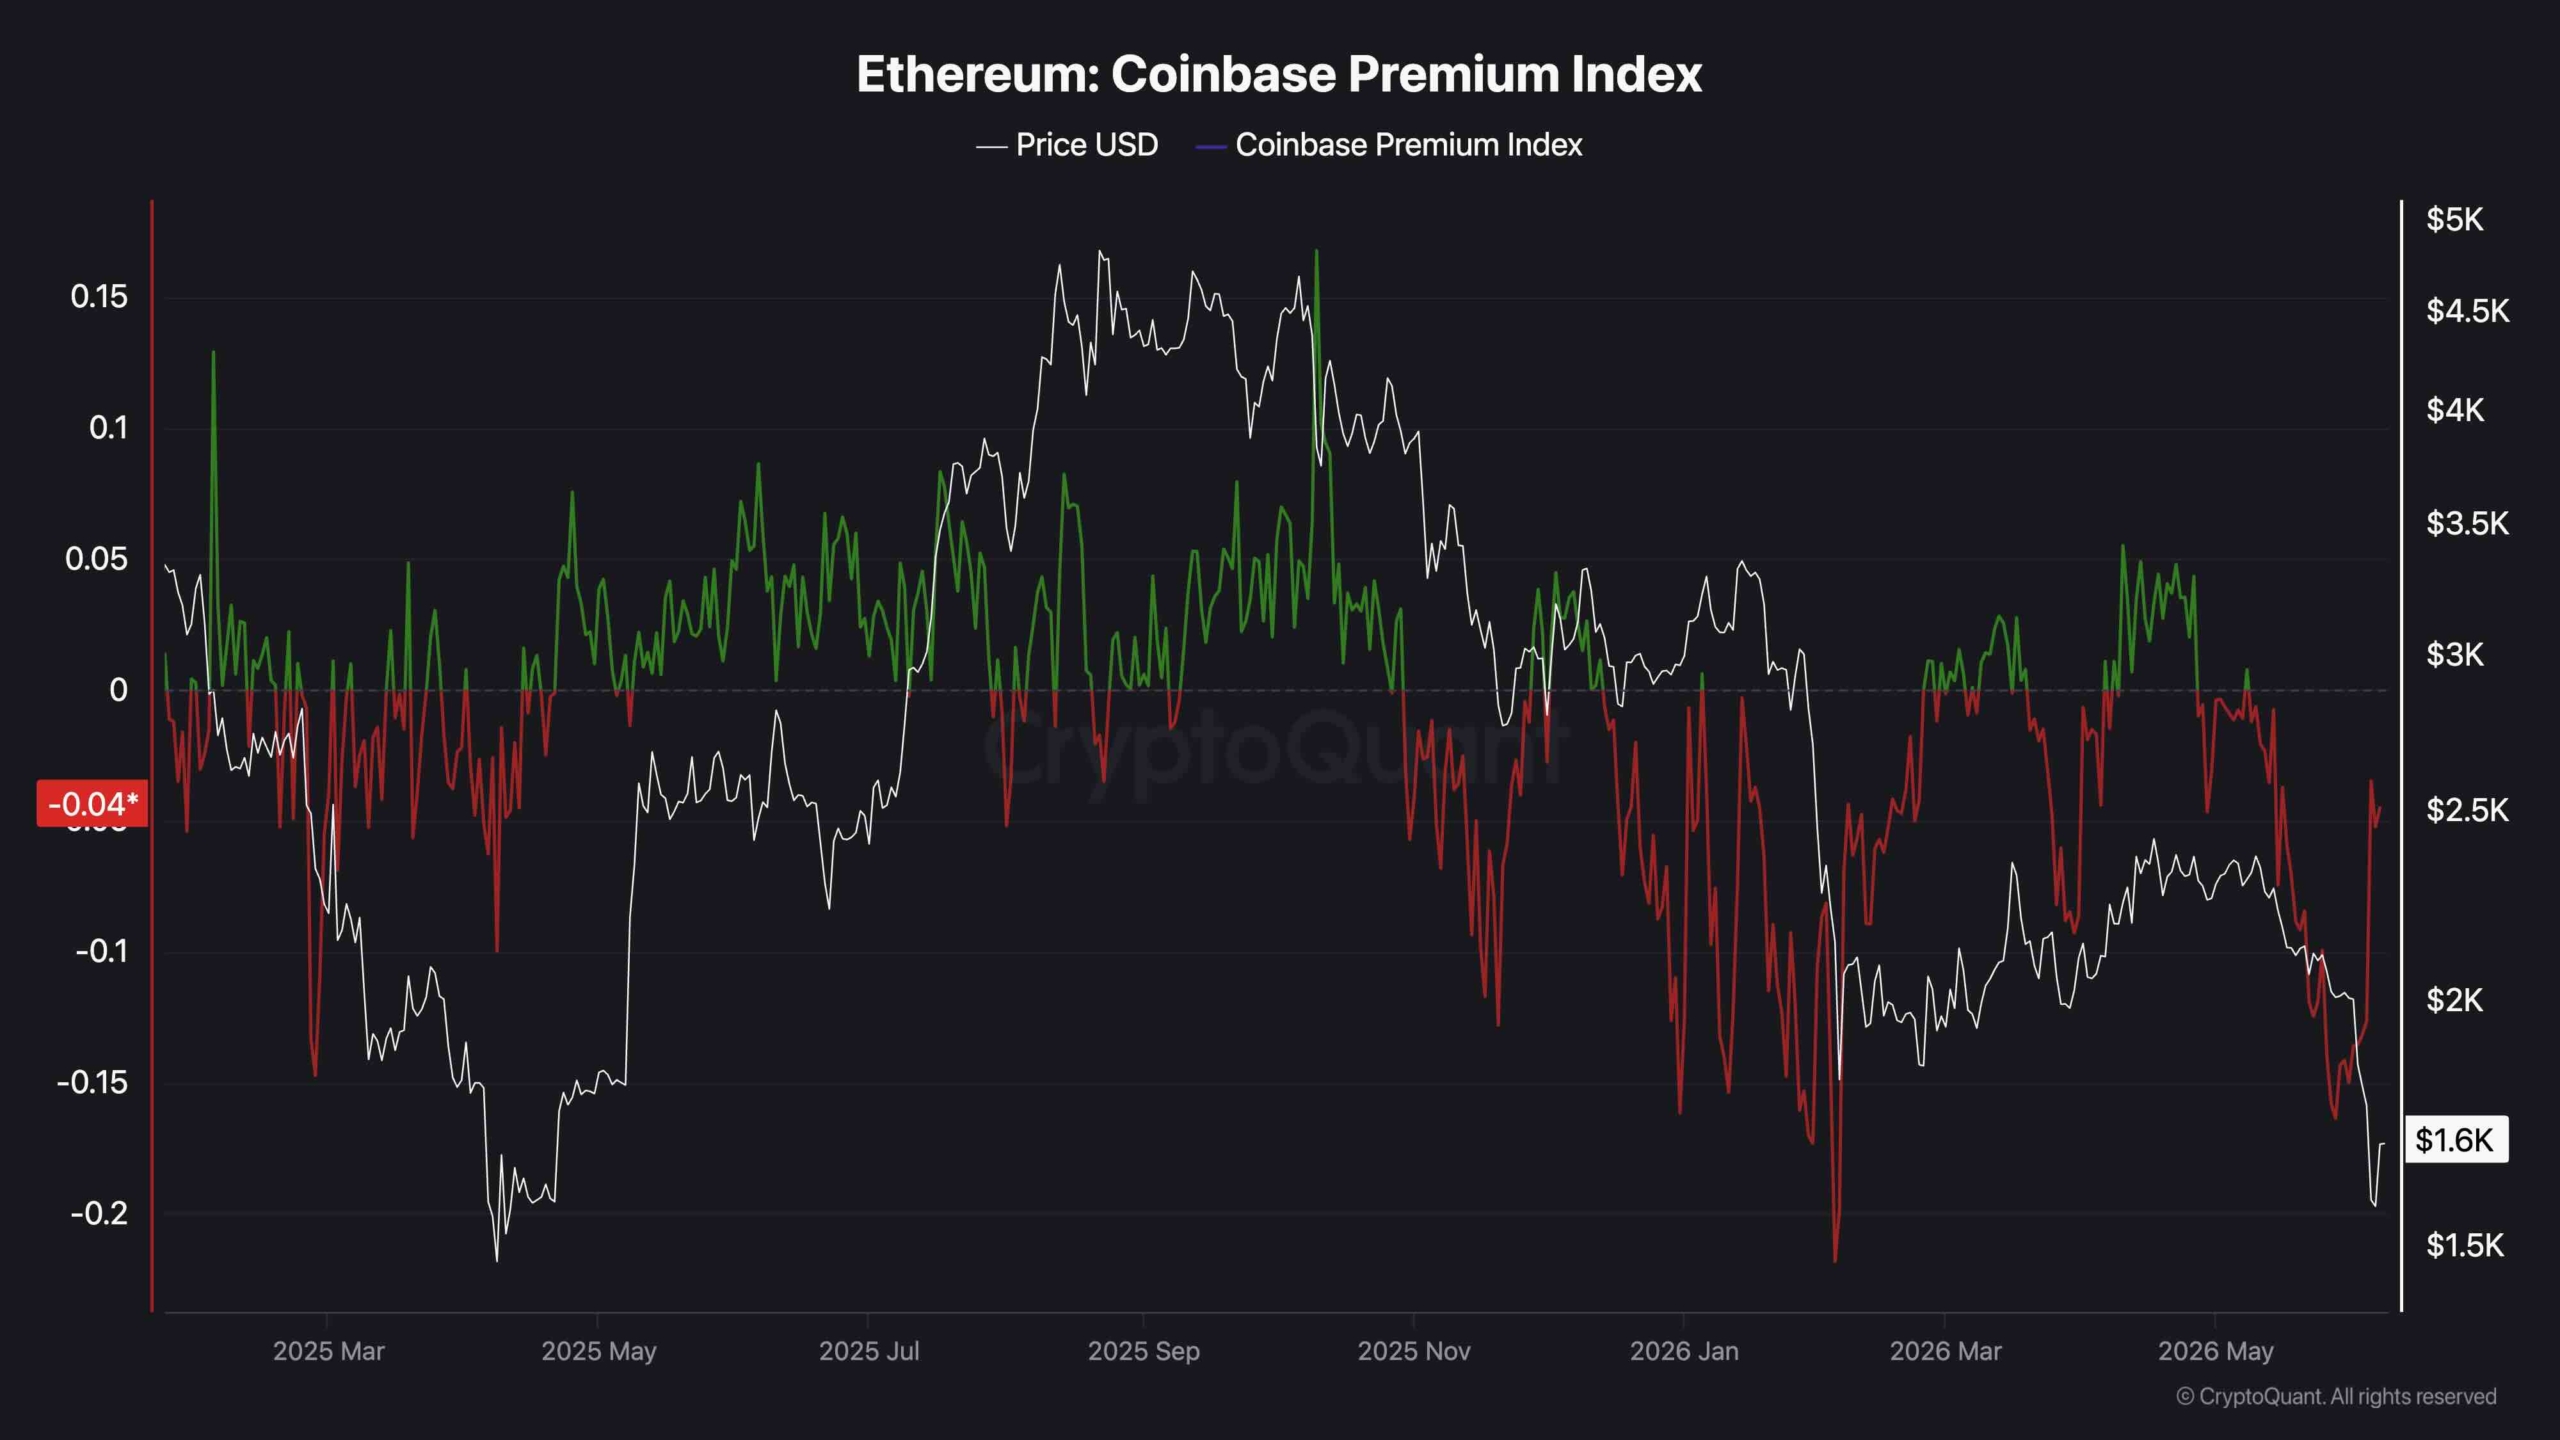
Market sentiment indicators suggest that Ethereum’s recovery is currently driven more by technical factors than by strong institutional accumulation.
One of the most closely watched measures of institutional demand, the Coinbase Premium Index, remains in negative territory at approximately minus 0.04.
The metric tracks the price difference between Coinbase and offshore exchanges and is often used as a proxy for US-based investor demand.
Although the indicator remains below zero, it has improved substantially from recent lows near minus 0.15.
Historically, such deeply negative readings have coincided with capitulation events and periods of intense market stress.
The recent recovery suggests that selling pressure may be easing, but it stops short of confirming a return of aggressive buying activity.
For Ethereum to establish a more durable bullish reversal, analysts argue that the Coinbase Premium Index would need to return to positive territory and remain there consistently.
Until that occurs, the current recovery may act as a bounce from oversold conditions rather than evidence of a broader accumulation phase.
As a result, Ethereum finds itself at a crucial crossroads. The rebound from $1,500 has improved short-term sentiment and stabilized momentum, but major technical and institutional hurdles remain.
Giuseppe Ciccomascolo began his career as an investigative journalist in Italy, where he contributed to both local and national newspapers, focusing on various financial sectors.
Upon relocating to London, he worked as an analyst for Fitch's CapitalStructure and later as a Senior Reporter for Alliance News. In 2017, Giuseppe transitioned to covering cryptocurrency-related news, producing documentaries and articles on Bitcoin and other emerging digital currencies. He also played a pivotal role in establishing the academy for a cryptocurrency exchange website. Crypto remained his primary area of interest throughout his tenure as a writer for ThirdFloor.