Here's Why Cardano's Downtrend May Deepen | Credit: Hameem Sarwar
Share
Key Takeaways
Cardano’s (ADA) weekly RSI has generated a bullish divergence.
ADA trades in a bearish pattern below a diagonal resistance.
Will the long-term bullish or short-term bearish outlook play out?
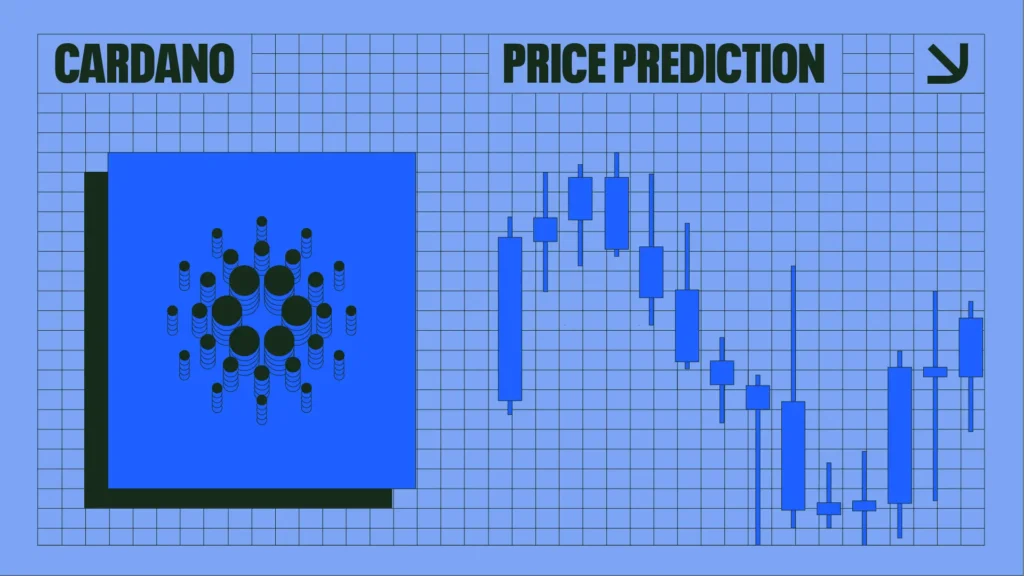
Cardano (ADA) has struggled in 2024. While the price began the year positively, reaching a new yearly high in March, it has fallen since, culminating with a low of $0.27 on Aug. 5. This was a decline of over 65% since the yearly high.
While bullish signs develop in long-term time frames, the short-term ones are still bearish. Let’s analyze the ADA price action and see which has a better chance of playing out.
However, while the RSI reading is bullish, the price action is not. This is because the Cardano price has fallen under the $0.45 horizontal resistance area, a critical level that provided resistance for most of 2023 before seemingly turning to support in 2024 (white icon).
The decline below it signals that the trend may be turning bearish. ADA has to reclaim this level to confirm a bullish trend reversal.
Unless the divergence plays out, ADA risks falling to the range low of $0.25.
To confirm the divergence, the RSI must break out from its resistance trend line at 52 and move above 50.
ADA Price Breakdown Ahead?
While the weekly time frame readings are mixed, the daily ADA price analysis is bearish because of the price action, wave count, and indicator readings.
Since April, the price has declined under a descending resistance trend line (white). So far, the downward movement has caused four rejections (white icons).
Next, ADA risks breaking down from an ascending parallel channel. The channel contains an A-B-C structure, and its breakdown will confirm that the previous rally was corrective.
Finally, the daily RSI broke down from its ascending support trend line, implying that the upward movement has ended.
So, the combination of the weekly and daily timeframe readings suggests that ADA will break down from its short-term pattern and fall to the long-term support level of $0.25.
Bullish Reversal Has to Wait
Even though ADA has recovered since Aug. 5, signs in different timeframes indicate the trend is bearish.
As a result, an ADA price breakdown from the channel is likely, possibly taking the price down to the range low of $0.25.
Disclaimer:
The information provided in this article is for informational purposes only. It is not intended to be, nor should it be construed as, financial advice. We do not make any warranties regarding the completeness, reliability, or accuracy of this information. All investments involve risk, and past performance does not guarantee future results. We recommend consulting a financial advisor before making any investment decisions.
Valdrin Tahiri is a cryptocurrency analyst and reporter at CCN, specializing in technical analysis with a focus on Elliott Wave theory, on-chain metrics, and fundamental research. He brings over seven years of experience in the crypto space as both a trader and writer.
He discovered cryptocurrencies in 2017 while earning his MSc in Financial Markets at the Barcelona School of Economics, which sparked a deep interest in blockchain and market dynamics. Since then, he’s contributed to top crypto outlets like BeInCrypto and CoinGape.
Valdrin also served as Community Manager of BeInCrypto’s Telegram group for three years, helping grow it into one of the largest crypto communities worldwide. His expertise in market structure and price patterns allows him to break down complex trends into clear, actionable insights.
He’s published thousands of articles covering altcoins, Bitcoin cycles, and macro trends.