BNB coin hits record highs as market awaits Fed rate cut.
Share
Key Takeaways
BNB surged to a fresh all-time high of $962.29 ahead of a potential Fed rate cut.
Active addresses rose to 1.56 million while the MVRV ratio signals room for upside.
BNB could hit $1,200 with a Fed cut, but failure to deliver could trigger a retrace.
In a few hours, the Federal Open Market Committee (FOMC) will decide whether to cut interest rates. Anticipation is high, and many traders expect a bullish outcome for risk assets.
BNB has already surged to a new all-time high ahead of the meeting, becoming the standout performer among the top 10 cryptos. Earlier today, the altcoin hit $962.29.
And the rally may not be over. If the Fed delivers a rate cut, the BNB coin price could climb even higher — not just in the short term but in the months ahead.
This analysis evaluates how high BNB can go after today’s decision.
BNB Momentum Builds
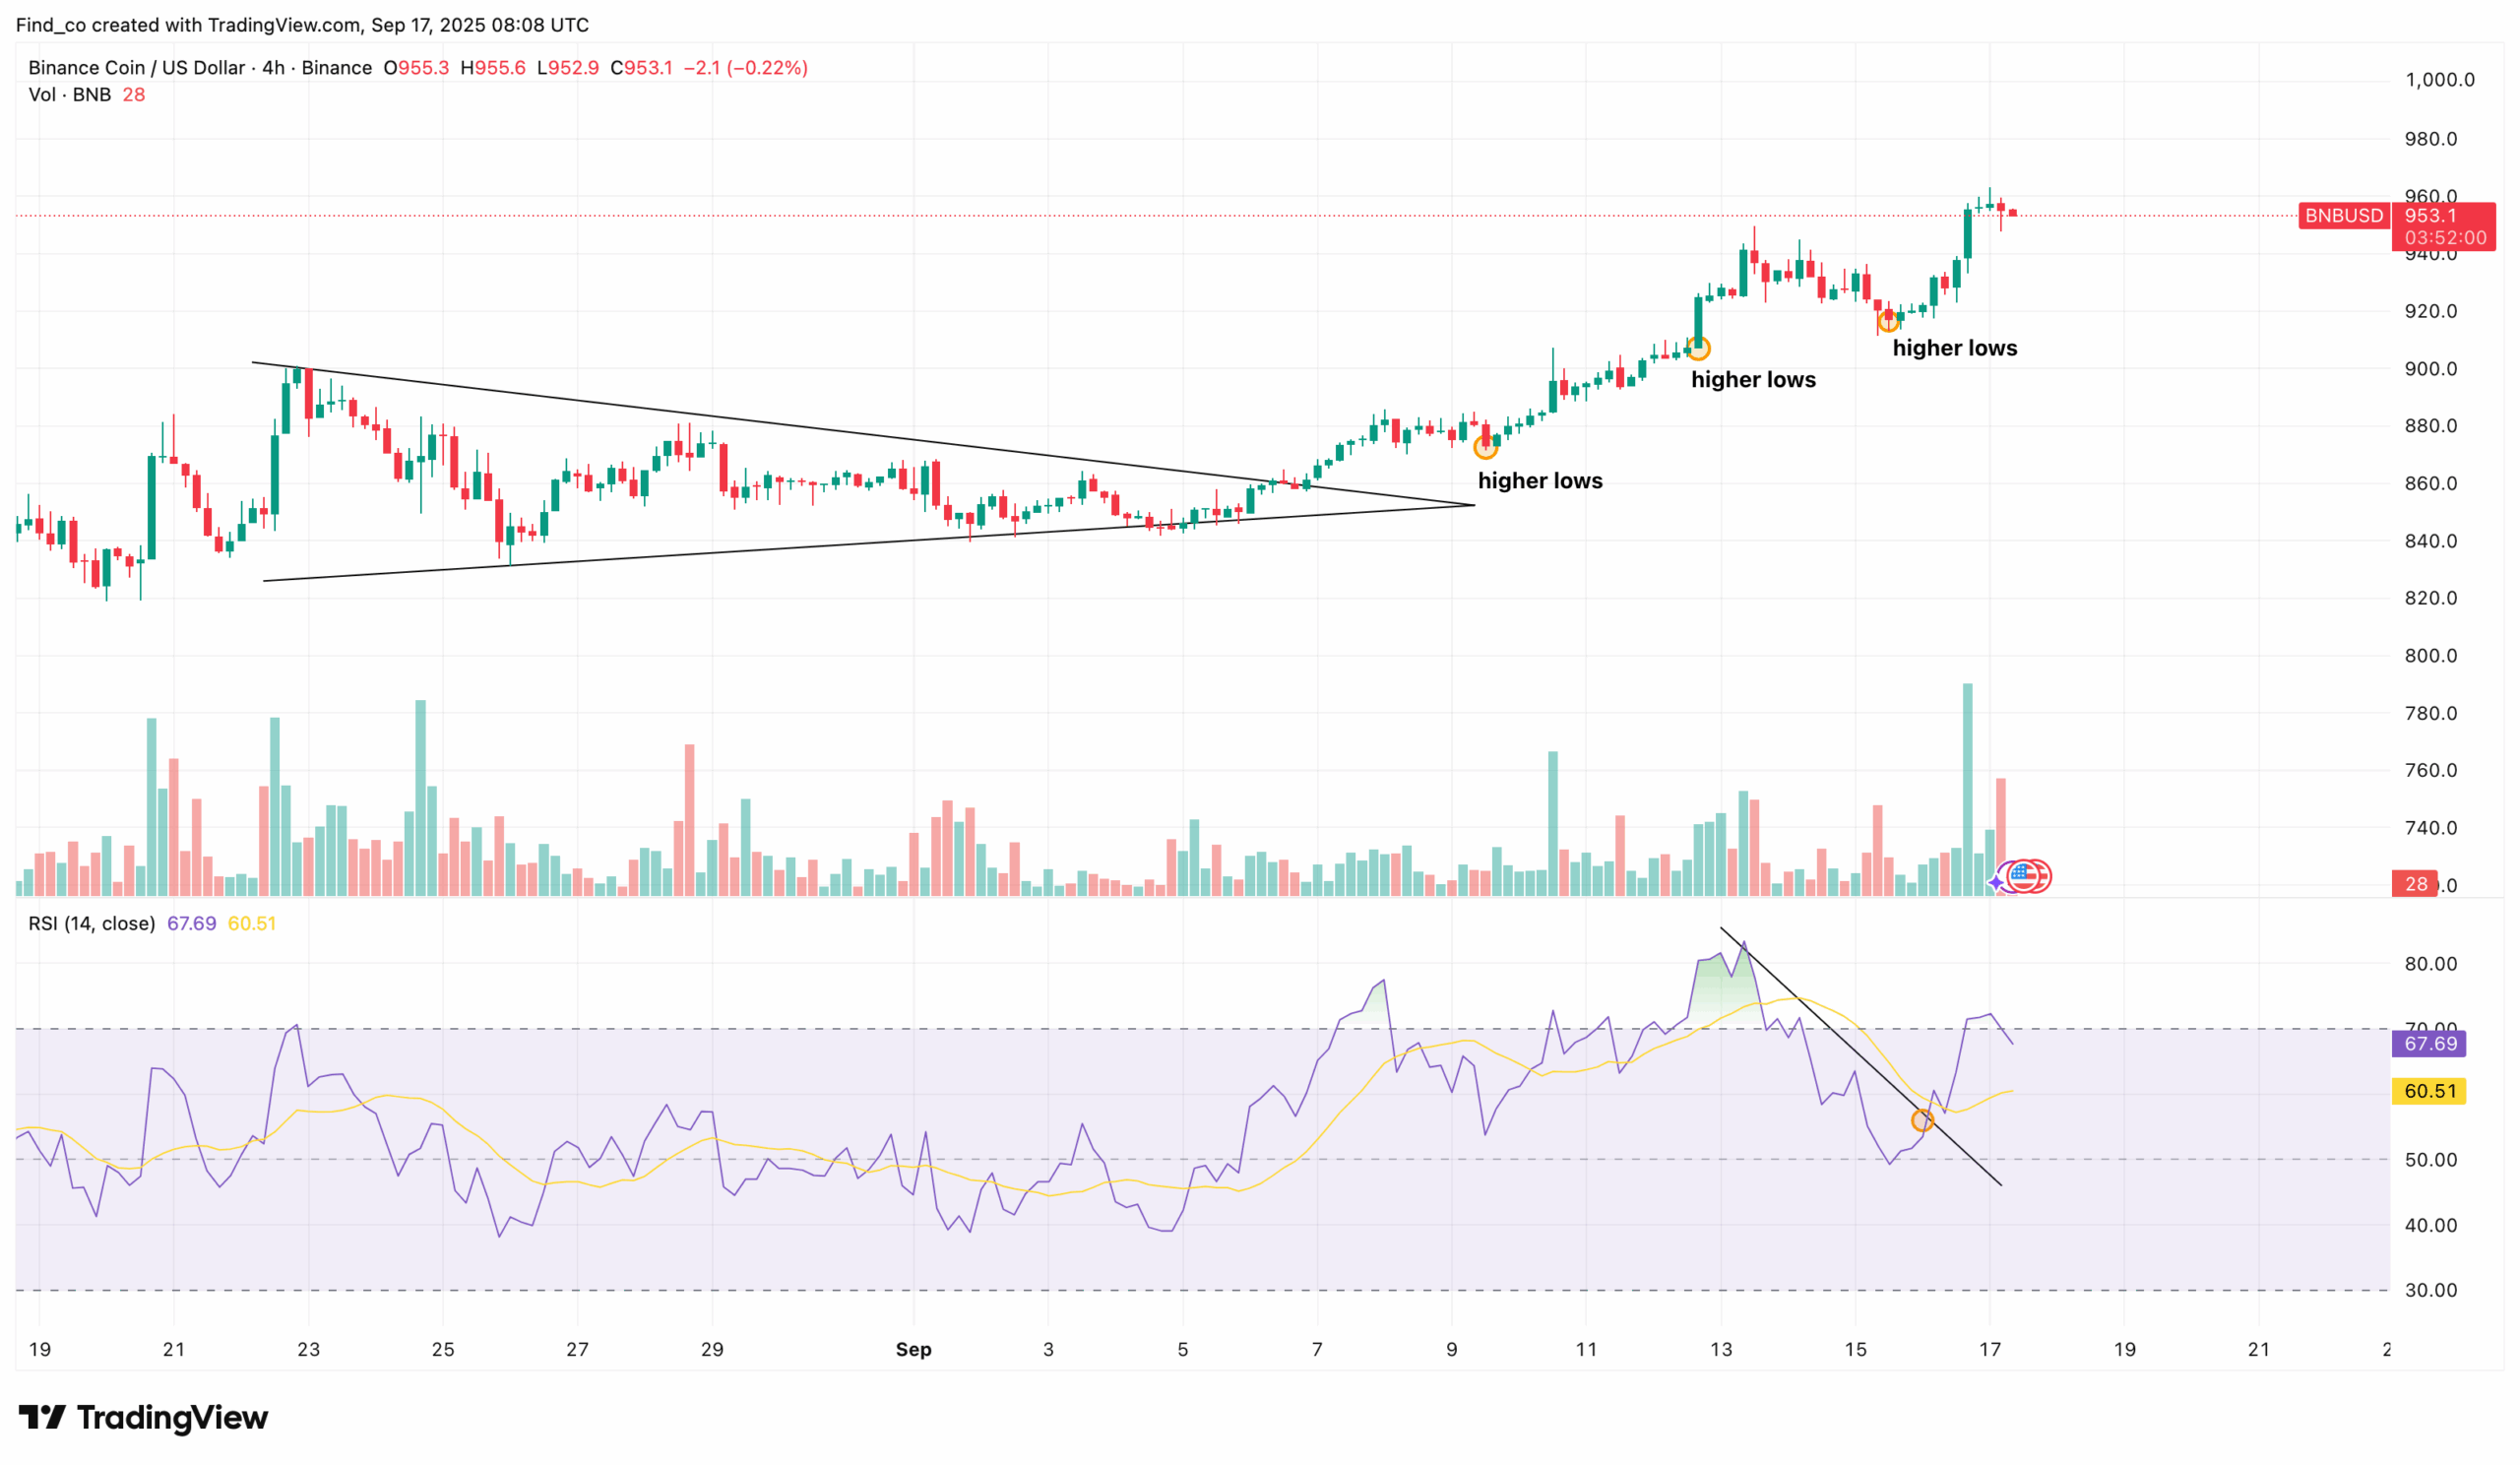
In early September, the BNB coin price was locked inside a symmetrical triangle, consolidating as traders waited for direction.
However, as of now, the altcoin has broken above the upper trendline, unleashing fresh bullish momentum.
Adding confirmation, CCN observed that the Relative Strength Index (RSI) broke above its descending trendline, signaling renewed strength in market momentum.
Together, the breakout, higher lows, and RSI reversal paint a clear picture: BNB’s uptrend is not over.
Instead, while it might undergo a brief consolidation, it will likely hit another record high within a short period.
From an on-chain perspective, BNB’s active addresses have climbed to 1.56 million. The surge in this metric reflects increased adoption and greater overall network activity.
This is a bullish signal for the BNB coin price action. As more wallets transact with BNB, the likelihood of sustained demand rises, which can help support and extend the current rally.
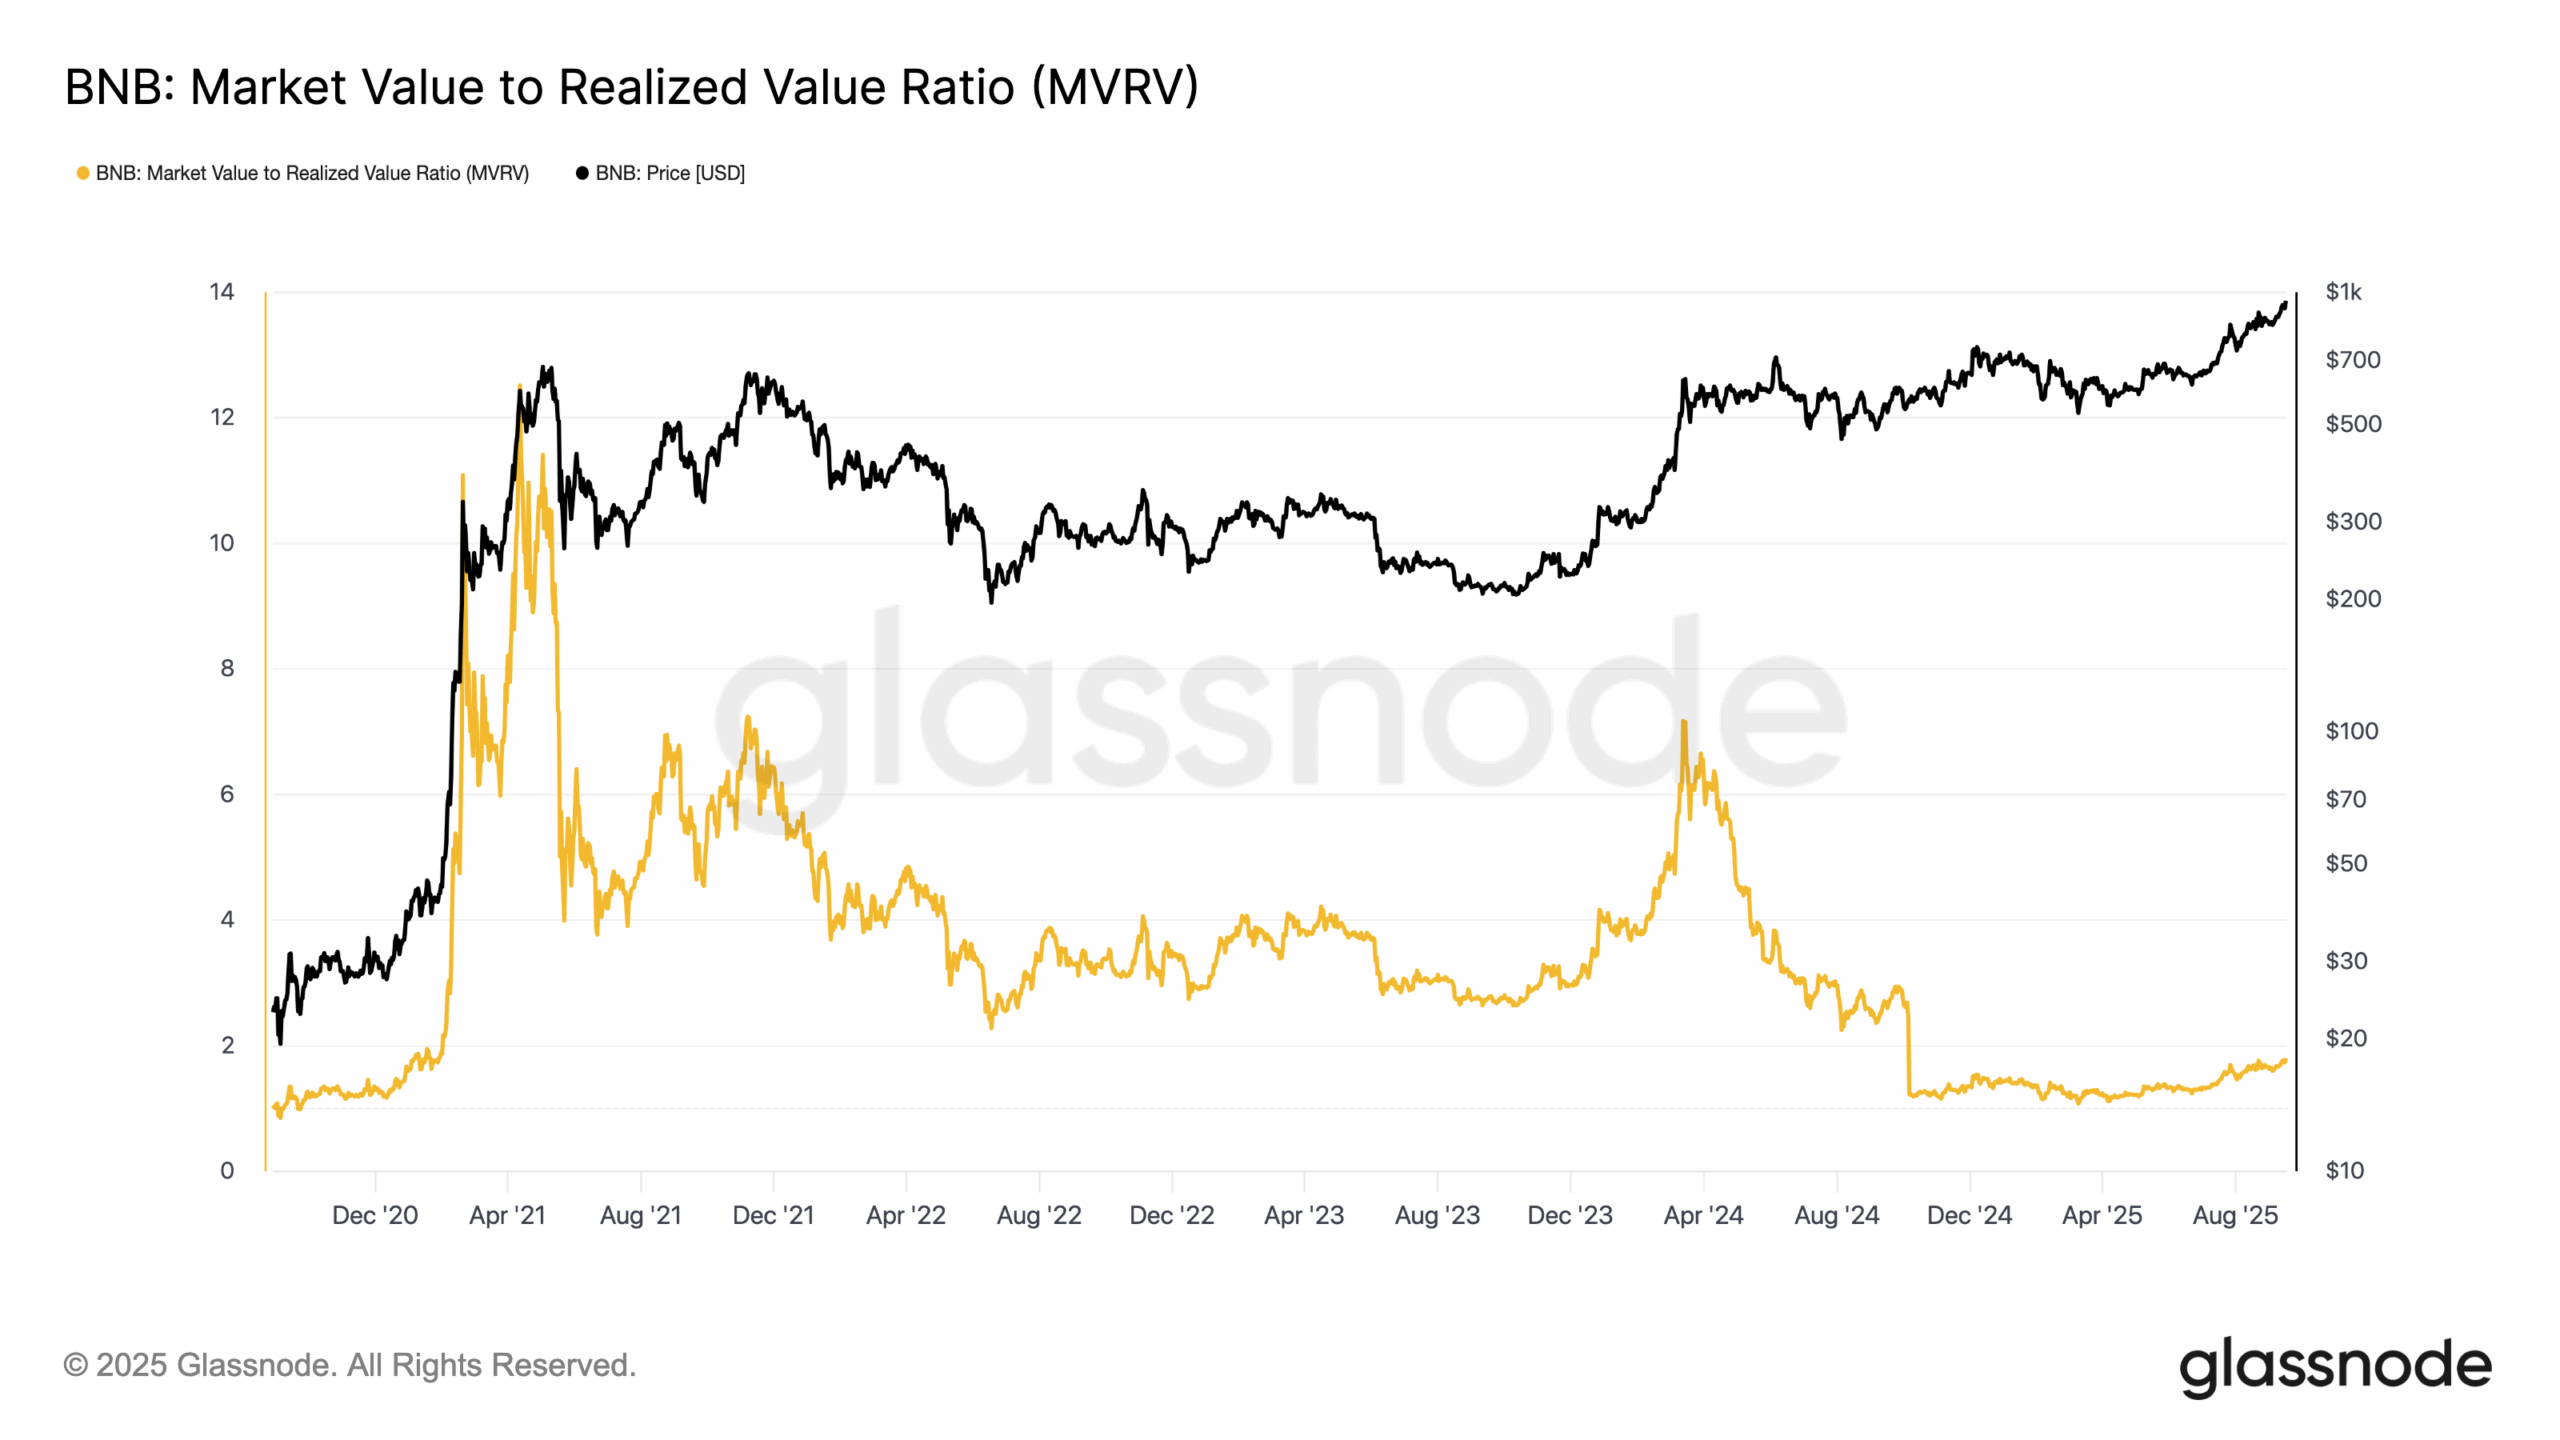
In addition, BNB’s Market Value to Realized Value (MVRV) ratio currently stands at 1.80. This metric compares the token’s market price to the average cost basis of all holders.
Historically, BNB’s price peaks when the MVRV ratio climbs into the 2.88 and 7.17 range.
Furthermore, at the current level of 1.80, the data suggests room for further upside before conditions approach the historical “danger zone” where profit-taking typically sparks corrections.
BNB Price Prediction: Higher
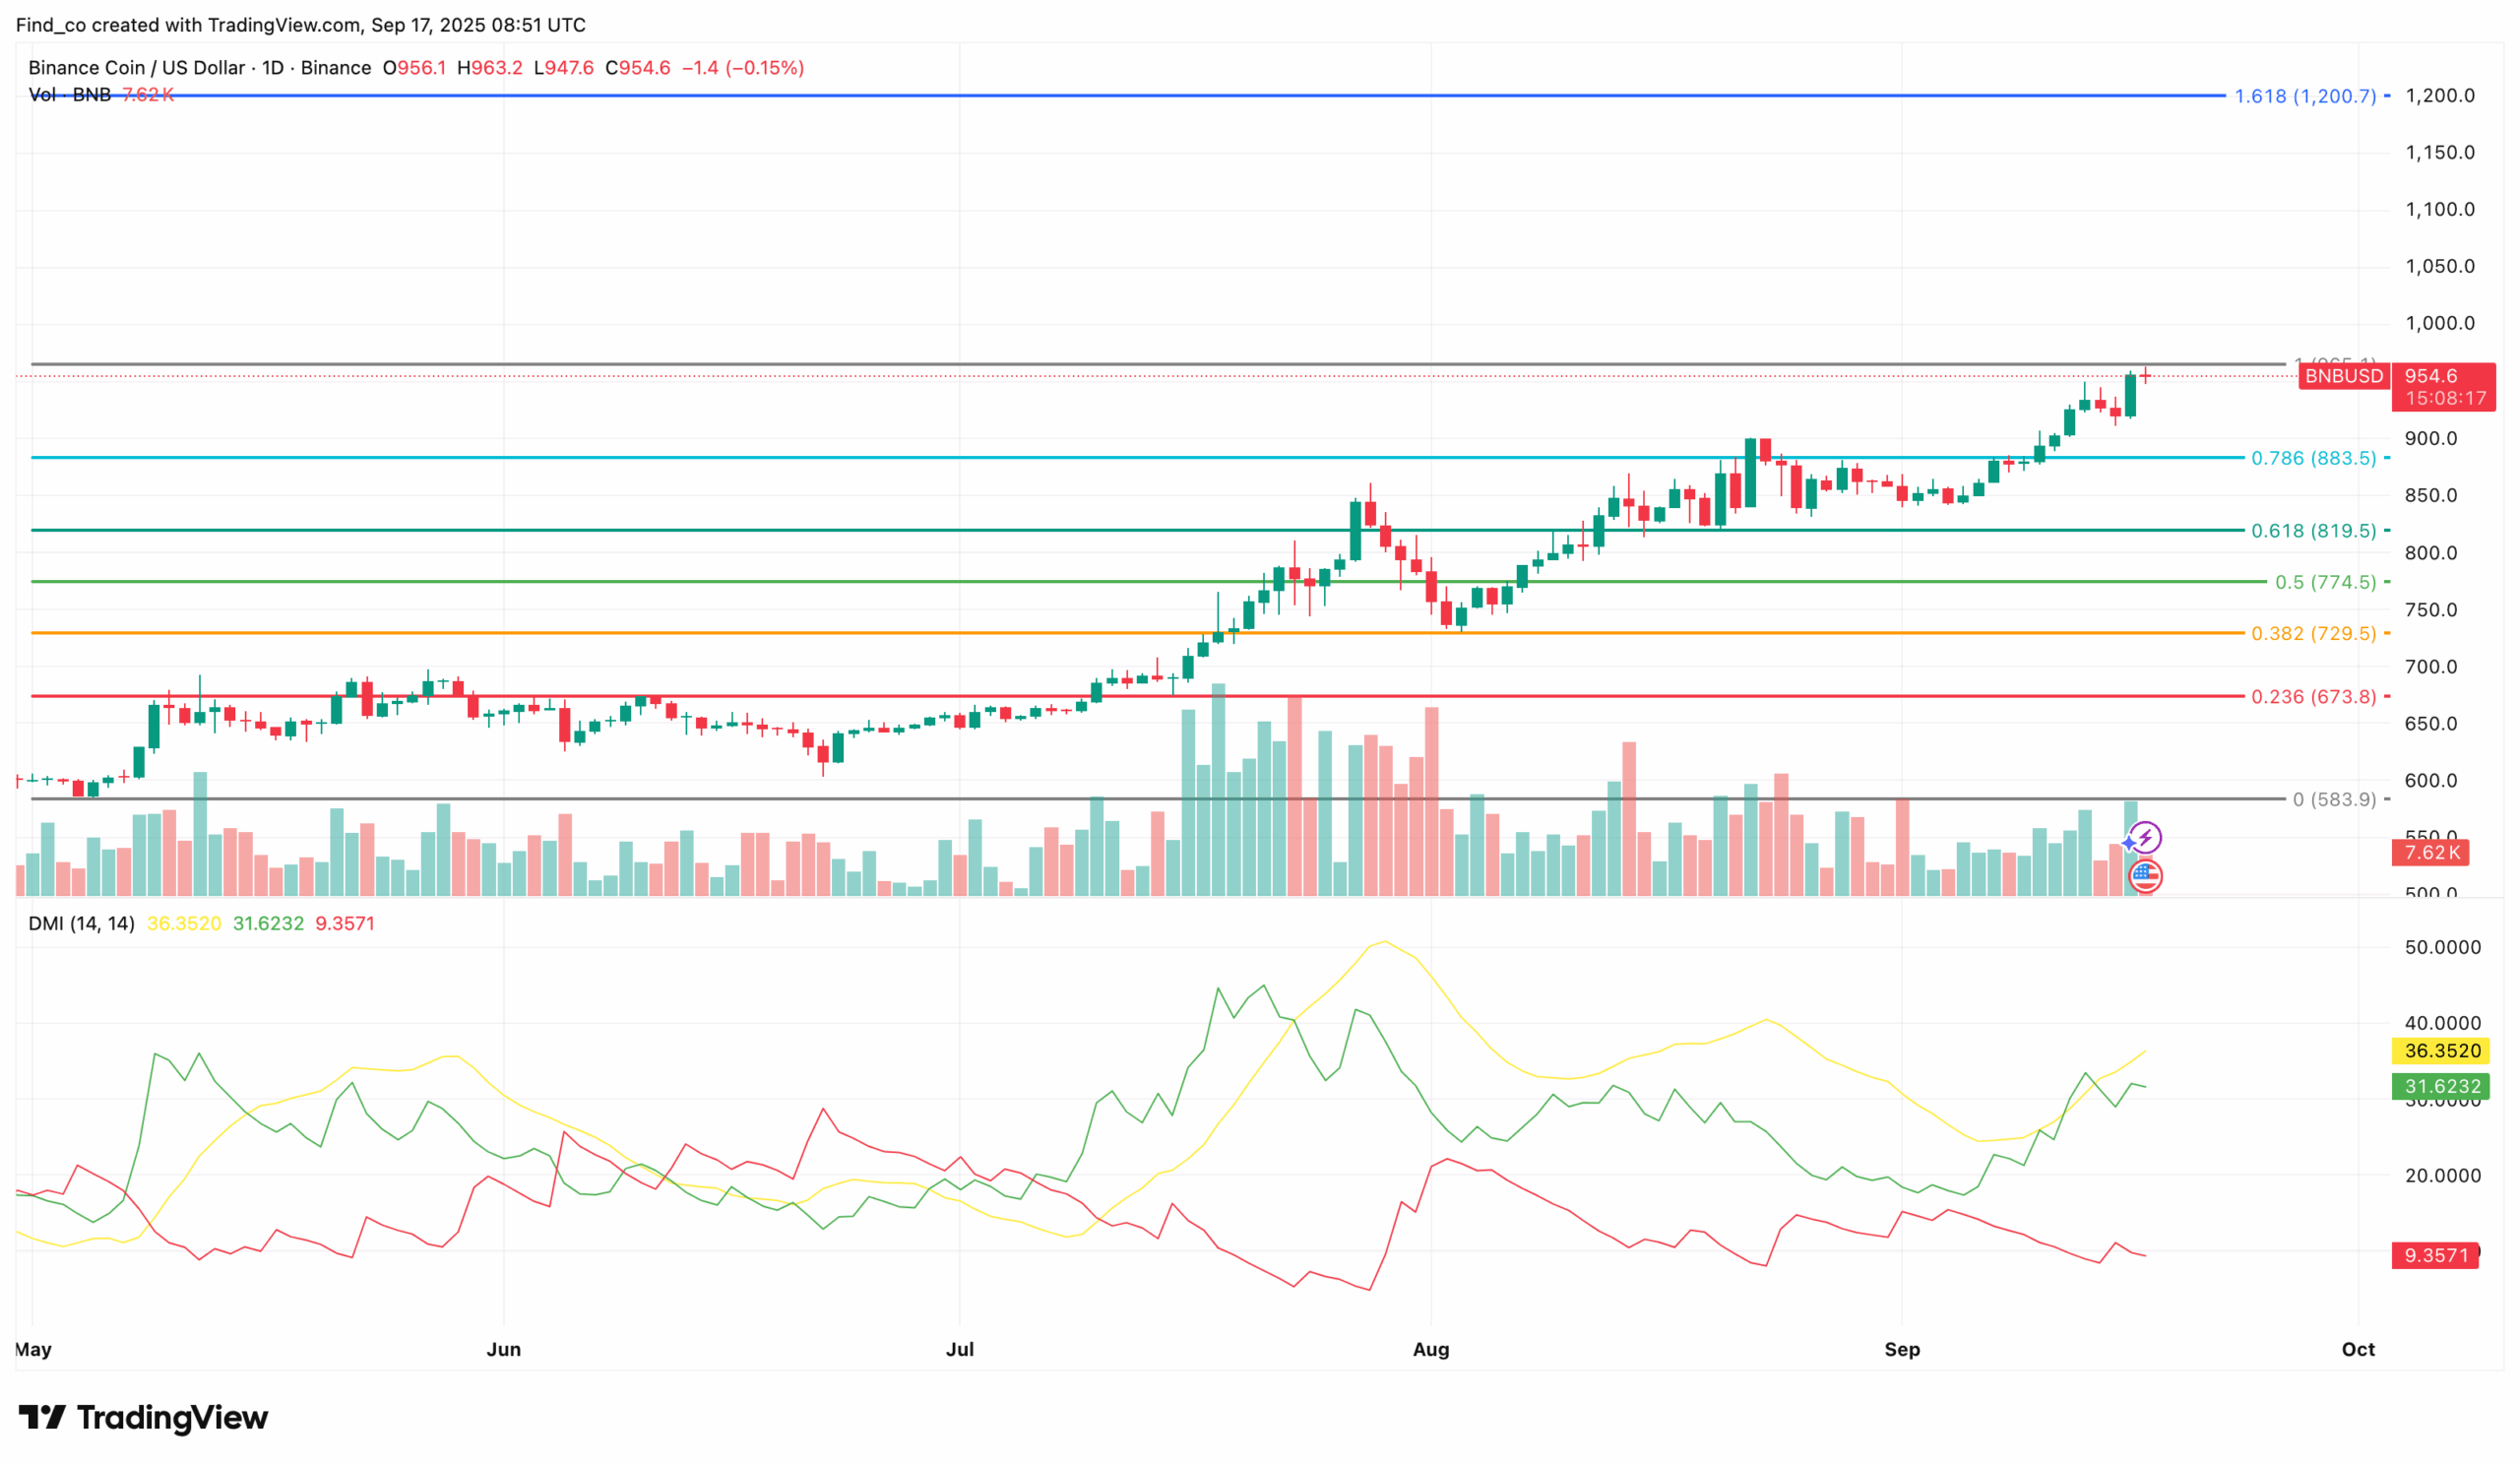
On the daily chart, BNB’s price trades within an ascending triangle, a pattern that signals continuation of an uptrend. Amid this structure, the Directional Movement Index (DMI) flashes bullish signals.
At press time, the +DMI (green) stands at 31.62, clearly outpacing the –DMI (red) at 9.35, which confirms that buyers are firmly in control.
Moreover, the Average Directional Index (ADX) has climbed to 36.35, showing that the trend is solid.
If the current trend holds, BNB’s next target could be $1,200.70. With a Fed rate cut, the move could materialize even faster.
However, if the FOMC decides to hike rates or leave them unchanged, the bullish setup may stall. In that case, BNB’s price could retrace toward $883.50
Disclaimer:
The information provided in this article is for informational purposes only. It is not intended to be, nor should it be construed as, financial advice. We do not make any warranties regarding the completeness, reliability, or accuracy of this information. All investments involve risk, and past performance does not guarantee future results. We recommend consulting a financial advisor before making any investment decisions.
Victor Olanrewaju is a crypto analyst and reporter at CCN with deep roots in on-chain research and technical analysis. His crypto journey began in 2017, but it was the 2020 Uniswap airdrop that sparked a full-time pivot into the space.
With a foundation in copywriting, Victor honed his craft creating high-converting content for leading crypto brokers — most notably an XRP price prediction that ranked #1 on Google during the 2021 bull run.
He later joined AMBCrypto in 2022, where he combined storytelling with technical and on-chain analysis to cover key market narratives.
In 2024, he expanded his expertise at BeInCrypto, collaborating with analysts and using tools like Glassnode, Santiment, and IntoTheBlock to break down Bitcoin and altcoin trends.
At CCN, Victor covers the top cryptocurrencies, memecoins, macro shifts, blending real-time insights with deep-dive metrics.
He holds a Bachelor’s degree in Physics from the University of Ibadan, equipping him to simplify complex data for a wide audience. Follow his work or connect on LinkedIn or X.