When Will Altseason Begin? | Credit : Getty Images
Share
Key Takeaways
The Bitcoin Dominance Rate has traded inside resistance for the past six months.
The ETH/BTC pair has fallen during this period but shows signs of a potential reversal.
Will these conditions mark the beginning of this market cycle’s “altseason”?
The Bitcoin Dominance Rate (BTCD) measures the percentage of Bitcoin’s market capitalization relative to the entire cryptocurrency market. Sharp decreases in BTCD bring about what is known as “altseason”, a period in which altcoins provide remarkable returns.
BTCD has remained fairly stagnant inside resistance for the past six months. However, with ETH/BTC reaching a long-term support level holding for nearly three years, traders are eagerly anticipating if this will mark the beginning of an altseason.
BTCD Floats Inside Resistance
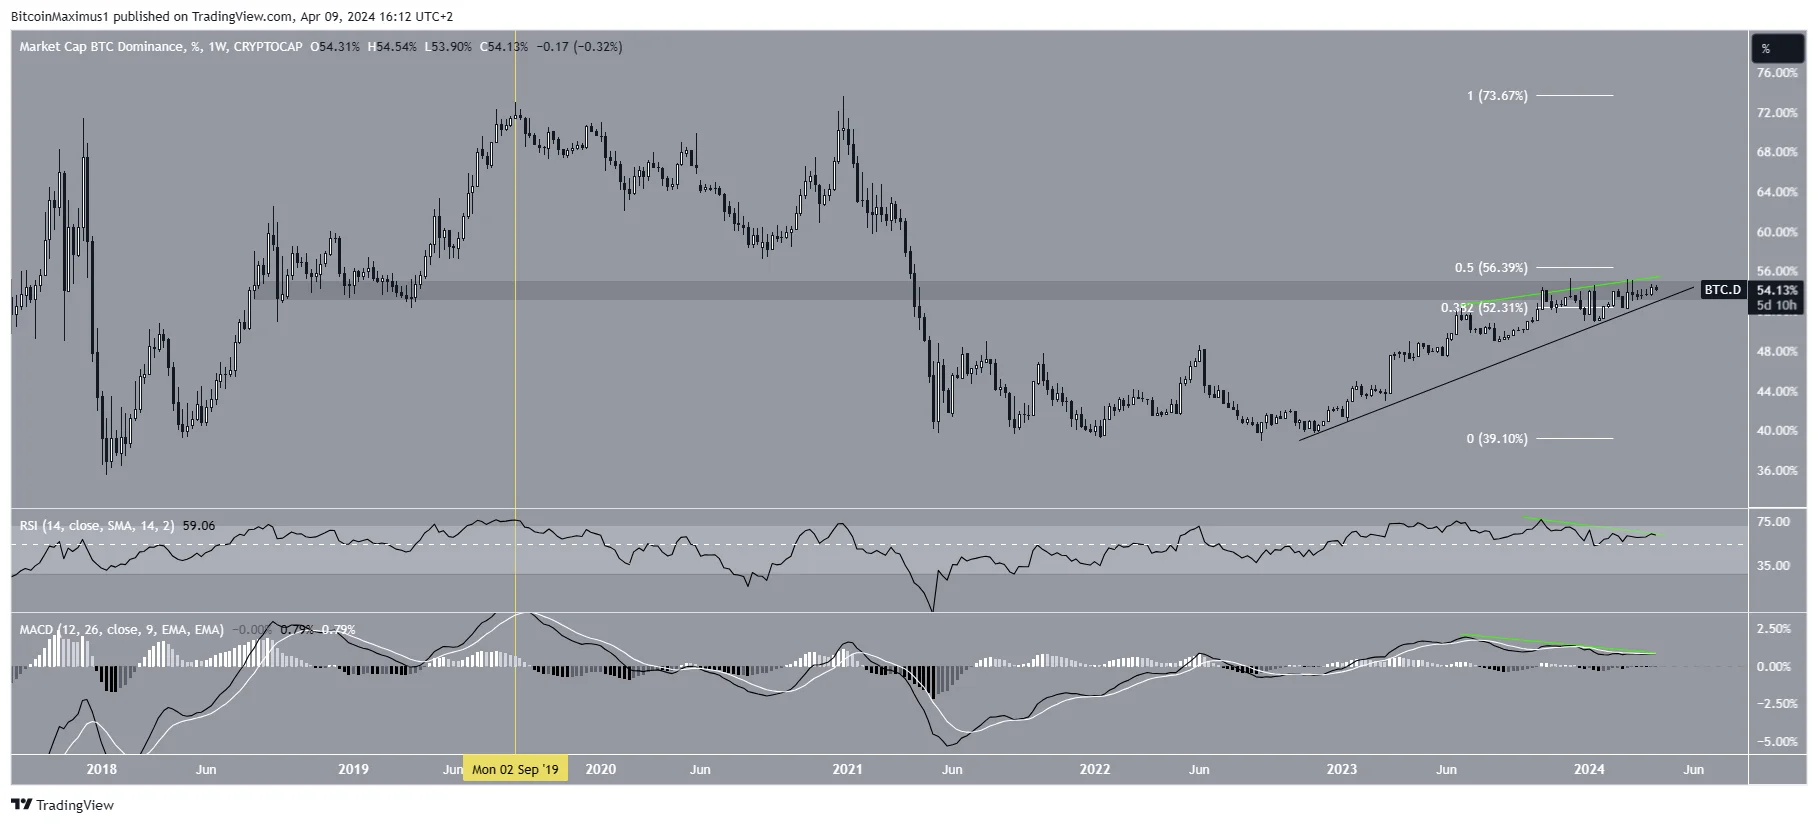
BTCD has increased since September 2022, when it was at a low of 38.84%. The increase followed an ascending support trend line, taking BTCD inside the 54% horizontal and Fib resistance area. It has traded inside this resistance since October 2023, making numerous unsuccessful breakout attempts.
Interestingly, both the MACD and RSI have generated bearish divergences (green lines), considered signs of weakness. The RSI started to generate a bearish divergence once it first moved into overbought territory in October 2023, while the MACD has been doing so since June.
BTCD Weekly Chart | Credit: TradingView
In the 2018-2021 cycle, the first RSI cross into overbought territory (yellow) marked the absolute BTCD high of 73%. On the other hand, the weekly MACD has never generated any bearish divergence, so it is currently in unprecedented territory.
So, going by these readings, it seems that BTCD is due for a significant drop in the near future.
Relation to Ethereum
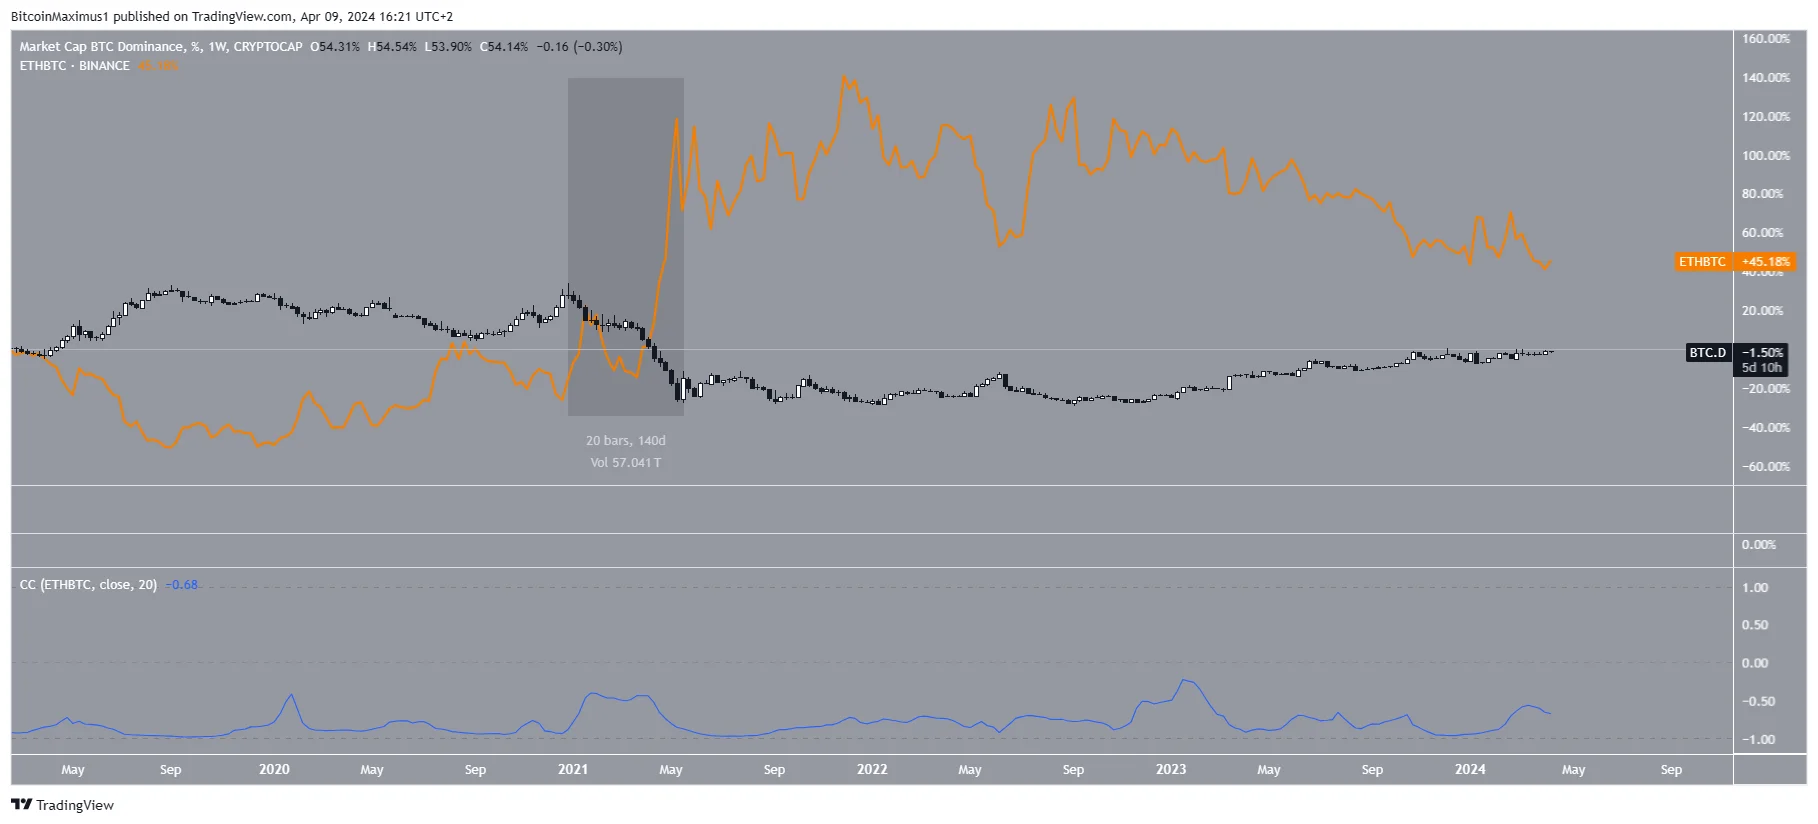
Since Ethereum is the largest altcoin, the ETH price movement relative to BTC greatly affects BTCD. This can be seen by the correlation coefficient indicator (blue), which has always given a negative value for the pairs.
A negative reading indicates that an ETH/BTC (orange) price increase causes a decrease in BTCD and vice versa. The correlation has also been perfectly negative at -1.0 for an extended period of time.
Custom Weekly Chart | Credit: TradingView
The sharpest fall in BTCD, which occurred between December 2020 to May 2021 coincided with a significant rise in the ETH/BTC pair. So, the underperformance of the latter is the main cause for BTCD not falling yet.
In any case, while the weekly time frame readings for BTCD are bearish, it is worth looking at the same time frame outlook for ETH/BTC, to see if it confirms the prediction.
When Will Altseason Begin?
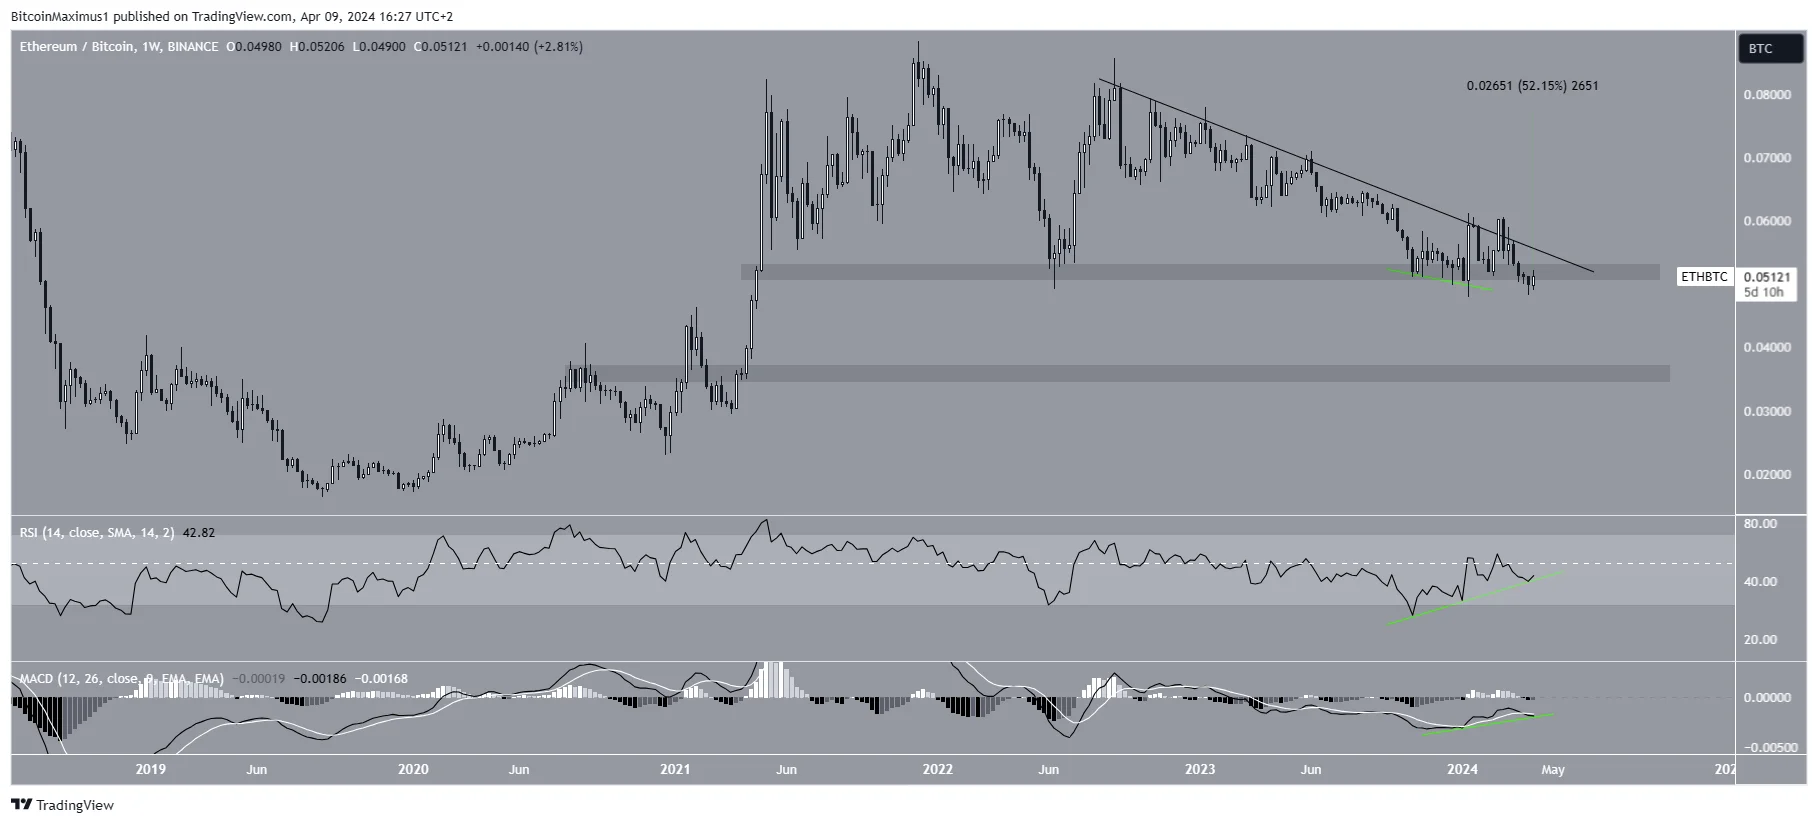
The weekly time frame outlook for ETH/BTC aligns with the bearish one for BTCD. This is because of the marked bullish divergences (green) in the MACD and RSI. Such pronounced divergences often lead to a bullish trend reversal.
ETH/BTC Weekly Chart | Credit: TradingView
Even though ETH/BTC has fallen below its main horizontal support at ₿0.052, the multiple bullish divergences suggest the price will soon reclaim the area, leading to a significant upward movement. If the previous relationship holds, this will result in a BTCD decrease and the beginning of altseason.
An ETH/BTC breakout from the descending resistance trend line will confirm this possibility.
Altseason Around the Corner
The beginning of altseason has historically been marked by a sharp fall in BTCD, which is often caused by an increase in the ETH/BTC pair. Presently, the long-term readings for BTCD suggest a drop is incoming, while the opposite is true for ETH/BTC. So, conditions are ripe for the start of this cycle’s altseason.
Valdrin Tahiri is a cryptocurrency analyst and reporter at CCN, specializing in technical analysis with a focus on Elliott Wave theory, on-chain metrics, and fundamental research. He brings over seven years of experience in the crypto space as both a trader and writer.
He discovered cryptocurrencies in 2017 while earning his MSc in Financial Markets at the Barcelona School of Economics, which sparked a deep interest in blockchain and market dynamics. Since then, he’s contributed to top crypto outlets like BeInCrypto and CoinGape.
Valdrin also served as Community Manager of BeInCrypto’s Telegram group for three years, helping grow it into one of the largest crypto communities worldwide. His expertise in market structure and price patterns allows him to break down complex trends into clear, actionable insights.
He’s published thousands of articles covering altcoins, Bitcoin cycles, and macro trends.