BUILDon (B) is up nearly 100% in May, but overbought signals and weak on-chain data point to a pullback. | credit: CCN
Share
Key Takeaways
BUILDon (B) has surged over 50% in 24 hours and nearly 100% since May 1, as speculative capital rotates into memecoins.
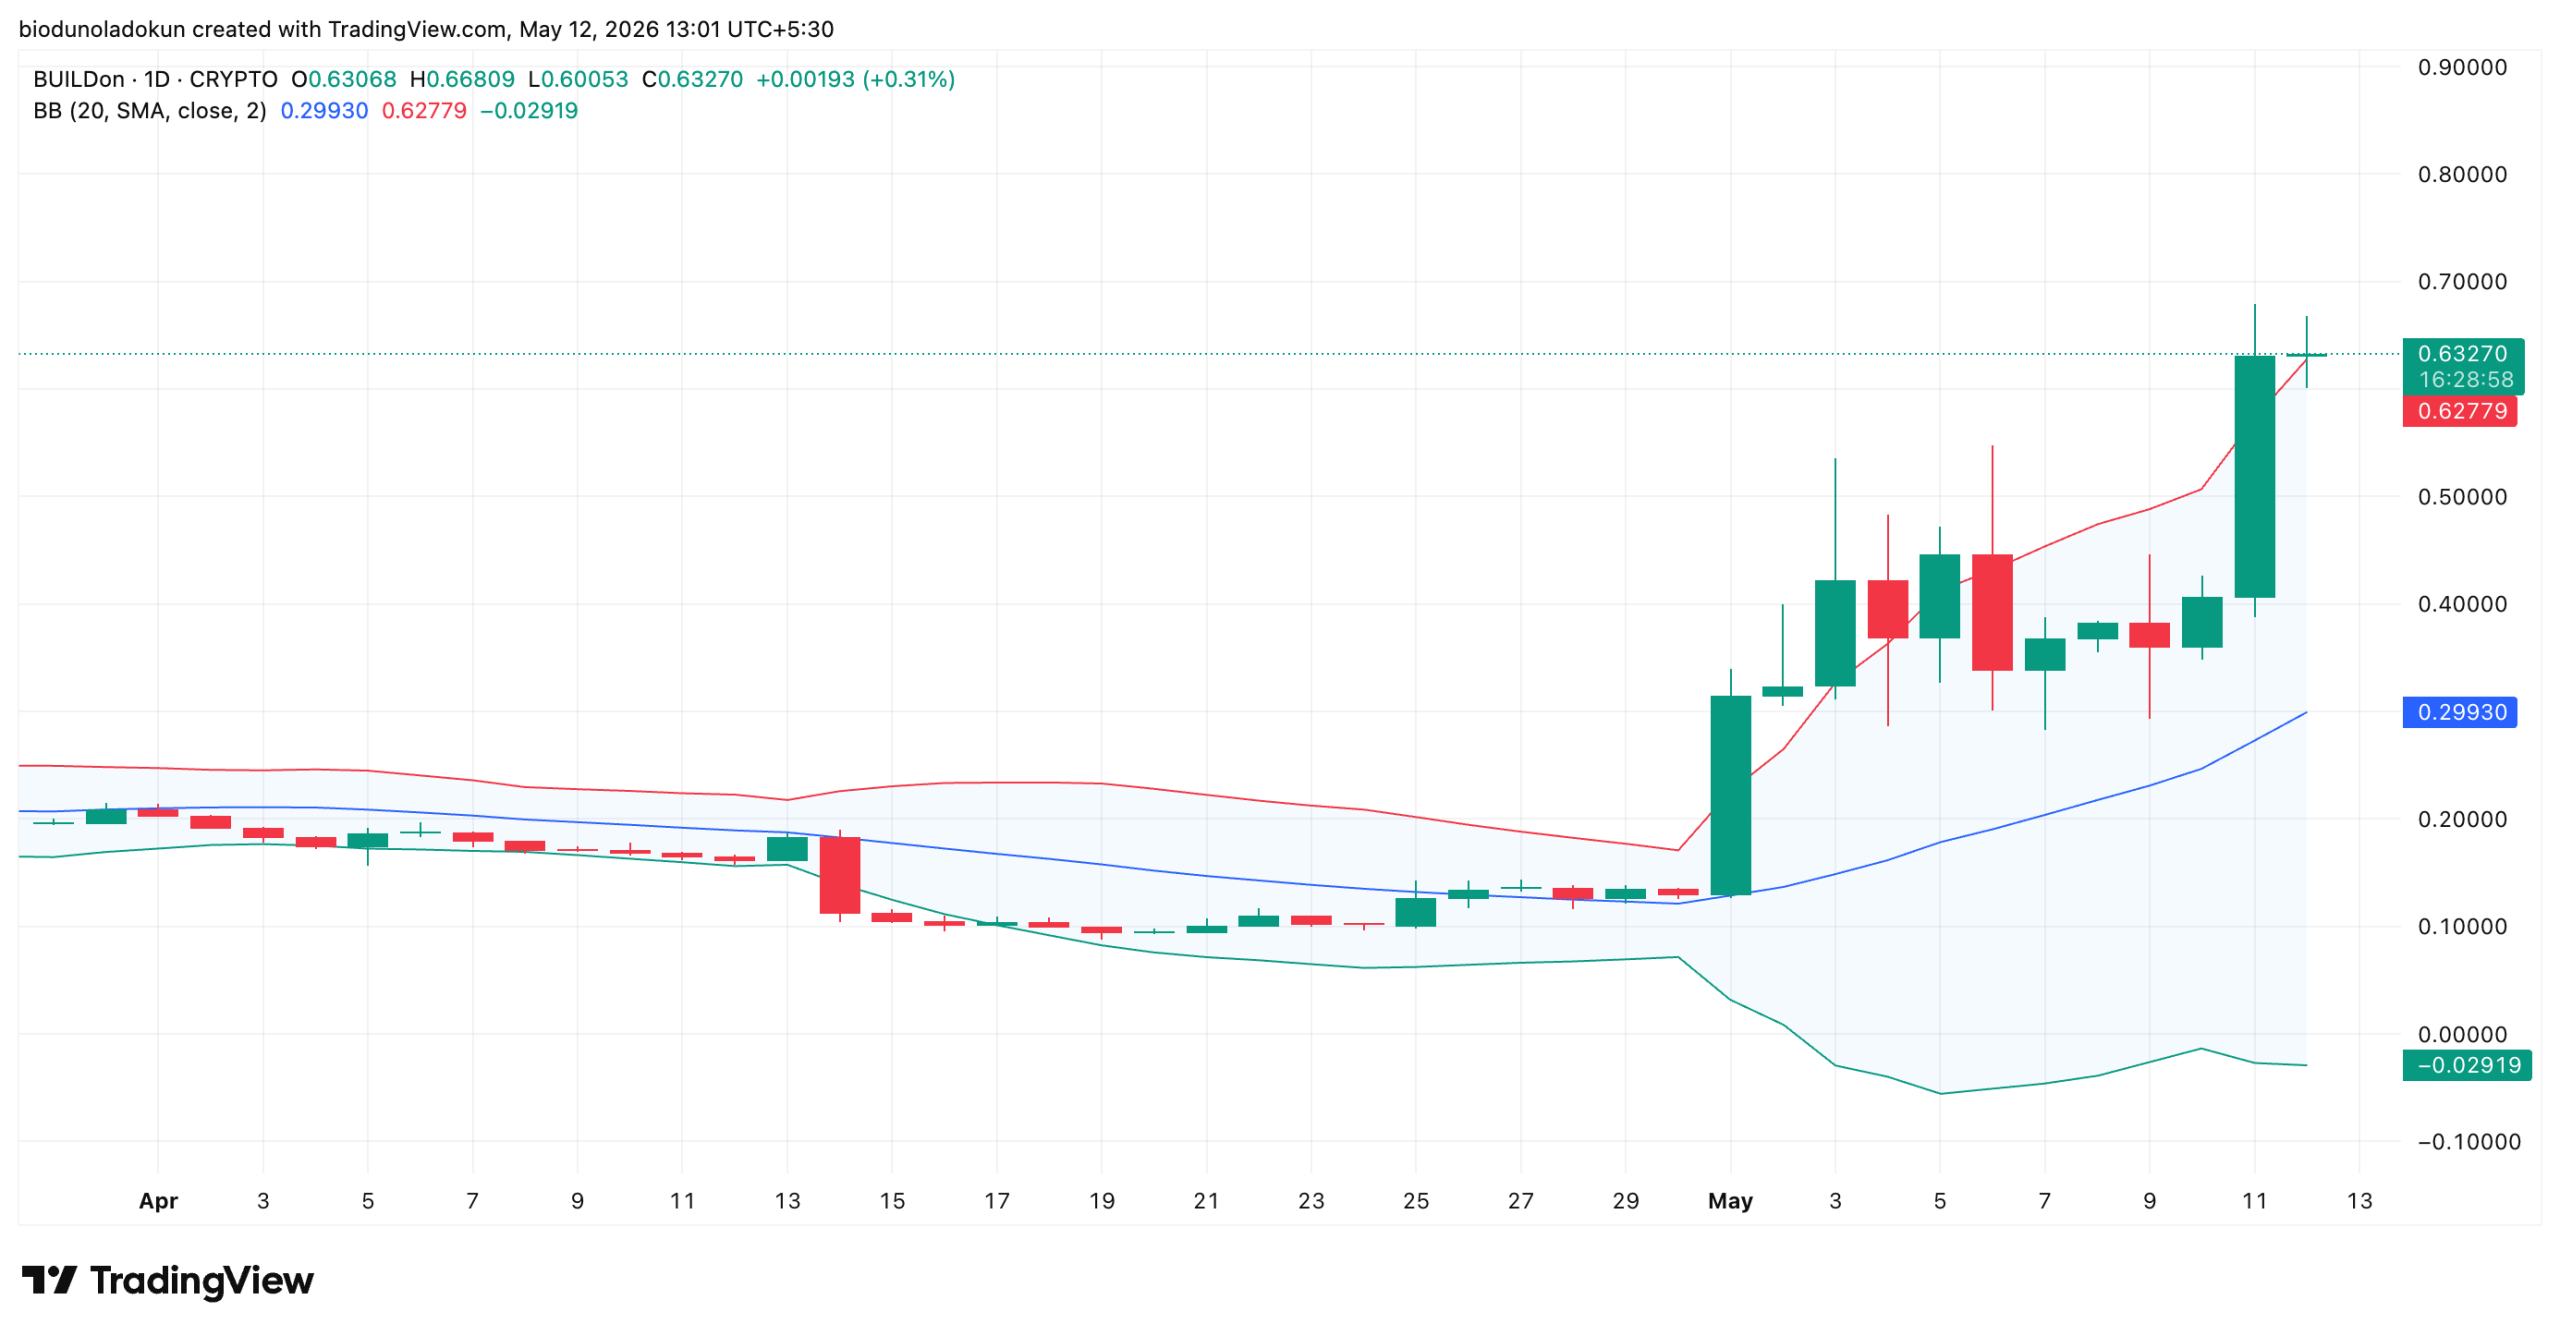
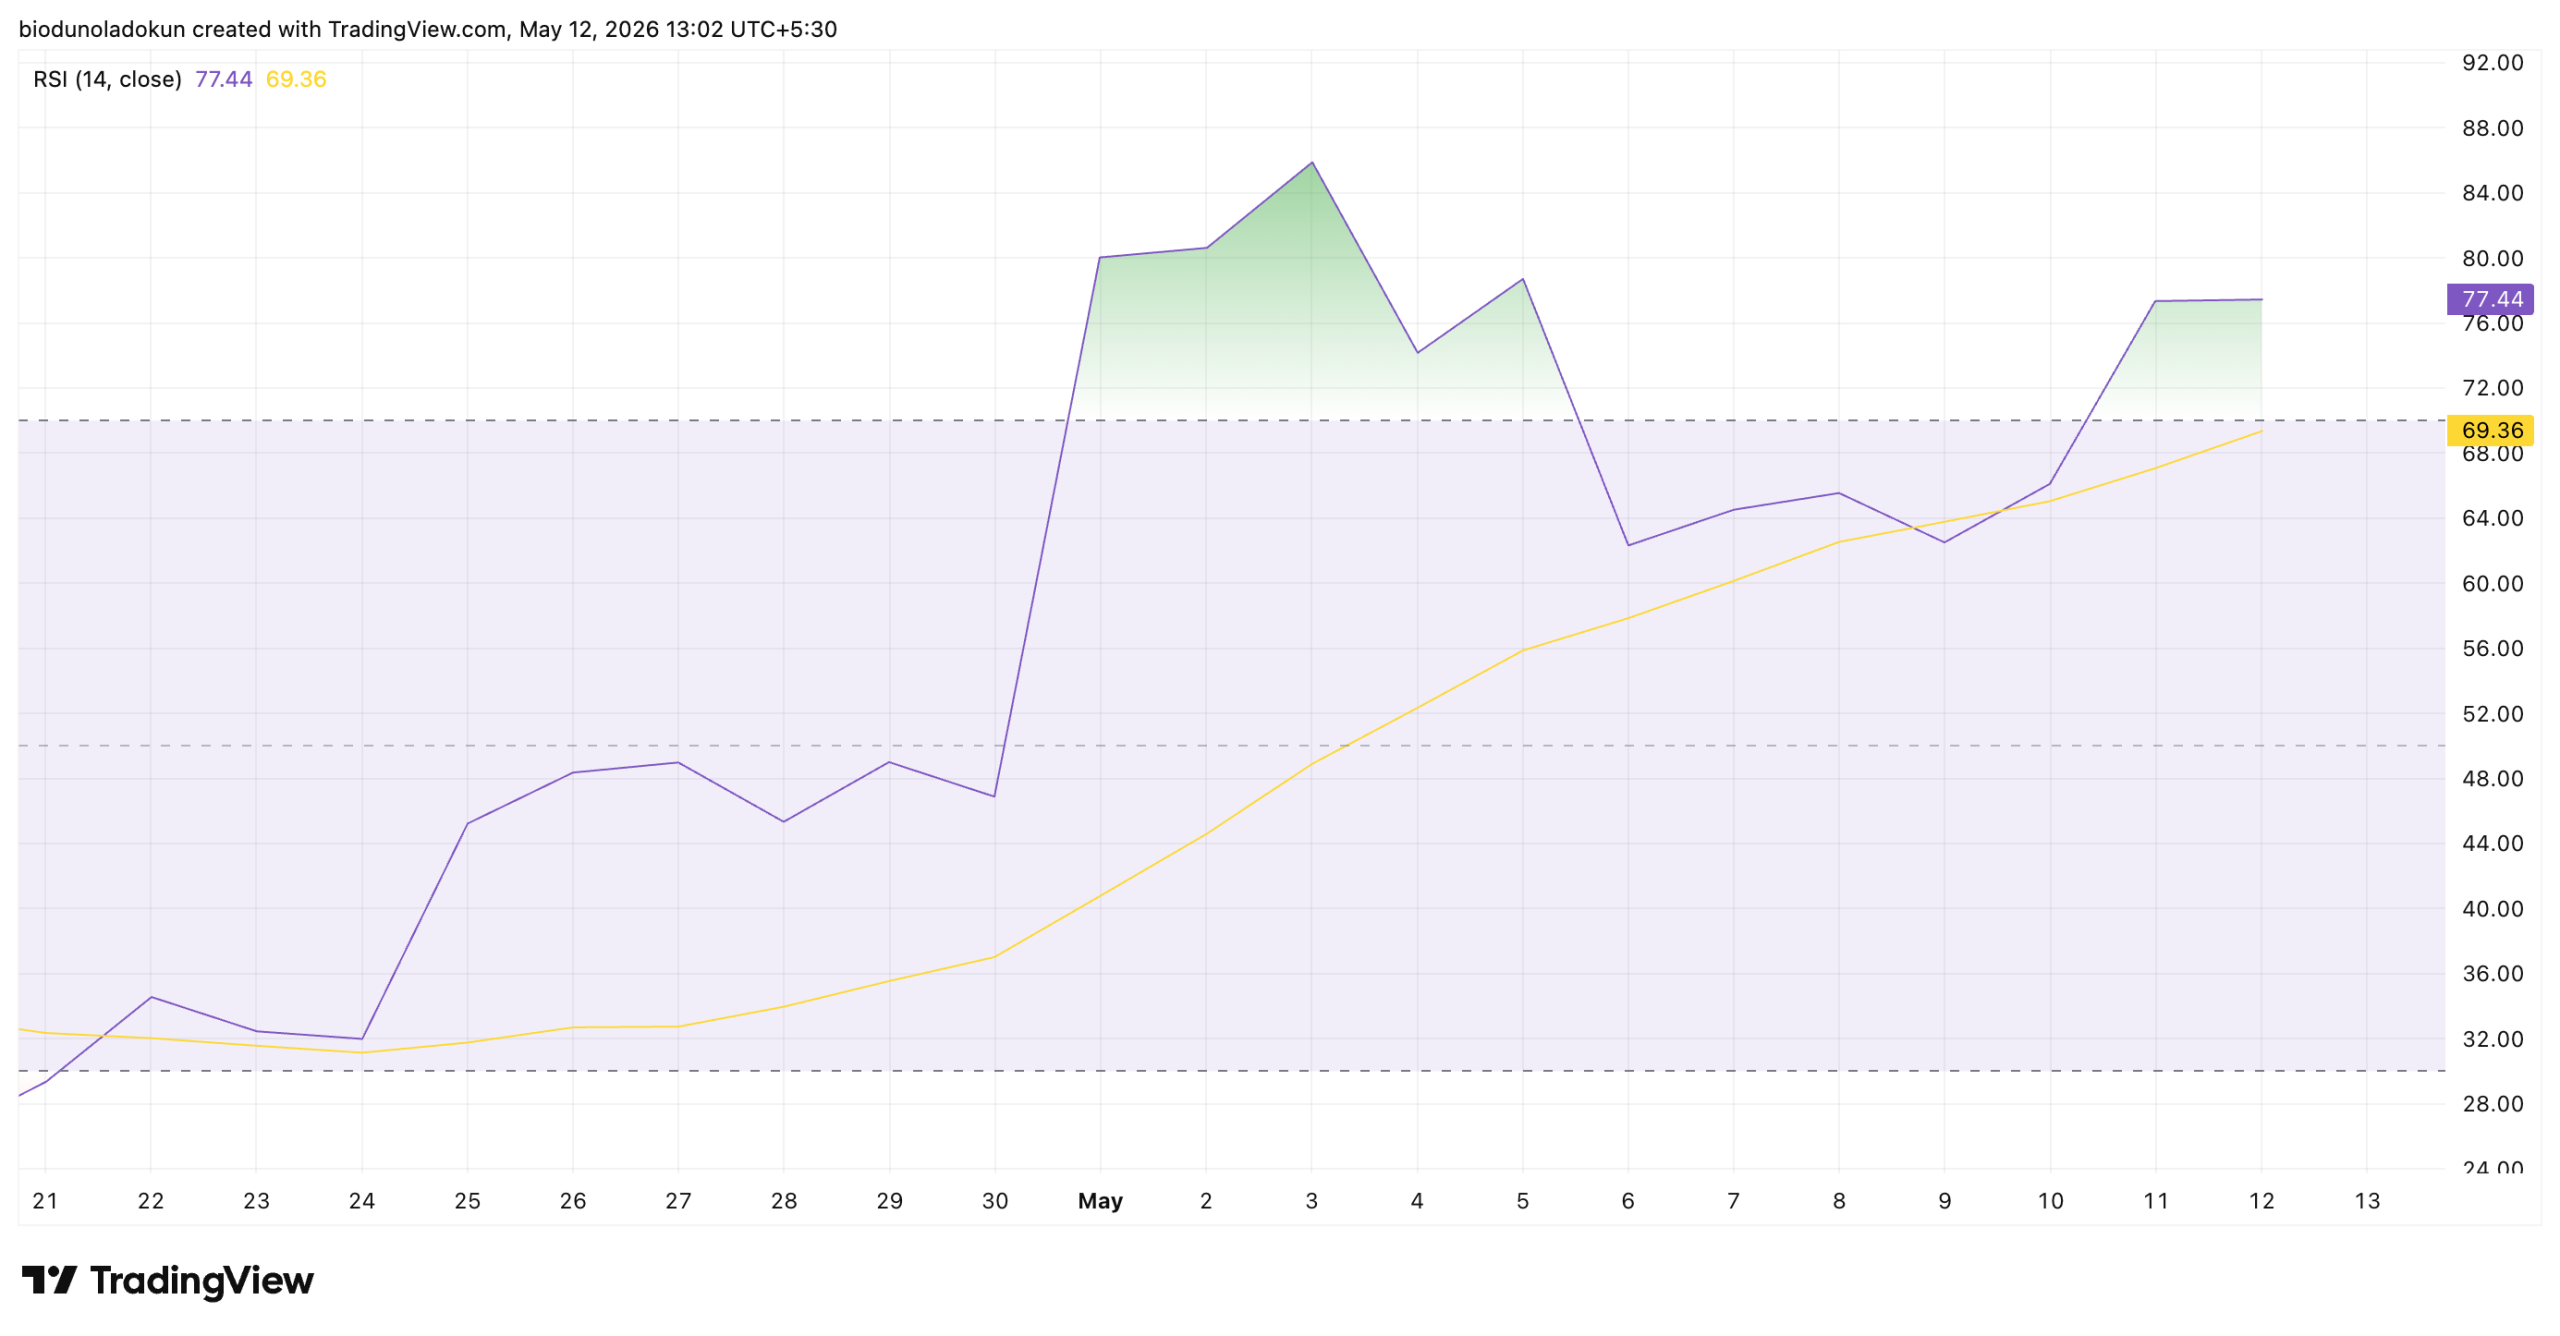
Technical indicators are flashing exhaustion signals as B trades above its upper Bollinger Band, and RSI sits deep in overbought territory.
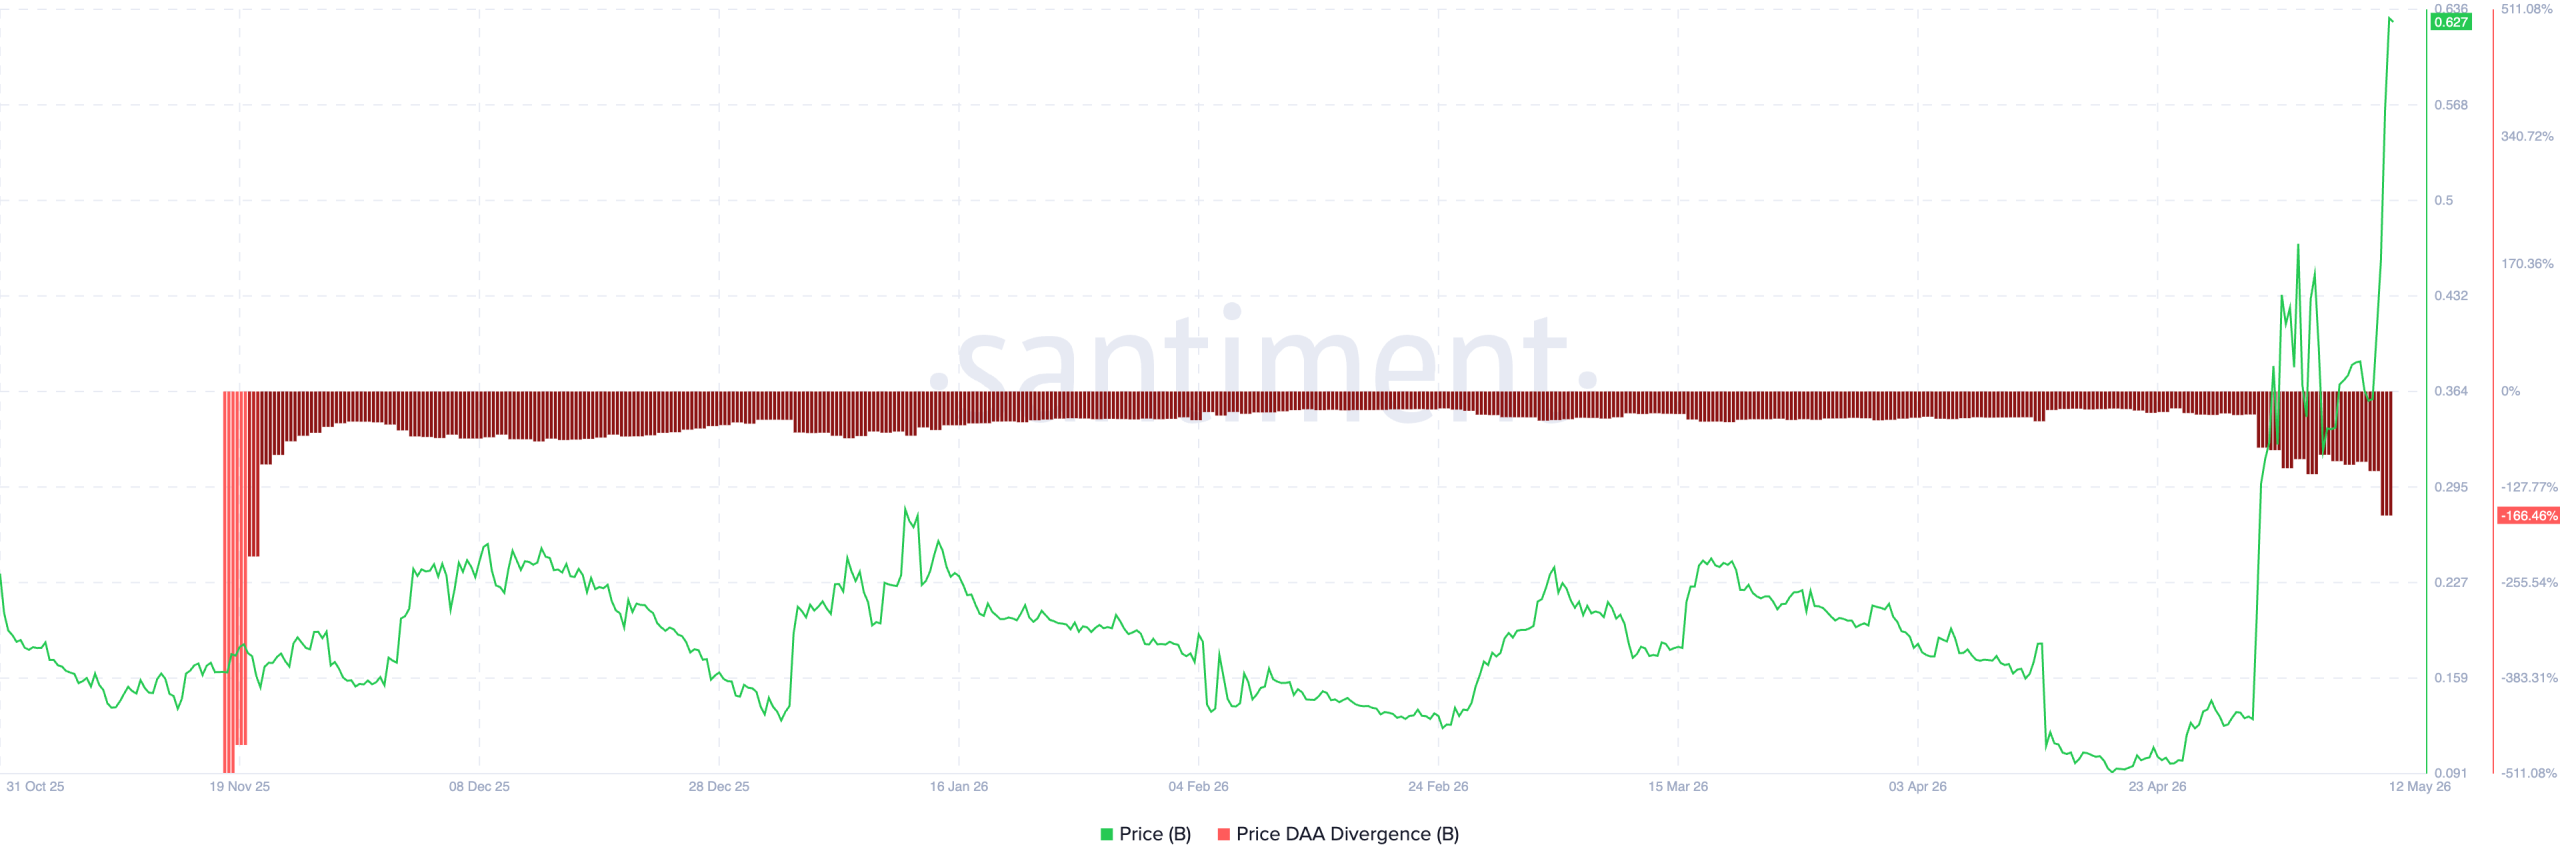
B’s Price DAA Divergence stands at -166.46%, indicating the rally is being driven by speculative flows rather than genuine network growth.
BNB Chain-based token BUILDon (B) is today’s top gainer as demand for memecoins continues to rocket across the cryptocurrency market.
The token has extended a sharp climb that began at the start of the month, climbing nearly 100% over the past 11 sessions.
However, warning signals across both on-chain data and technical charts now suggest the buy-side momentum may be waning, potentially opening the door to a sharp reversal in B’s price.
Try Our Recommended Crypto Exchanges
Sponsored
Disclosure
We sometimes use affiliate links in our content, when clicking on those we might receive a commission at no extra cost to you. By using this website you agree to our terms and conditions and privacy policy.
Today’s move forms part of an extended rally that BUILDon has been on since May 1.
Over the past 24 hours alone, B is up more than 50%, outperforming a broader crypto market that has remained largely flat.
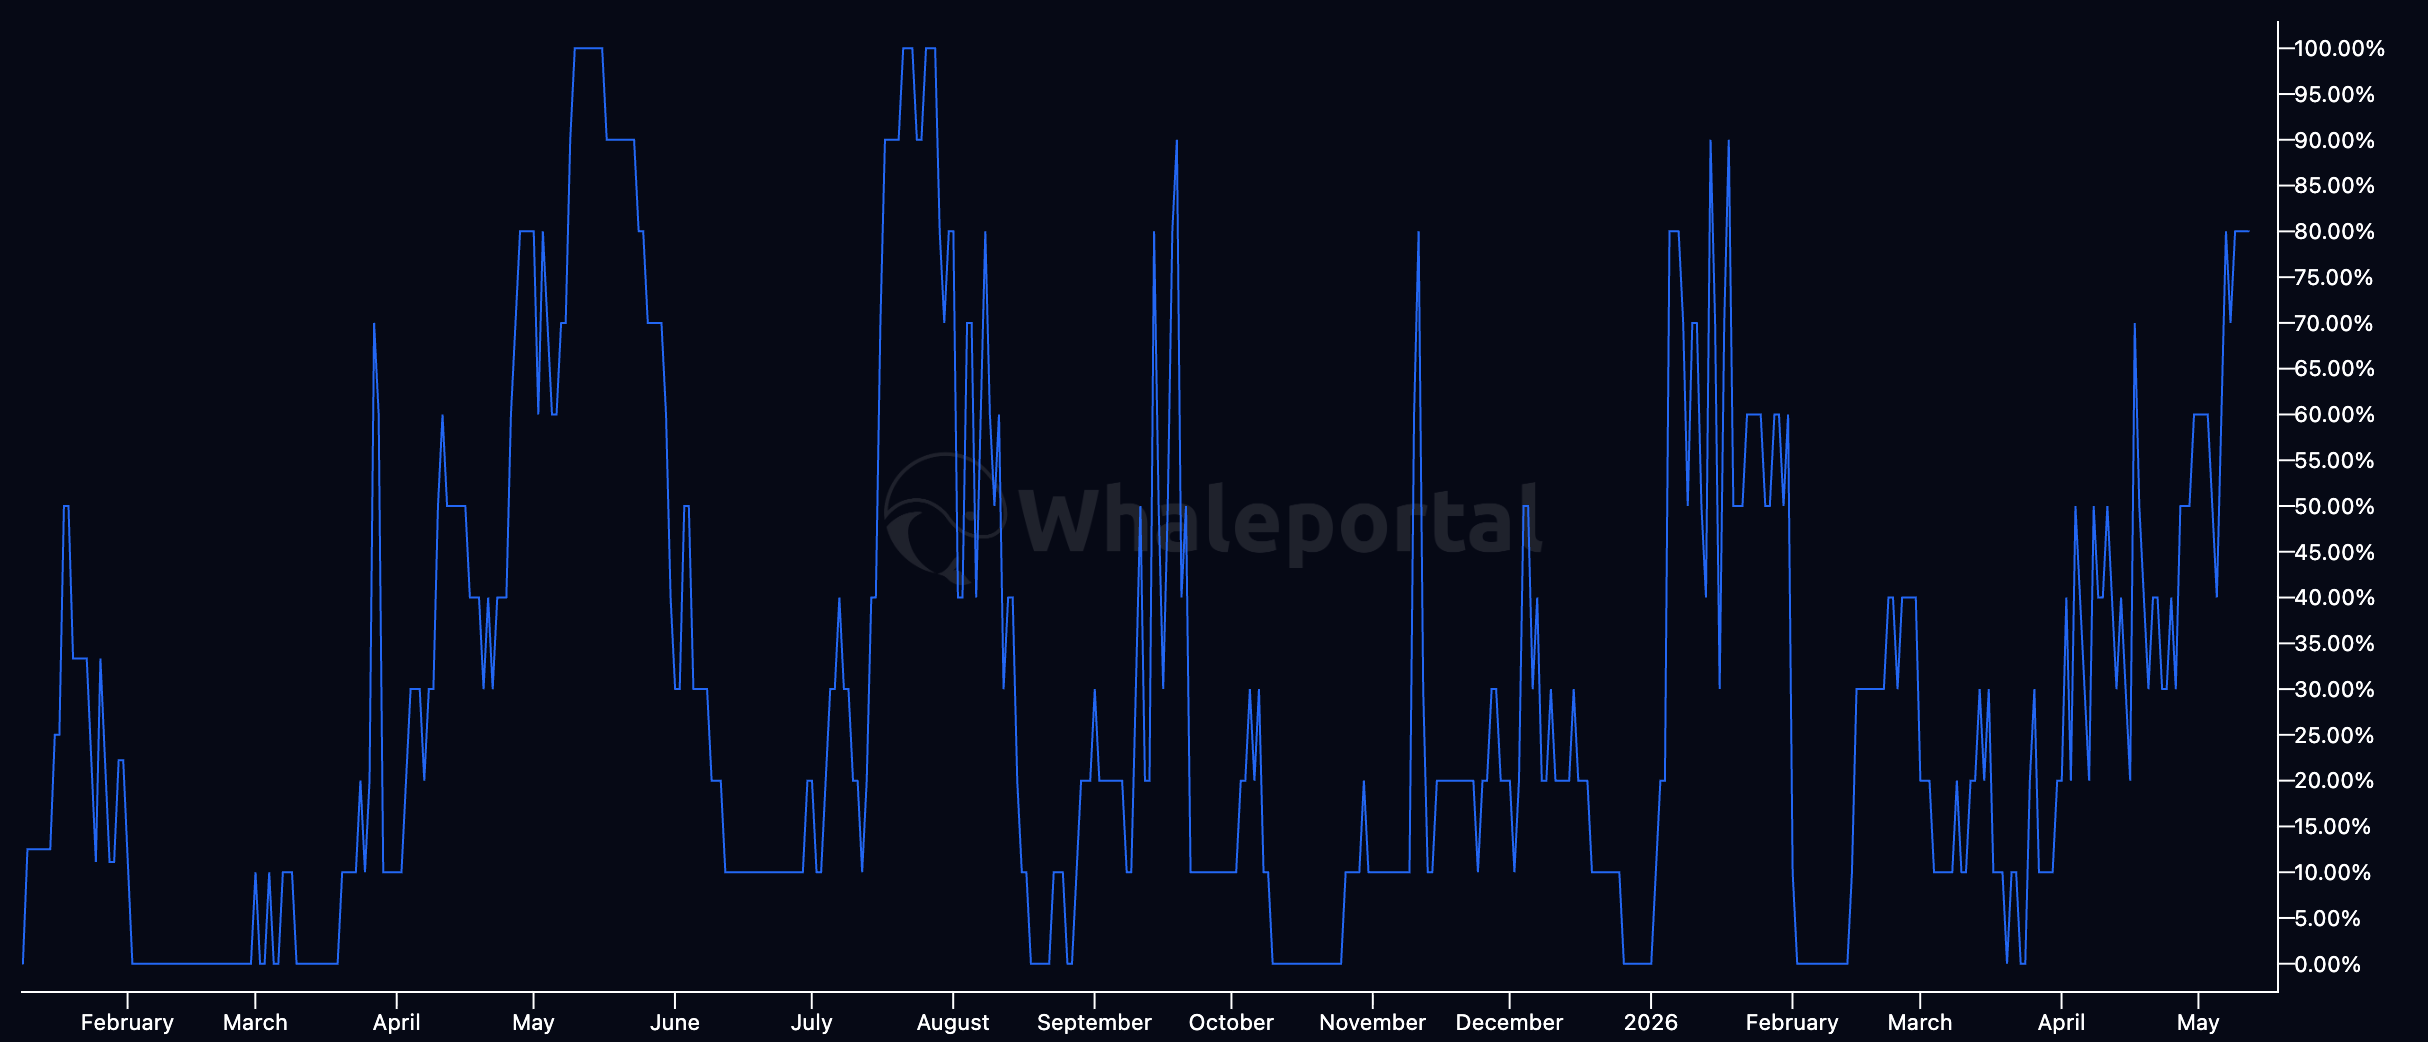
The surge comes amid a broader uptick in attention toward the memecoin sector — a shift clearly reflected in the steadily climbing Memecoin Season Index.
At press time, the index stands at 80%. This signals that the market is in a full-blown memecoin mania, with this asset class widely outperforming Bitcoin (BTC).
B Flashes Overbought Signals as Rally Stretches
B’s rally is now approaching a price zone where a pullback becomes increasingly likely, as technical indicators signal spot buyers may be nearing exhaustion.
On the daily chart, the memecoin trades above its upper Bollinger Bands band, a signal that its price is moving significantly away from its statistical mean.
This Bollinger Bands indicator measures an asset’s price volatility and identifies overbought or oversold conditions.
It consists of three lines: a simple moving average (middle band) and two bands (upper and lower) representing standard deviations above and below the moving average.
When price breaks above the upper band, it suggests a spike in volatility as the asset’s current value is moving significantly away from its average.
It also indicates that the asset may be overbought and due for a price correction.
Historically, sustained moves above the upper band tend to precede pullbacks, especially in memecoins where volatility cuts both ways.
Readings from B’s Relative Strength Index (RSI) also confirm that the memecoin is overbought, with the key momentum indicator at 77.44 at press time.
With price stretched above the upper Bollinger Band and RSI at 77.44, the near-term path tilts toward a pullback rather than further upside.
Network Activity Is Not Keeping Pace
According to Santiment data, despite B’s near-100% price surge since the beginning of May, its Price DAA (Daily Active Addresses) Divergence metric has remained negative.
The metric tracks the relationship between a token’s price movement and the growth in its daily active addresses.
A positive reading suggests price action is being supported by a growing base of on-chain participants, a sign of genuine demand.
On the other hand, a negative reading indicates that the price is rising faster than network activity.
When price climbs while this metric remains deep in the red, as is the case with B, it signals that speculative trading flows are driving the rally rather than broad-based user participation.
Historically, this kind of divergence points to underlying weakness beneath a strong price chart and often precedes corrections as short-term momentum fades.
B Price Prediction
As noted above, volatility in memecoins cuts both ways.
So, depending on which side of the market wins out over the coming sessions, B’s price could expand sharply in either direction.
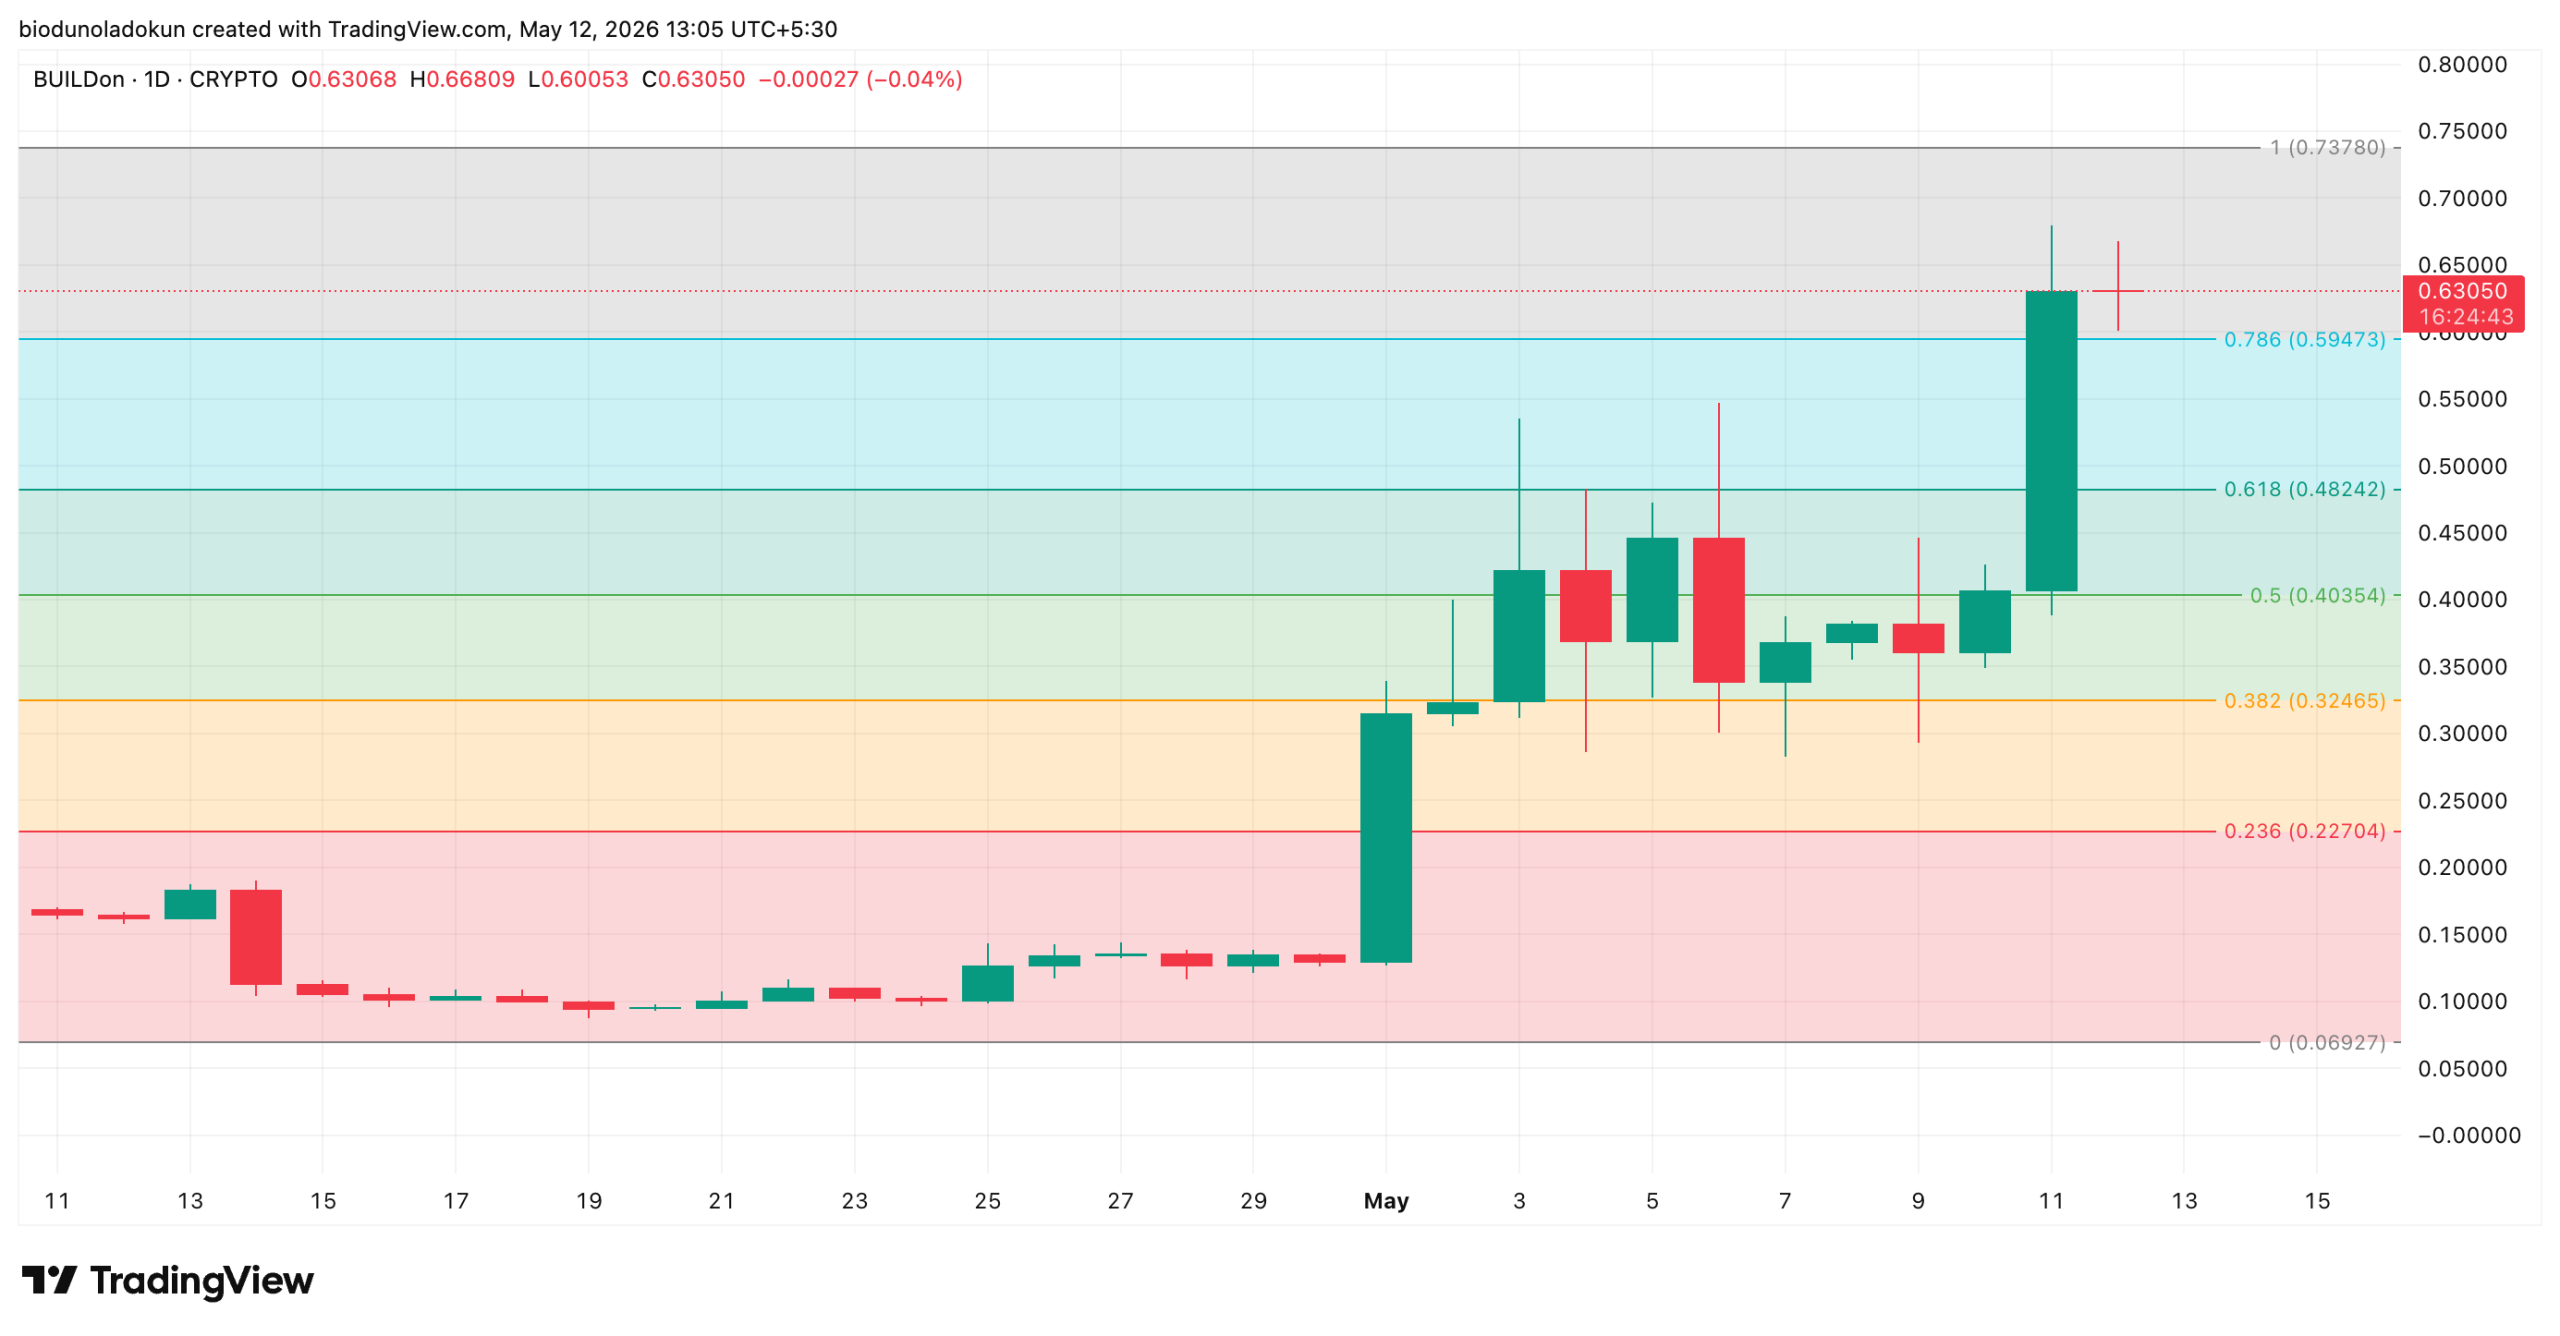
If buyer exhaustion deepens and profit-taking continues, B may shed some of its recent gains.
In that scenario, the first key support to watch is at $0.59, with a deeper flush potentially dragging the price toward $0.48.
However, if B traders continue aggressively bidding the token higher and on-chain divergence narrows, the rally could extend further.
Disclaimer:
The information provided in this article is for informational purposes only. It is not intended to be, nor should it be construed as, financial advice. We do not make any warranties regarding the completeness, reliability, or accuracy of this information. All investments involve risk, and past performance does not guarantee future results. We recommend consulting a financial advisor before making any investment decisions.
Abiodun Oladokun is a Research Analyst at CCN, where he covers cryptocurrency markets with a focus on on-chain analysis, technical assessments, and emerging trends across decentralized finance (DeFi), real-world assets (RWA), artificial intelligence (AI), decentralized physical infrastructure networks (DePIN), Layer 2s, and meme coins.
Prior to CCN, he served as a Senior On-Chain Analyst at BeInCrypto, producing market reports spanning diverse crypto sectors.
Before that, he conducted technical analysis and market assessments of various altcoins at AMBCrypto, where he also contributed long-form quarterly research papers on DeFi, NFTs, DAOs, and scaling architectures, leveraging on-chain platforms including Messari, Santiment, DefiLlama, and Dune Analytics.
He began his crypto career as a research analyst at SixthSense DAO, developing blockchain forensic tools to trace the history of stolen assets.
Abiodun is a lawyer called to the Nigerian Bar and the founder of Ilé Ijó, a Lagos-based electronic dance music collective.














 HANTA Solana Memecoin Explodes 100x as Hantavirus Outbreak Goes Viral: Analyzing the How, Why and What Next