After weeks of pain, Aster finds its footing | Credit: Hameem Sarwar
Share
Key Takeaways
ASTER rebounds, forming an ascending channel on the 2-hour chart.
Indicators show buyers are steadily regaining control from bears.
Here is how a break above $1.30 would confirm a full recovery setup.
After dropping more than 50% from its all-time high, Aster (ASTER) is beginning to show early signs of a potential recovery.
The asset spent several weeks consolidating near local support, but fresh momentum indicators suggest that bullish forces may be regaining control.
Over the last 24 hours, Aster’s price has increased by 6.4%, accompanied by a 162.27% rise in trading volume.
Is ASTER up for a new rebound? Let’s find out.
ASTER Recovers
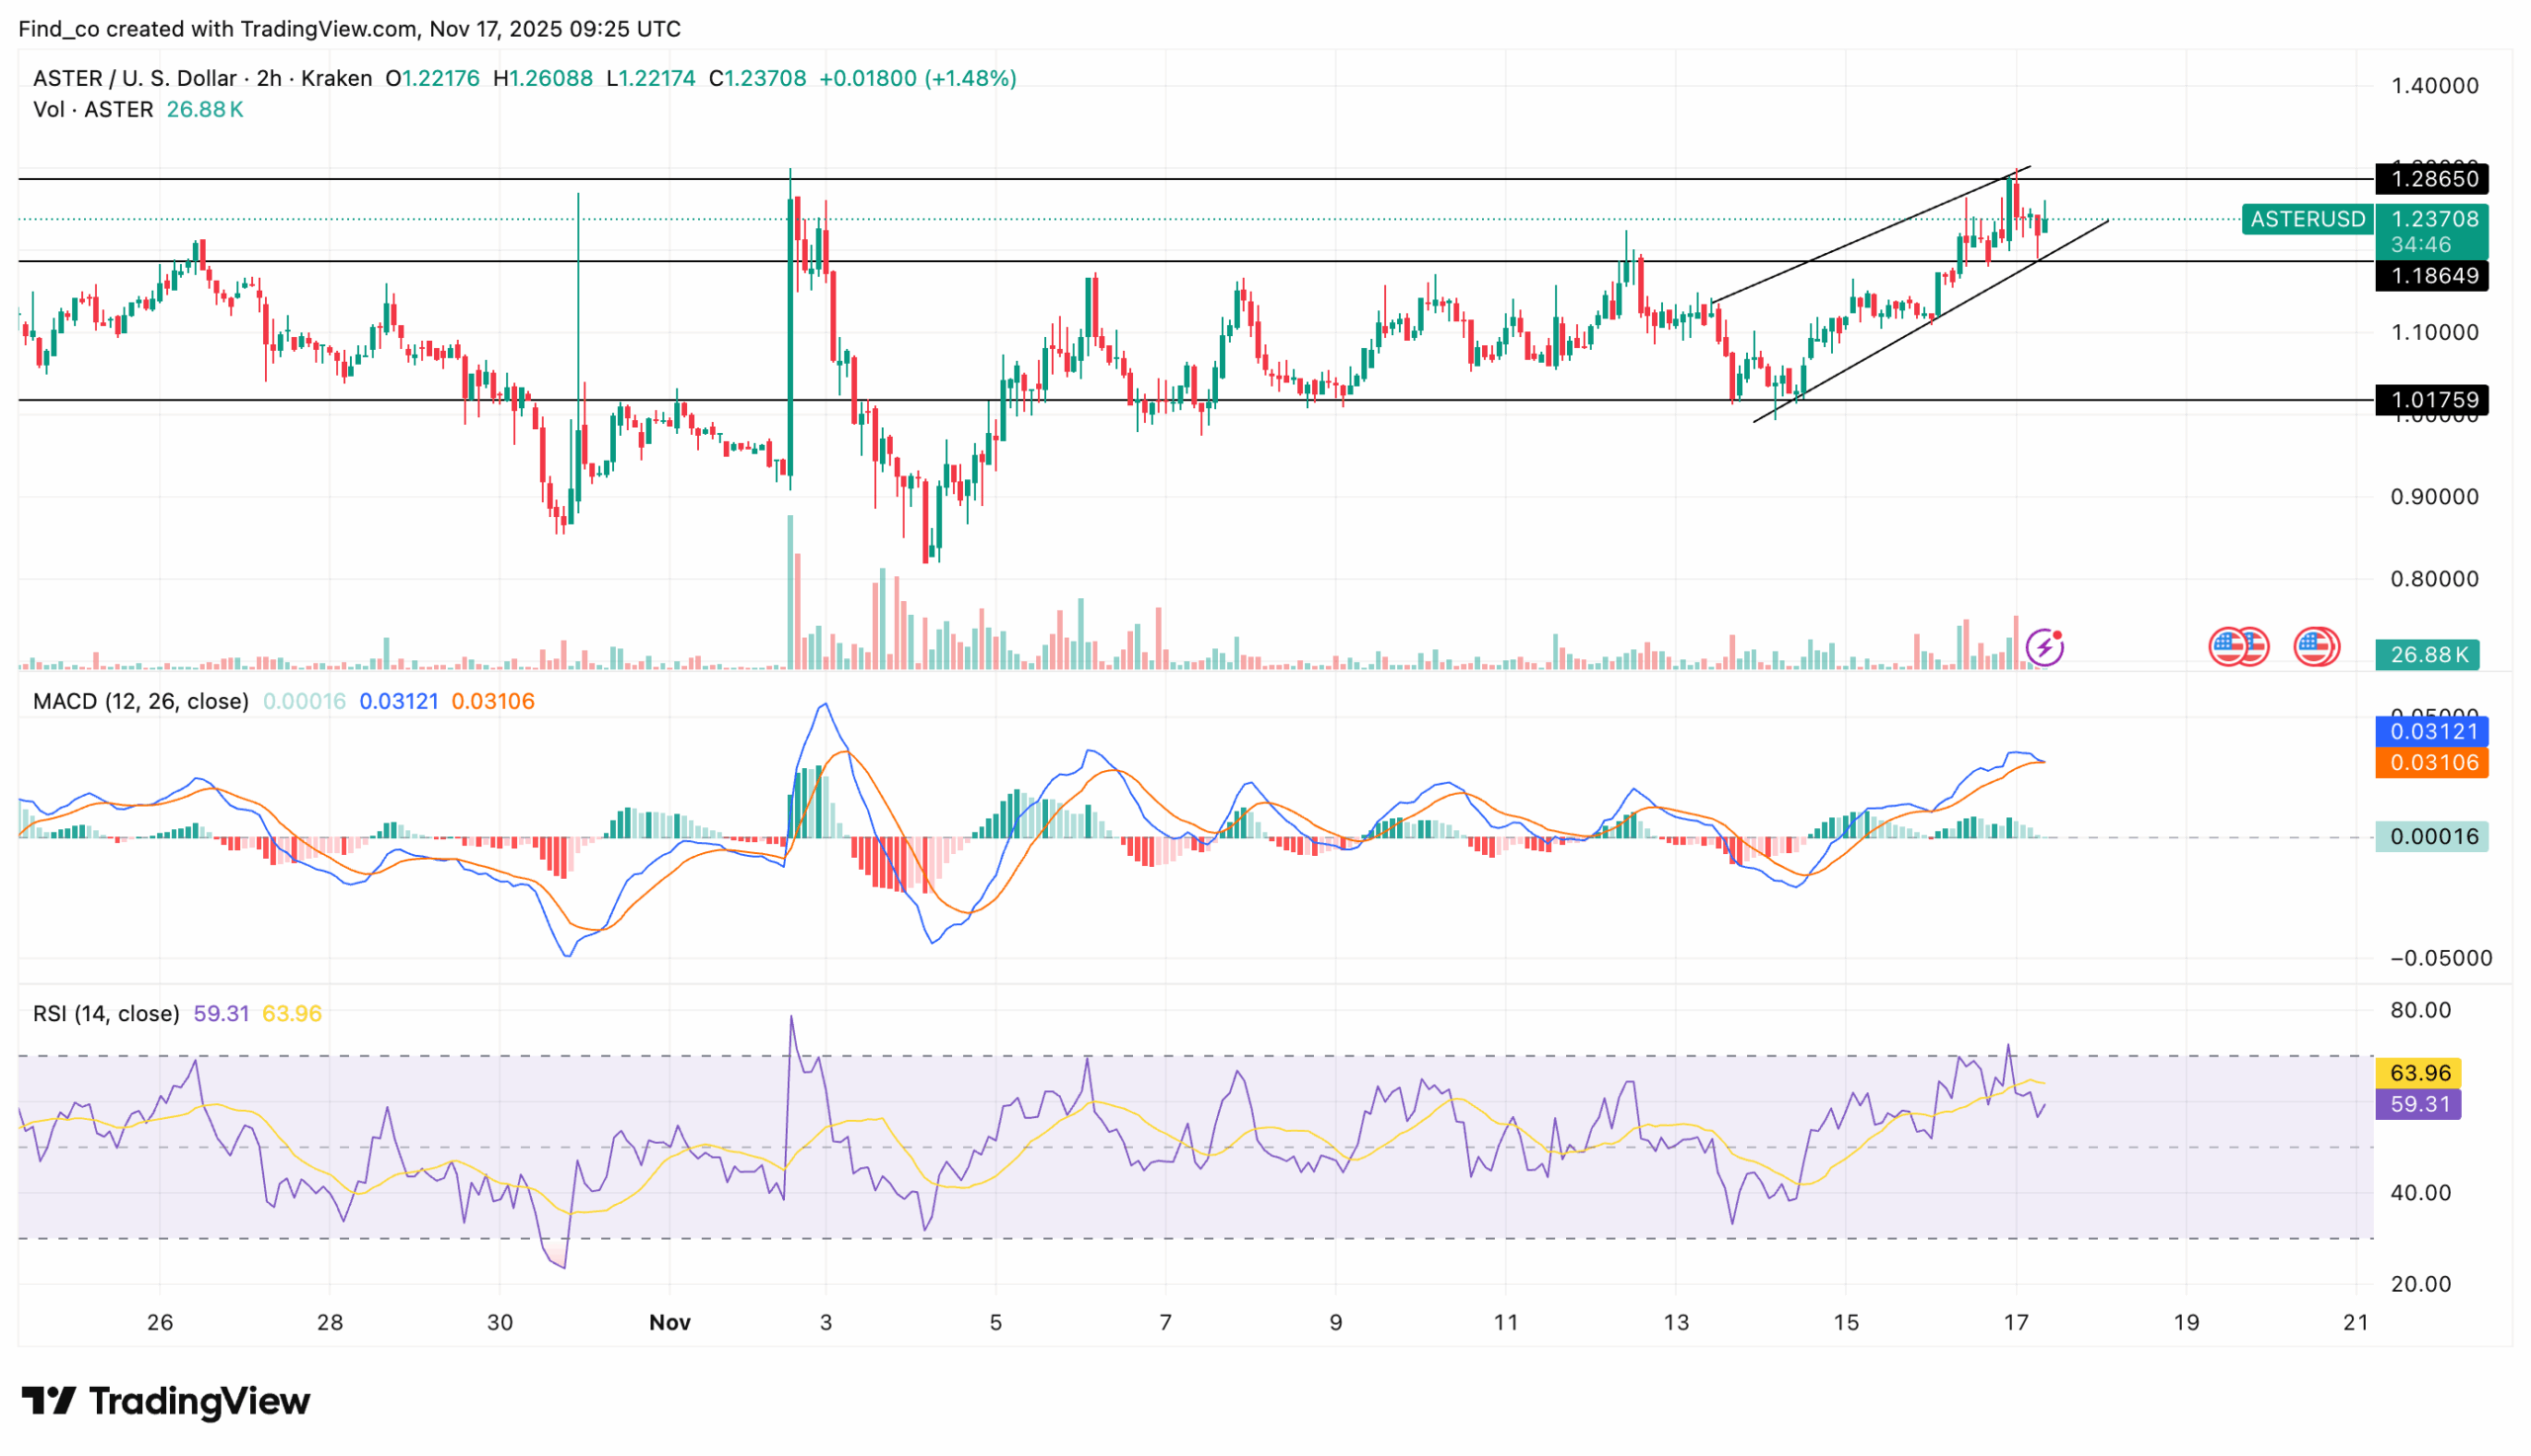
ASTER’s Moving Average Convergence Divergence (MACD) on the 2-hour timeframe is signaling a notable change in momentum.
As shown below, the EMA 12 (blue) has crossed above the EMA 26 (orange), indicating a bullish crossover that marks the early stages of a potential trend reversal.
Get These Top Crypto Casino Offers Now!
Sponsored
Disclosure
We sometimes use affiliate links in our content, when clicking on those we might receive a commission at no extra cost to you. By using this website you agree to our terms and conditions and privacy policy.
This crossover reflects growing buyer strength, indicating that ASTER’s price may be gaining the momentum needed to rebound after its prolonged decline.
Similarly, ASTER’s Relative Strength Index (RSI) supports the bullish outlook.
Currently above the neutral mark at 56.84, the RSI shows that buying pressure is gradually strengthening and the asset is moving into bullish territory.
This position typically signals improving market confidence and precedes continued upward trends.
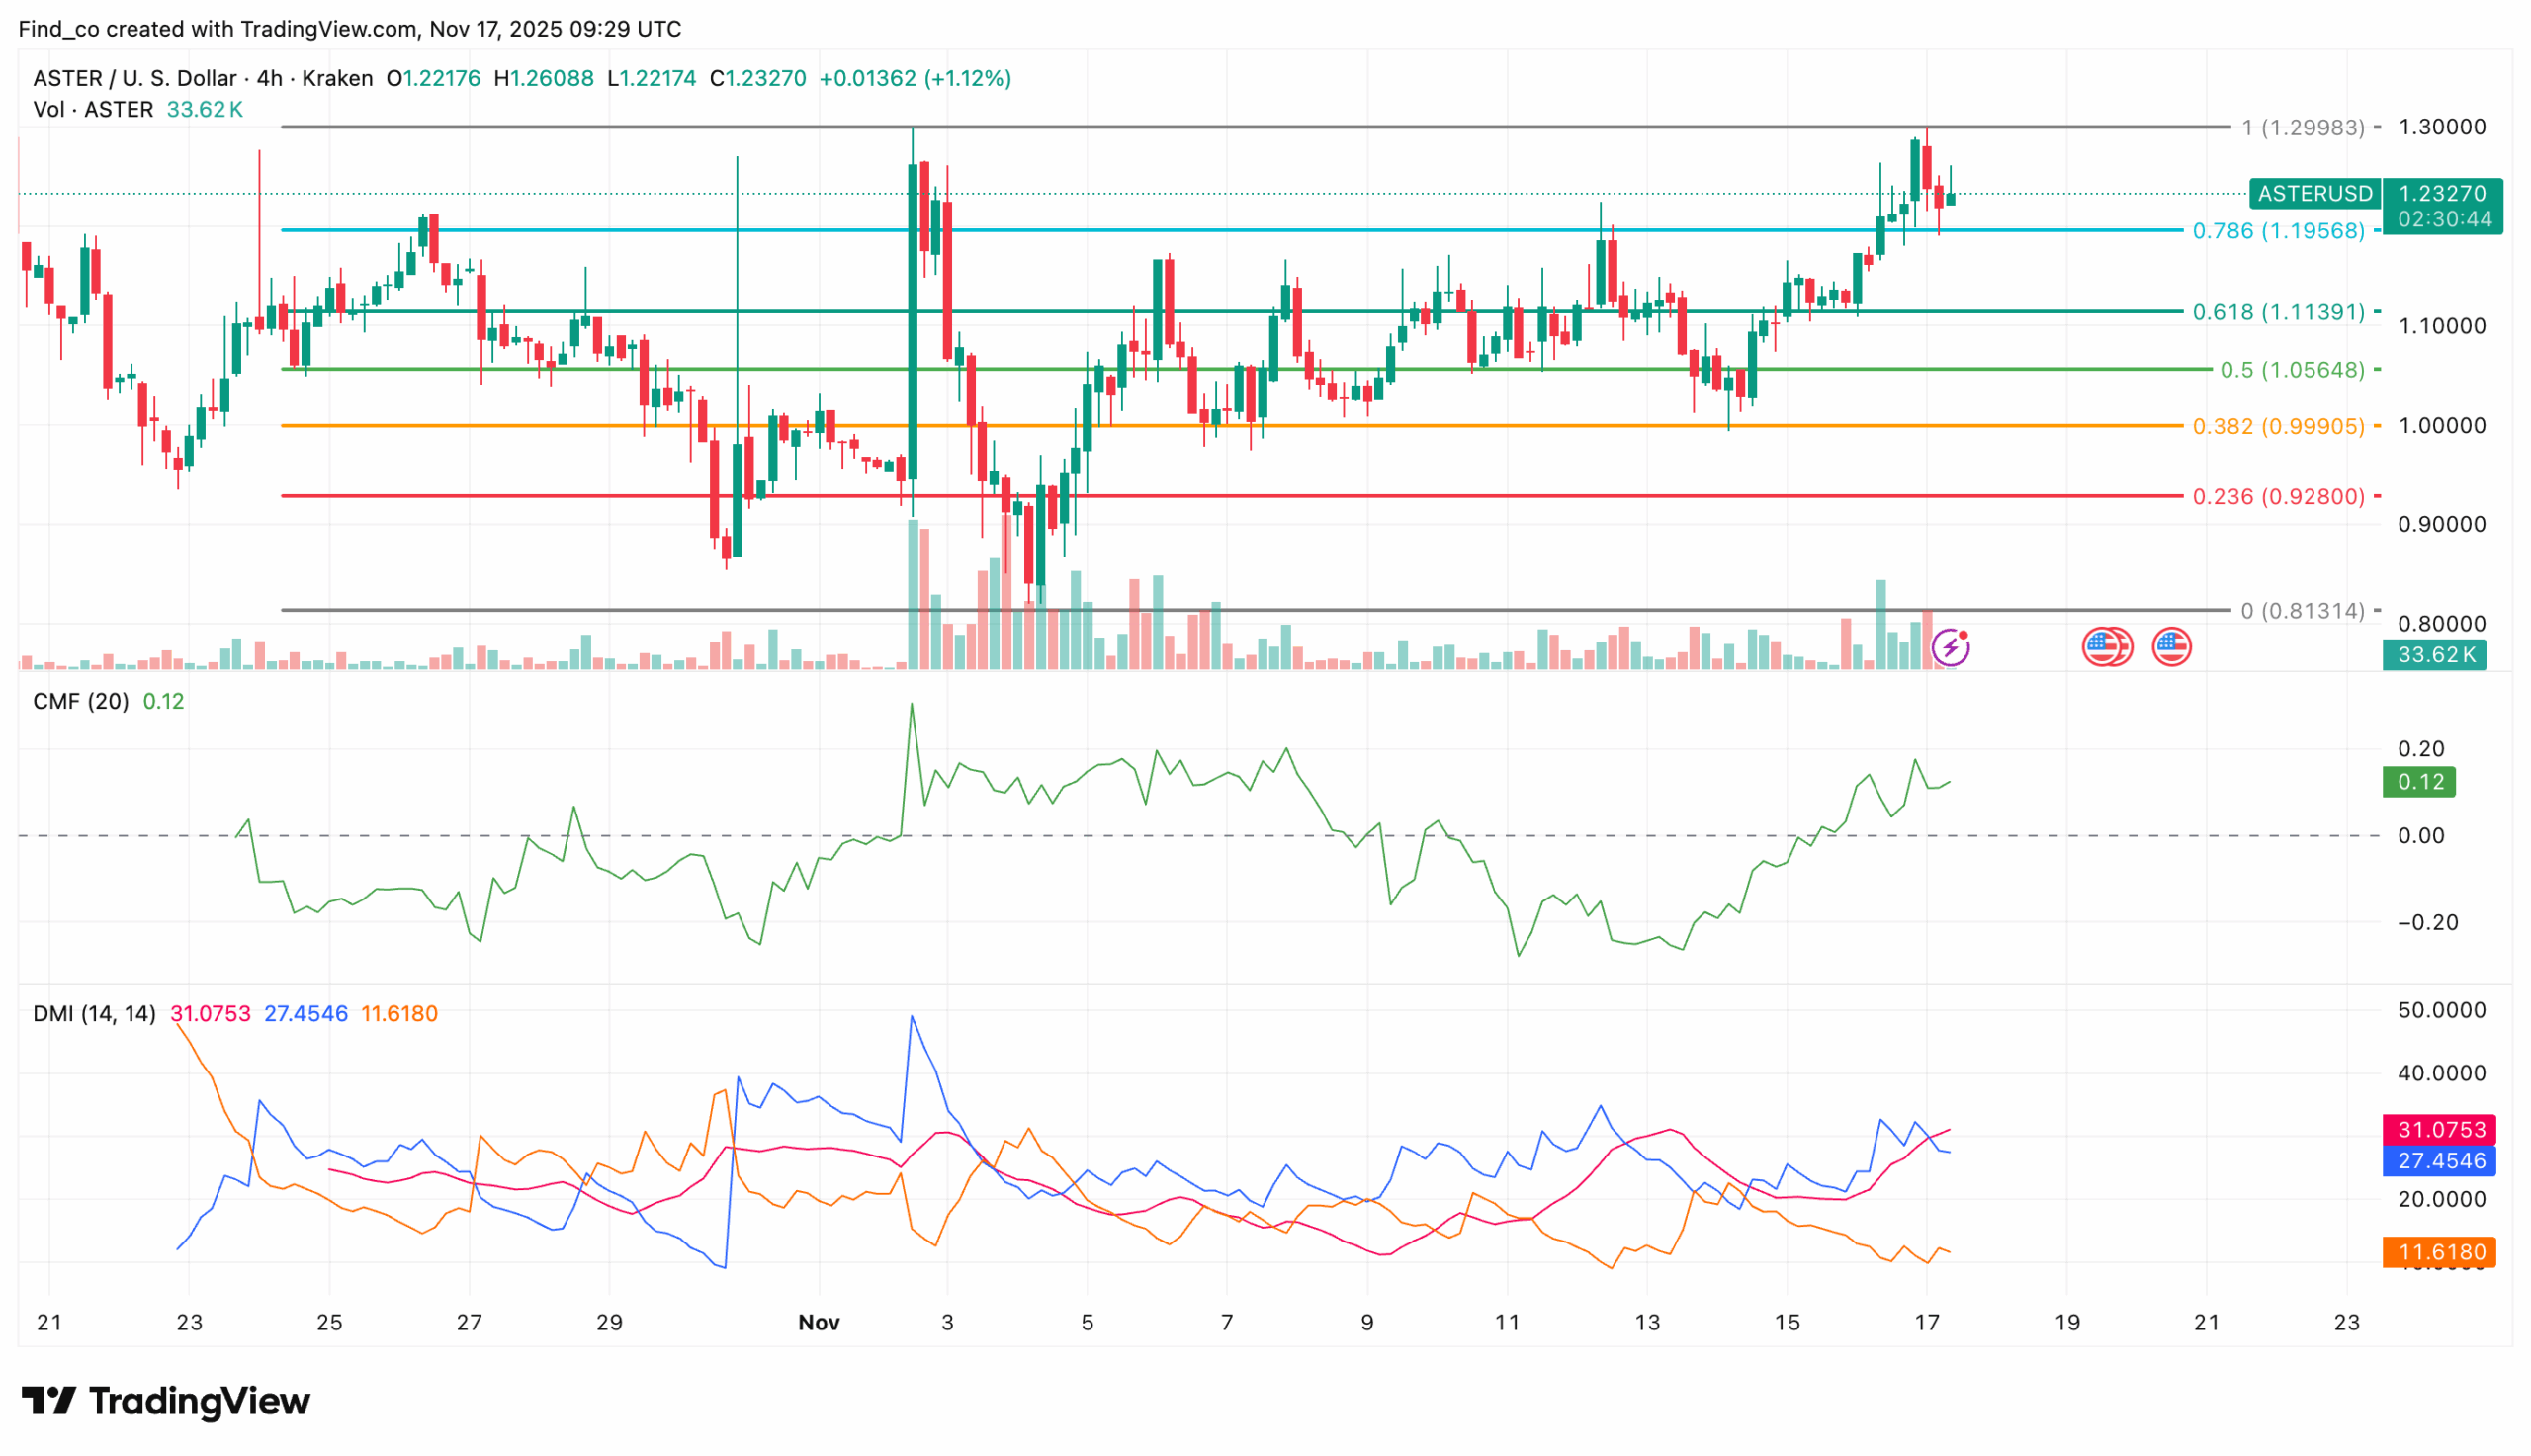
On the 4-hour chart, ASTER’s price has exhibited signs of bullish reversals. Its Chaikin Money Flow Index (CMF) trades in positive territory at 0.12.
A positive CMF indicates that buyers are dominating the market and accumulating rather than exiting their positions. This steady inflow fuels early-stage reversals.
In a similar vein, the Directional Movement Index (DMI) suggests the same trajectory. The positive +DMI (green) sits at 30.35, trending above the negative -DMI at 12.28.
This alignment shows that upward price movements are gaining strength. A closer look at the chart indicates that ASTER’s price is now confined in an ascending channel.
The widening gap between the two lines highlights growing bullish pressure and adds credibility to the view that the downtrend is weak.
Reinforcing this bullish setup, the Average Directional Index (ADX) also reflects strong momentum.
At the time of writing, the indicator reads 30.94, confirming that a bullish trend may be resuming. This also signals that ASTER’s price could climb steadily toward its resistance levels.
What Lies Ahead for the Crypto
The Fibonacci retracement offers further insight into ASTER’s next move.
At press time, the crypto trades at $1.23, above the 0.786 Fibonacci level and just below the 1.0 Fibonacci level at $1.30, which corresponds to its all-time high.
This placement indicates that the cryptocurrency is approaching a critical resistance point.
Furthermore, a successful break above this level would complete a recovery from its previous 50% decline, confirm a strong bullish reversal, and potentially open the door toward $2 if momentum continues.
On the other hand, if ASTER’s price loses momentum, immediate support lies at the 0.786 Fibonacci level, near $1.19.
A breach below this zone could trigger a deeper pullback toward the $1.10 to $1.06 range, testing the resilience of buyers who have been defending recent lows.
Disclaimer:
The information provided in this article is for informational purposes only. It is not intended to be, nor should it be construed as, financial advice. We do not make any warranties regarding the completeness, reliability, or accuracy of this information. All investments involve risk, and past performance does not guarantee future results. We recommend consulting a financial advisor before making any investment decisions.
Victor Olanrewaju is a crypto analyst and reporter at CCN with deep roots in on-chain research and technical analysis. His crypto journey began in 2017, but it was the 2020 Uniswap airdrop that sparked a full-time pivot into the space.
With a foundation in copywriting, Victor honed his craft creating high-converting content for leading crypto brokers — most notably an XRP price prediction that ranked #1 on Google during the 2021 bull run.
He later joined AMBCrypto in 2022, where he combined storytelling with technical and on-chain analysis to cover key market narratives.
In 2024, he expanded his expertise at BeInCrypto, collaborating with analysts and using tools like Glassnode, Santiment, and IntoTheBlock to break down Bitcoin and altcoin trends.
At CCN, Victor covers the top cryptocurrencies, memecoins, macro shifts, blending real-time insights with deep-dive metrics.
He holds a Bachelor’s degree in Physics from the University of Ibadan, equipping him to simplify complex data for a wide audience. Follow his work or connect on LinkedIn or X.