Aster’s announced on-chain token buyback has lifted confidence and stabilized its price.
Indicators like the RSI and CMF indicate rising inflows and improving accumulation.
A breakout above $1.09 could propel ASTER toward $1.21; bulls must hold $ 1.00 support.
Aster (ASTER) has drawn interest after the decentralized exchange (DEX) announced a strategic token buyback program aimed at reducing the circulating supply.
Over the past week, ASTER’s price has risen 2.37%, accompanied by a 31.5% surge in trading volume.
But is ASTER ready for a new rally? Here is what the charts reveal.
ASTER Sees Fresh Inflows
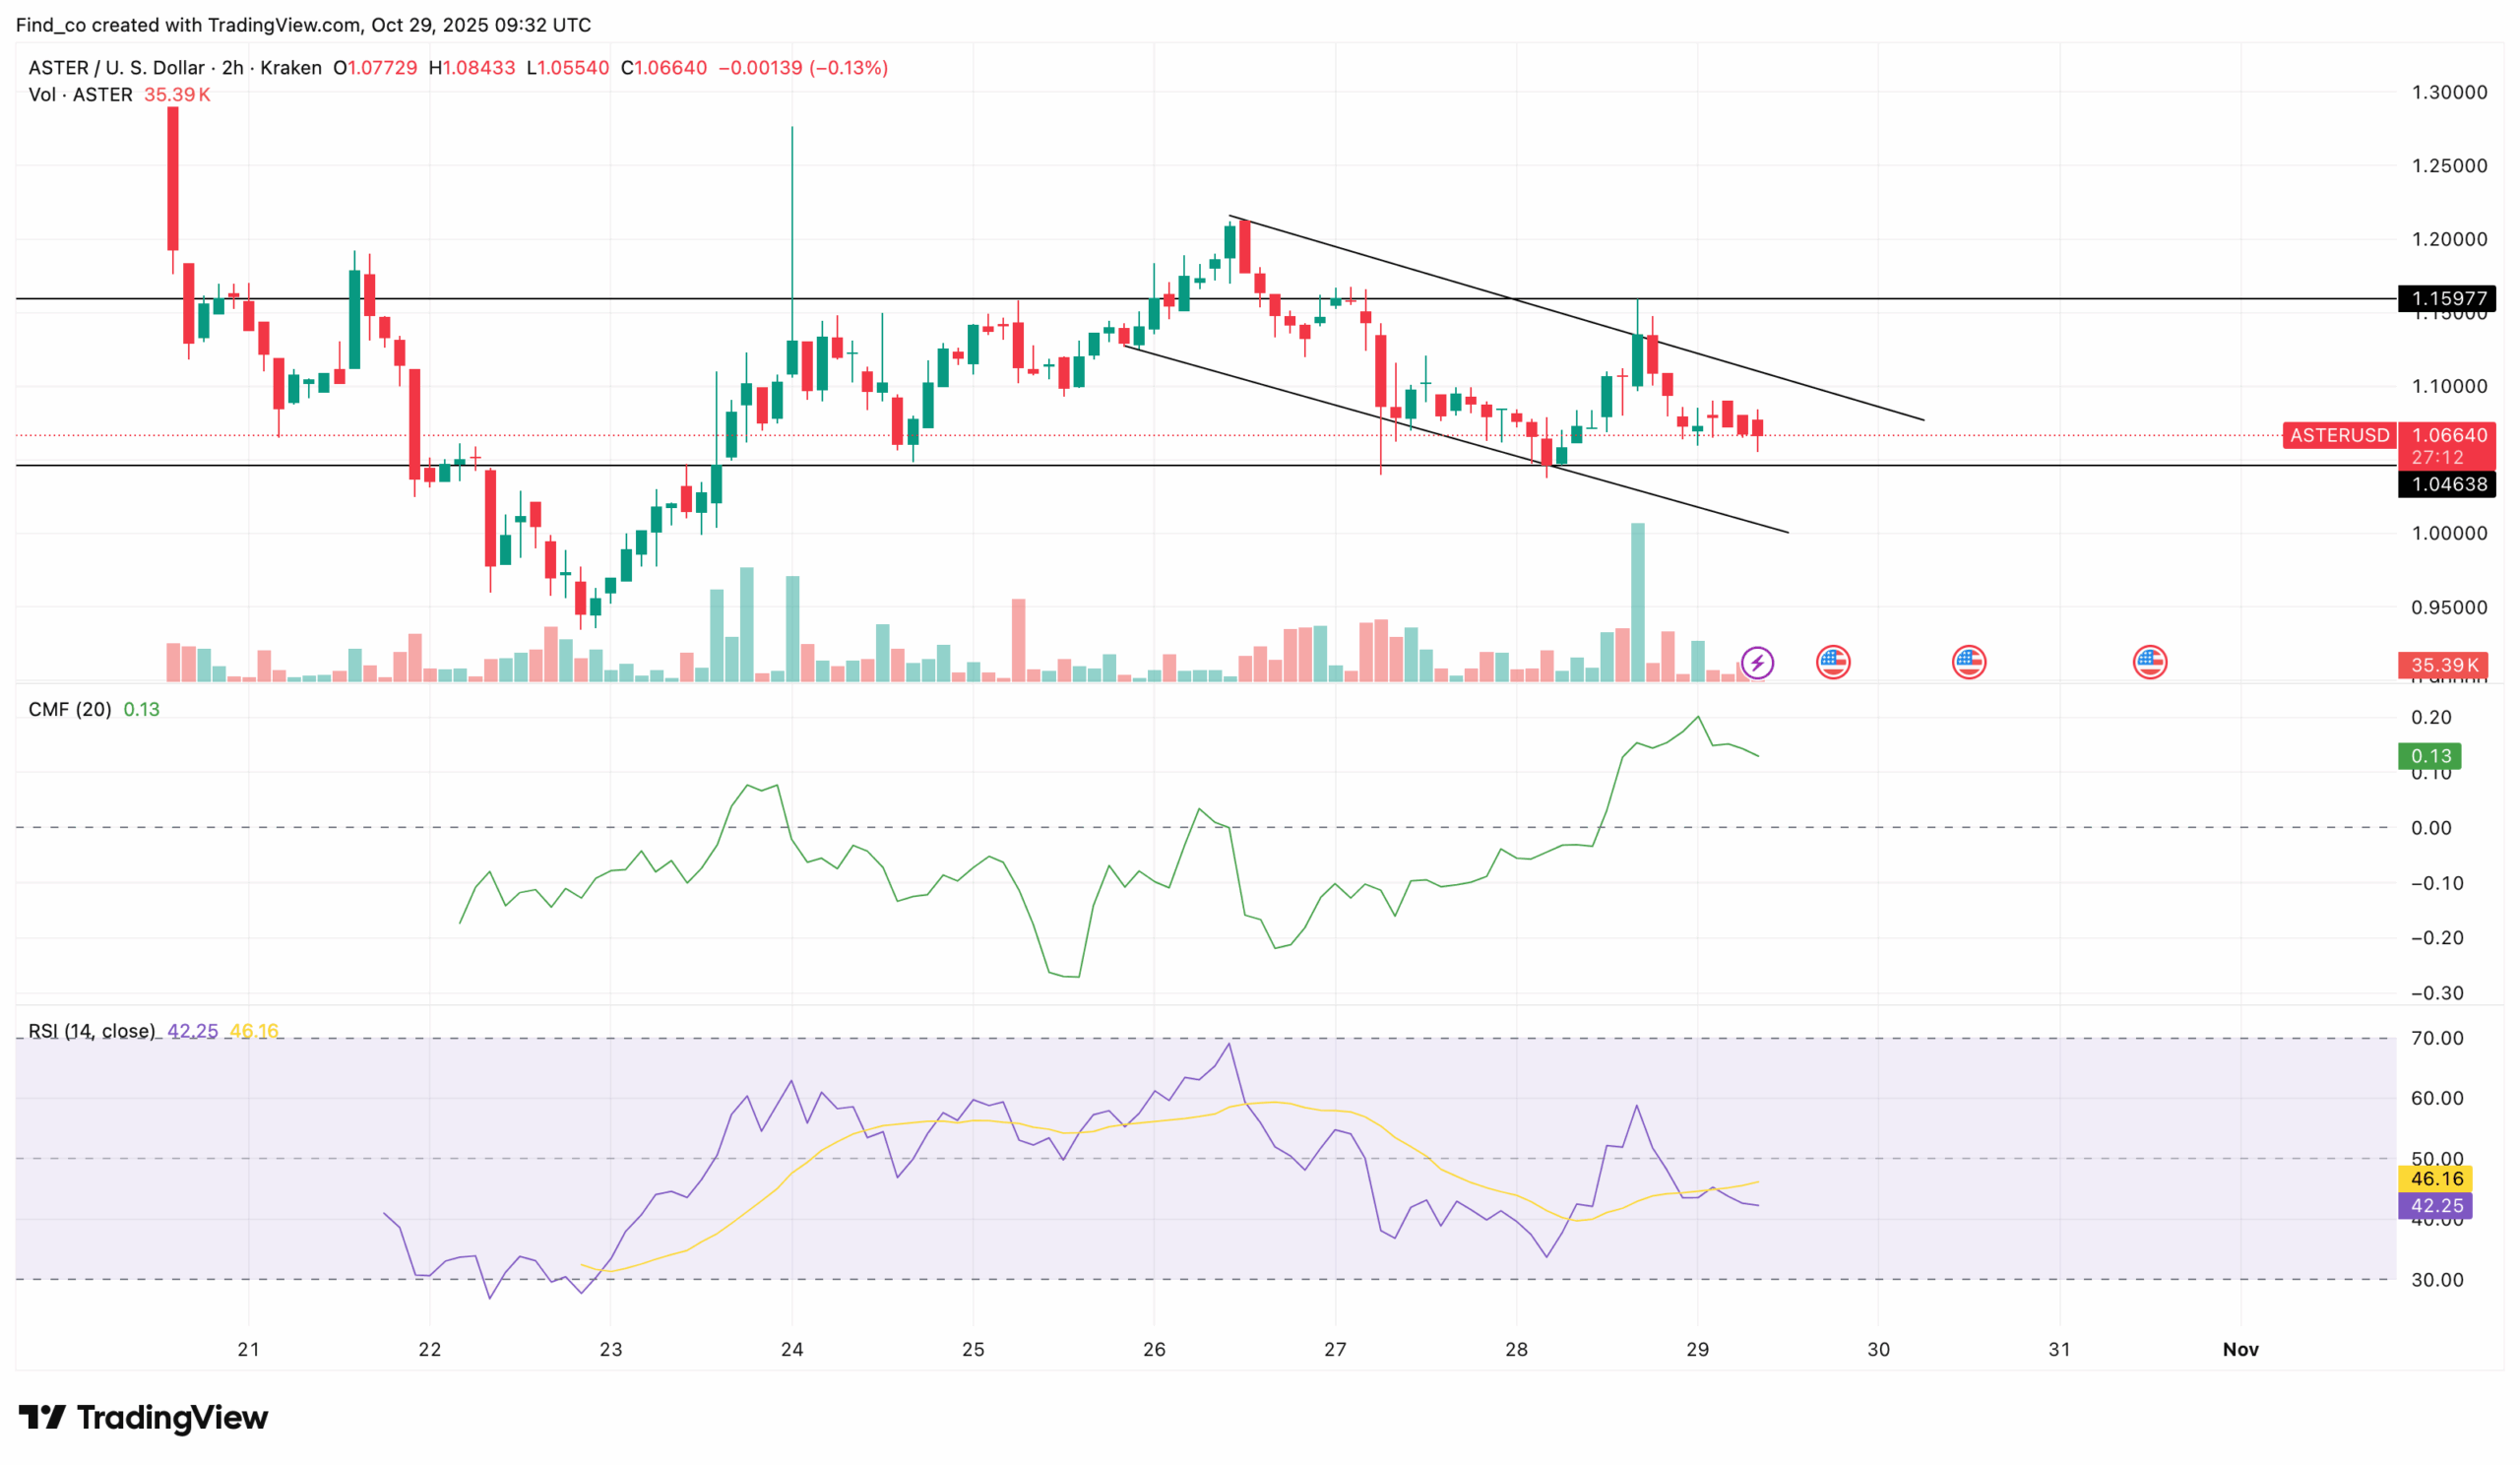
On the 2-hour chart, ASTER’s Relative Strength Index (RSI) shows signs of a bullish turn. The RSI currently sits at 44.21 and is attempting to break above the neutral 50 level toward the bullish zone between 55 and 60.
This shift indicates that buying pressure could soon outweigh selling momentum.
Building on this strength, the Chaikin Money Flow (CMF) indicator remains positive at 0.13, indicating that capital inflows continue to exceed outflows.
Get These Top Crypto Casino Offers Now!
Sponsored
Disclosure
We sometimes use affiliate links in our content, when clicking on those we might receive a commission at no extra cost to you. By using this website you agree to our terms and conditions and privacy policy.
Additionally, it appears that Aster’s decision to repurchase its token is contributing to the stabilization.
On Oct. 28, Aster confirmed it will begin the buyback after the S3 airdrop.
“The on-chain buyback is currently in progress and will continue daily until the target range of 70% to 80% of the trading fees generated during S3 is reached. All buybacks are executed directly from the open market. The address used for buybacks will be disclosed once it’s completed.” The DEX added earlier today.
If the DEX buyback initiative continues to lift confidence, ASTER’s price may soon retest the upper boundary of its immediate resistance at $1.09.
Combined with rising momentum, the token’s short-term outlook remains moderately bullish as long as it holds above the $1 support.
ASTER Price Shows Gradual Recovery
The 4-hour chart reinforces this momentum, with the Awesome Oscillator printing consecutive green bars despite remaining below the zero line.
This pattern indicates that bullish momentum is gradually building as buyers regain control. If the oscillator maintains its upswing and crosses into positive territory, it would confirm a potential trend reversal in favor of the bulls.
Meanwhile, the Money Flow Index (MFI) has inched closer to the neutral 50 mark, currently trending upward at 41.90.
This movement reflects easing selling pressure and growing buying activity. Sustained buying could push the indicator into bullish territory, strengthening the case for continued recovery.
At press time, the token trades at $1.07, aligning closely with its key support zone and the 0.382 Fib level. A breakout above this level could send prices toward the 0.786 Fib level at $1.21
However, if ASTER’s price fails to hold its support zone and continues downward, it could revisit lower levels near the 0.236 Fib mark at $1.02 and potentially extend losses toward the 0 Fib level at $0.93.
Disclaimer:
The information provided in this article is for informational purposes only. It is not intended to be, nor should it be construed as, financial advice. We do not make any warranties regarding the completeness, reliability, or accuracy of this information. All investments involve risk, and past performance does not guarantee future results. We recommend consulting a financial advisor before making any investment decisions.
Victor Olanrewaju is a crypto analyst and reporter at CCN with deep roots in on-chain research and technical analysis. His crypto journey began in 2017, but it was the 2020 Uniswap airdrop that sparked a full-time pivot into the space.
With a foundation in copywriting, Victor honed his craft creating high-converting content for leading crypto brokers — most notably an XRP price prediction that ranked #1 on Google during the 2021 bull run.
He later joined AMBCrypto in 2022, where he combined storytelling with technical and on-chain analysis to cover key market narratives.
In 2024, he expanded his expertise at BeInCrypto, collaborating with analysts and using tools like Glassnode, Santiment, and IntoTheBlock to break down Bitcoin and altcoin trends.
At CCN, Victor covers the top cryptocurrencies, memecoins, macro shifts, blending real-time insights with deep-dive metrics.
He holds a Bachelor’s degree in Physics from the University of Ibadan, equipping him to simplify complex data for a wide audience. Follow his work or connect on LinkedIn or X.