The stock market's growth-to-value ratio is about to touch the highs of the dot com bubble. | Source: AP Photo/Mark Lennihan
Share
The stock market growth to value ratio is at historic extremes.
One hedge fund manager warns this indicates equities are in a bubble.
It’s not the only indicator echoing the Dot Com bubble.
The stock market has entered the doldrums after a record-setting crash followed by a record-setting rally. And first-quarter earnings season hasn’t seemed to clear up any of the uncertainty. Over the past week, the market doesn’t seem sure whether valuations should move up or down.
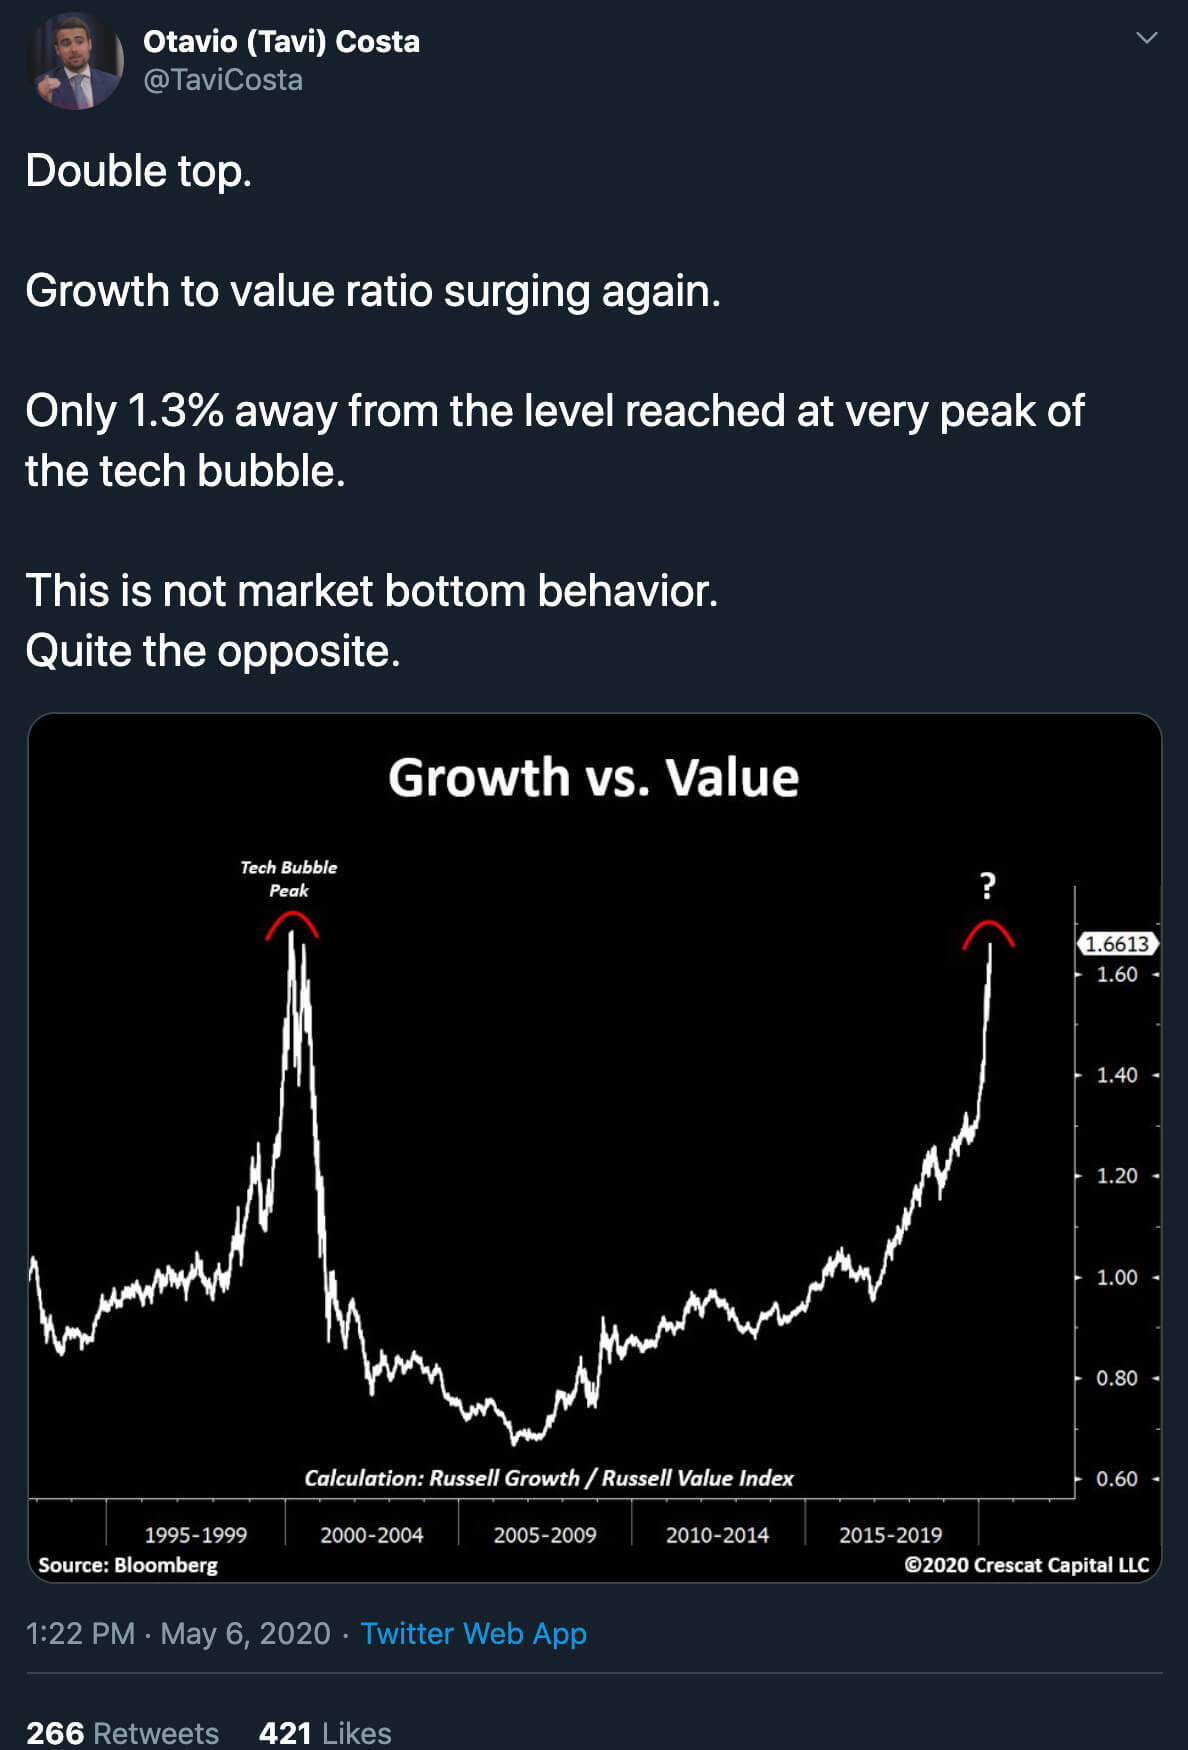
The fundamental question for hedge funds right now is whether equities are still in a bear market, or if they already hit bottom in March with a sustained recovery ahead. To a portfolio manager at Crescat Capital, the readout on one key indicator is “the opposite” of “market bottom behavior.” That indicator is the Russell growth to value ratio.
The Russell 3000 growth to value ratio is on the verge of reaching levels unseen since the 2000 Dot Com peak. While it isn’t referenced as often as the Dow Jones, S&P 500, and NASDAQ, the Russell 3000 index is a more representative benchmark of the entire stock market. It’s a capitalization-weighted index of the 3000 largest U.S. companies.
The Russell 3000 Growth Index tracks companies that have experienced above-average growth. It gives investors a benchmark for the performance of U.S. growth stocks. So companies with higher price to book ratios, but higher forecasted earnings make up the growth index. The Russell 3000 Value Index is a benchmark for value stocks. It includes companies with lower price-to-book ratios and lower forward earnings.
The growth to value ratio is calculated by dividing the growth index by the value index. The higher the ratio, the more capitalization there is in the growth segment of the stock market. The lower the ratio, the more capitalization there is in the value segment. As the NASDAQ bubble grew from 1998 to 2000, the Russell growth to value ratio increased parabolically as massive amounts of capital flowed into riskier growth stocks.
When the Dot Com bubble crashed, the ratio plummeted dramatically as capital fled growth stocks for safety. Today, it’s approaching the Dot Com level peak at a reading of 1.6613. Unless growth stocks can deliver the higher earnings they forecast, they’re prone to a price correction. The S&P 500 is on track for its worst first-quarter corporate earnings since 2009.
The Stock Market Could Be In A Bubble
After equities crashed so spectacularly in February and March, Costa’s suggestion that markets are in a bubble may seem counterintuitive. But the NASDAQ Composite has now retraced to less than a thousand points below its historical record high in February. And it’s actually up for the last 12 months. This despite the worst economic crisis in living memory.
As is readily visible on the growth to value ratio graph Costa tweeted, the current level is several standard deviations away from the average level over the last 15 years since the indicator settled into a bottom and began to increase again. It’s not the only stock market indicator that has reached a historical extreme in 2020. In January, the Enterprise Value (EV) to sales ratio for eight of 11 S&P 500 sectors was twice its peak levels during the tech bubble and right before the 2008 financial crisis.
Meanwhile, market capitalization has hyper-concentrated in the top five U.S. stocks just as it did during the tech bubble. Only this time, the concentration is even more extreme. The equity bulls could be right, and stocks will continue to recover. But the stock market is showing similar signs to those that preceded the last two largest and longest-lasting broad corrections.
Markets Contributor for CCN living in Nashville, Tennessee. Bachelor of Business Administration from Belmont University in 2009 (majored in Entrepreneurship). Organized Senator Rand Paul's first and second online fundraisers in 2009. Roving editor for the Independent Voter Network since 2013. Email me | Link up with me on LinkedIn | Follow Me on Twitter (followed by: fmr Rep. Ron Paul (R-TX), Sen. Rand Paul (R-KY), fmr NM Gov. Gary Johnson, and Rep. Thomas Massie (R-KY))