Stock Market Warning: 6 Mega Stocks Dominate S&P 500’s $21.4 Trillion Cap

The S&P 500 is dangerously lopsided, with 6 massive stocks making up for 25% of the index's entire market cap.| Source: Johannes EISELE / AFP)
- Just six stocks make up 25% of the S&P 500’s market cap. That means stock market investors are vulnerable to risk-off action.
- It’s far worse than the top five market cap concentration during the Dot Com Bubble. It also shows the equities rally isn’t very robust.
- In Feb, Goldman Sachs’ David Kostin said it’s fine as long as these firms meet growth expectations. Then coronavirus happened.
The stock market is exhibiting the same telling sign that preceded the 2000 Dot Com crash. Only it’s much worse today. Six mega-cap stocks make up 25% of the S&P 500’s market capitalization. In other words, the stock market is vulnerable to a lack of diversification.
Of the S&P 500’s total market cap of $21.4 trillion after markets closed Friday, $5.377 trillion belongs to six companies. Those companies are all Silicon Valley tech firms in one sector: Facebook, Amazon, Apple, Netflix, Google, and Microsoft.
- Facebook (NASDAQ:FB) Market Cap – $0.541T
- Amazon (NASDAQ:AMZN) Market Cap – $1.2T
- Apple (NASDAQ:AAPL) Market Cap – $1.24T
- Netflix (NASDAQ:NFLX) Market Cap – $0.187T
- Google (NASDAQ:GOOGL) Market Cap – $0.879T
- Microsoft (NASDAQ:MSFT) Market Cap – $1.33T
FAANGM Total Market Cap – $5.377 trillion
S&P 500 Companies Total Market Cap – $21.4 trillion
FAANGM Share of S&P 500 – 25.13%
S&P 500 Concentration Worse Than Dot Com Bubble

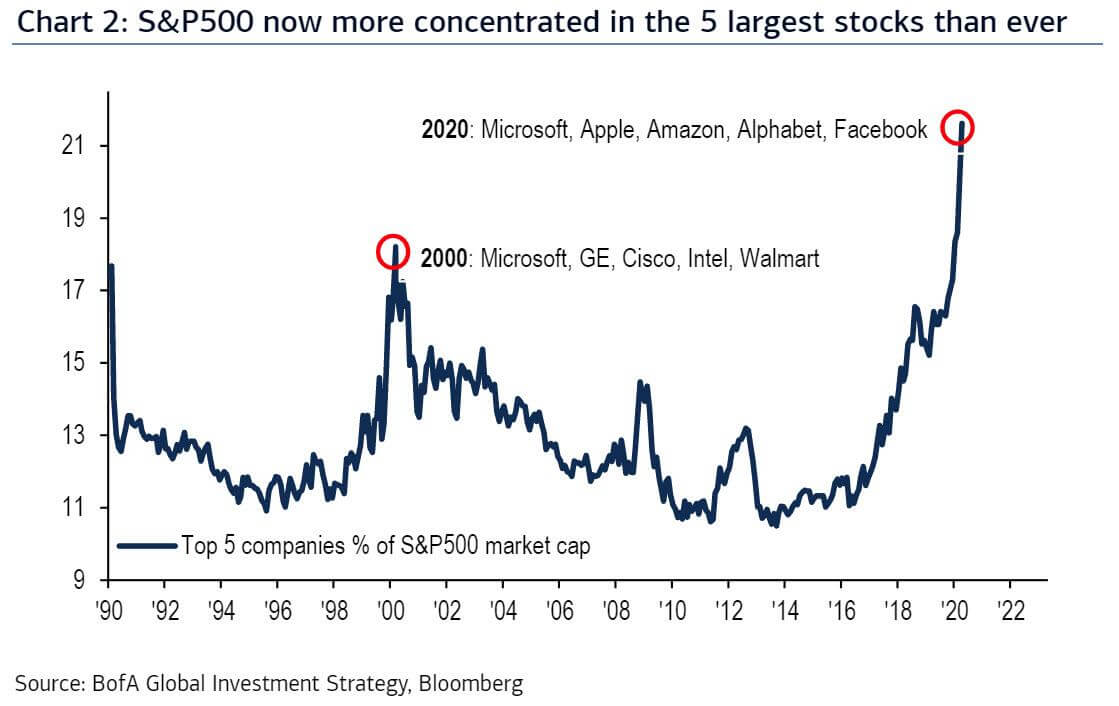
Stock market capitalization was also heavily concentrated in just five companies in 2000 when the Dot Com bubble burst. At that time, the top five S&P 500 companies by market cap were Microsoft, General Electric (NYSE:GE), Cisco (NASDAQ:CSCO), Intel (NASDAQ:INTC), and Wal Mart (NYSE:WMT). That was a dangerously lopsided allocation of equity.

When the stock market went risk-off and economic growth tanked, investors piled into these companies learned the value of a diversified portfolio.
But the stock market is far more lopsided today than it even was in 2000. Back then, the top five companies made up 18% of the S&P 500’s market cap. Today if you exclude Netflix to compare only the top five, they comprise over 24% of the S&P 500. This allocation poses a significant threat to investors in 2020. And with the coronavirus pandemic and lockdowns crashing the economy, it couldn’t be happening at a worse time for the stock market.
A Lopsided Stock Market Reckons With Coronavirus
In early Feb, before the scale of the coronavirus threat became apparent, Goldman Sachs strategist David Kostin pointed out the danger. But he was optimistic that things would be different this time around. That’s because he figured growth would justify FAANGM valuations. Here’s what Kostin said at the time :
In order to avoid repeating the share price collapse experienced by their predecessors, today’s market cap leaders will need to at least meet – and preferably exceed – current consensus growth expectations. This time, expectations seem more achievable based on recent results and management guidance.
This side of the coronavirus pandemic, it’s not at all sure that these companies will meet pre-coronavirus growth expectations. Instead, they will almost certainly fall far short.
Ad spending has gone out the window for many companies short on revenue or out of business altogether. Investment bank Cowen & Co. analysts estimate Facebook and Google will lose $44 billion in ad revenue this year . When their Q1 earnings reports come out, Amazon and Apple are expected to take a big hit to earnings per share. Q2 could be worse.
Relief Rally Belies Stock Market Concentration

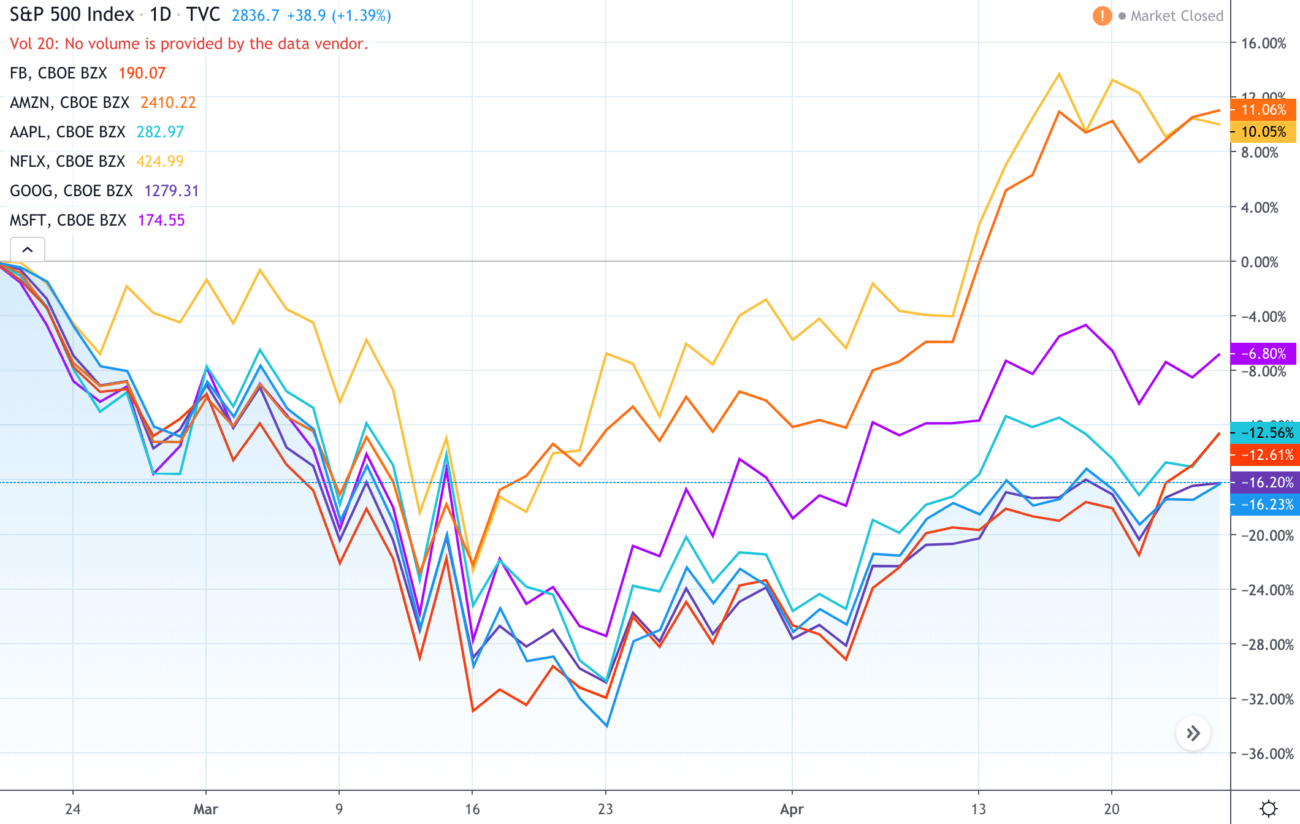
The unprecedented concentration of the S&P 500 market cap in FAANGM shares also reveals the stock market rally since Mar 23 is not very robust.
That’s because these stocks have driven much of the rally. Meanwhile, as David Rosenberg of Rosenberg Research & Associates points out :
The 80% of the market called ex-FAANGM is still down 20% from the highs, even with all the gobs of support from the Fed, the Treasury and Congress. Four out of every five stocks are still in a bear market after all the “stimulus”. What to for an encore?
This narrow rally is a counterpoint to Wall Street analysts who say the stock market has hit bottom or will soon. The ex-FAANGM stocks, or S&P 500 stocks excluding FAANGM, are still down some 20% from the benchmark’s Feb 19 peak, even after bouncing back from the Mar 23 bottom. The index itself closed Friday trading 16.4% down from the peak. FAANGM stocks are doing markedly better in this rally, at an average of 4.5% down from the peak.
This is what I refer to as an oxymoron in today’s investment climate when people believe we’re back in a bull market because of six mega-cap stocks.
And tweeted a picture of the cover for the classic investing book by Warren Buffett’s mentor Benjamin Graham, entitled, “The Intelligent Investor.” David Rosenberg is an intelligent investor, and his skepticism about the equities rally should be duly noted.
Disclaimer: The opinions expressed in this article do not necessarily reflect the views of CCN.com. The above should not be considered investment advice from CCN.com. The author holds no investment position in any of the stocks mentioned.