Reading the bitcoin headlines makes you think the sky is falling. But the digital currency remains the investment of a lifetime. | Image: shutterstock.com
Share
The bitcoin price continues to plummet from its 2019 record near $14,000. Crypto investors are worried while critics are gloating.
But the cryptocurrency remains the highest performing asset in 2019.
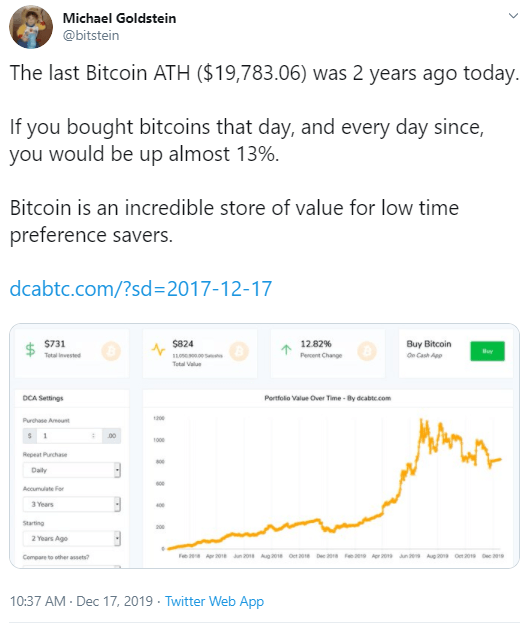
And dollar cost averaging BTC investments even outperformed the same Dow exposure since bitcoin’s all time high price in 2017.
But despite the latest setbacks (and there will undoubtedly be more), bitcoin fundamentally remains a trustworthy store of value for disciplined savers who have time to wait it out.
With BTC’s characteristically wild price swings, it’s easy to think the sky is falling when the price swings downward. But that’s hardly the case.
The problem with fearful apprehensions about the bitcoin price (or gleeful obituaries like an NYU economist’s last month), is their timescale is too narrow.
The statement “bitcoin is down,” begs the question, “Since when?” And over its one decade-long existence, you don’t have to go back far to find that, “bitcoin is up.”
Bitcoin Outperforms the Dow, Gold
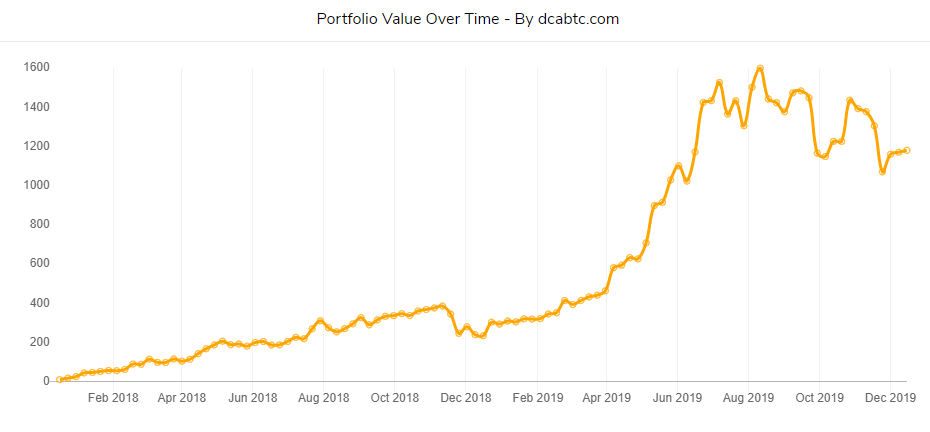
The value of a bitcoin portfolio since its last all time high (ATH) price for a Dollar Cost Averaging (DCA) investor. | Source: dcabtc.com
Dollar cost averaging is an investment strategy of spreading out investments at regular intervals. It’s a less risky way to invest in volatile securities.
DCA also makes for a good analytical tool by removing the arbitrariness of saying “bitcoin is up (or down) since (X date).”
And as the Dollar Cost Averaging BTC chart above shows, investing in the crypto gradually over time has been a remarkably profitable way to save.
If we go back to a more arbitrary measure, bitcoin’s performance for the current calendar year, it still beats stock market benchmarks after six months of losses.
As of Monday, an investment in BTC on Jan. 1 returned a greater profit than the Dow, the NASDAQ Composite, or 2019’s top stock.
Bitcoin rang in the New Year at $3,410 USD. At the moment the Dow closed another record day Monday, bitcoin was trading for $6,868 per coin.
That’s a 100.01% return on investment year to date.
The Dow Jones Industrial Average opened at 23,058 on Jan 2, 2019’s first day of trading. It closed Dec. 16 at 28,235 for a 22.45% ROI.
Tech stocks have led the bull market in equities. The NASDAQ composite opened the year at 6,506, and closed at 8,814 on Dec 16, a 35.47% ROI.
Even the top performing stock for 2019 didn’t hold a candle to bitcoin’s year. New York cosmetics company, Coty (NYSE: COTY) saw the most growth in 2019. Its rise from an opening Jan 2 price of $6.46 to a Dec 16 close of $11.01 was a market whopping 70.43% ROI. Still not as much as bitcoin.
Markets Contributor for CCN living in Nashville, Tennessee. Bachelor of Business Administration from Belmont University in 2009 (majored in Entrepreneurship). Organized Senator Rand Paul's first and second online fundraisers in 2009. Roving editor for the Independent Voter Network since 2013. Email me | Link up with me on LinkedIn | Follow Me on Twitter (followed by: fmr Rep. Ron Paul (R-TX), Sen. Rand Paul (R-KY), fmr NM Gov. Gary Johnson, and Rep. Thomas Massie (R-KY))