How Long Will LTC Continue Increasing? | Credit: Hameem Sarwar
Share
Key Takeaways
Litecoin (LTC) reached a 973-day high on Dec. 2.
LTC trades at the long-term resistance of $130.
Can Litecoin break out and increase above $200?
Litecoin has recovered very slowly after its 2022 lows. While most of the market rallied at the end of 2023 and the beginning of 2024, LTC created a lower high and continued falling until August.
However, this all changed in November when LTC created a monthly candlestick with a magnitude of 80%.
While the increase is impressive, LTC still trades over 70% below its yearly high. Since the price trades at a long-term resistance, a breakout above it can accelerate the increase. Let’s analyze the Litecoin price action and see how likely this is.
The weekly time frame chart shows that LTC has increased rapidly since bouncing at long-term support (white icon) on Aug. 5. In November, LTC reclaimed a long-term ascending support trend line that had existed since 2022.
This was critical since it previously seemed that Litecoin broke down from this long-term diagonal support.
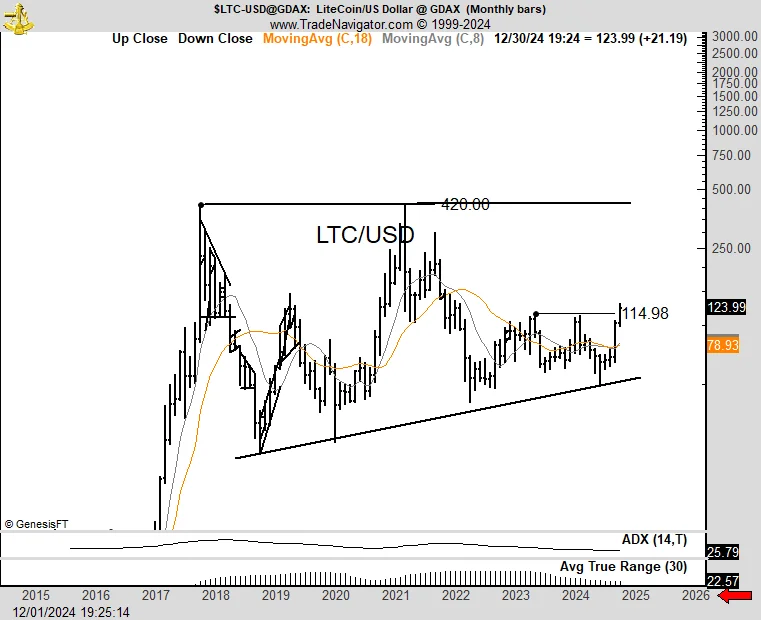
After an 80% increase in November, Litecoin’s price broke out from a diagonal resistance (dashed) and reached a high of $129.85 today. The high was made at the long-term horizontal resistance level of $130.
This is a very important area since it is the final horizontal resistance until $280. So, a weekly close above it could rapidly accelerate the upward movement.
The weekly time frame indicators are also bullish, suggesting the increase will continue. The Relative Strength Index (RSI) is above 70 and the Moving Average Convergence/Divergence (MACD) is positive.
Neither has generated any bearish divergence. So, the weekly time frame chart suggests LTC will eventually break out from the $130 resistance area and increase toward $280.
He outlined a long-term triangle with resistance at the all-time high near $420. Moonshilla shares a similar belief, pointing out the similarities between the Litecoin and XRP charts.
Mike is also bullish because of the breakout from a long-term diagonal resistance, while CryptoBullet gives a more conservative target of $250. Let’s look at the wave count and see what’s next.
Litecoin Increase Continues
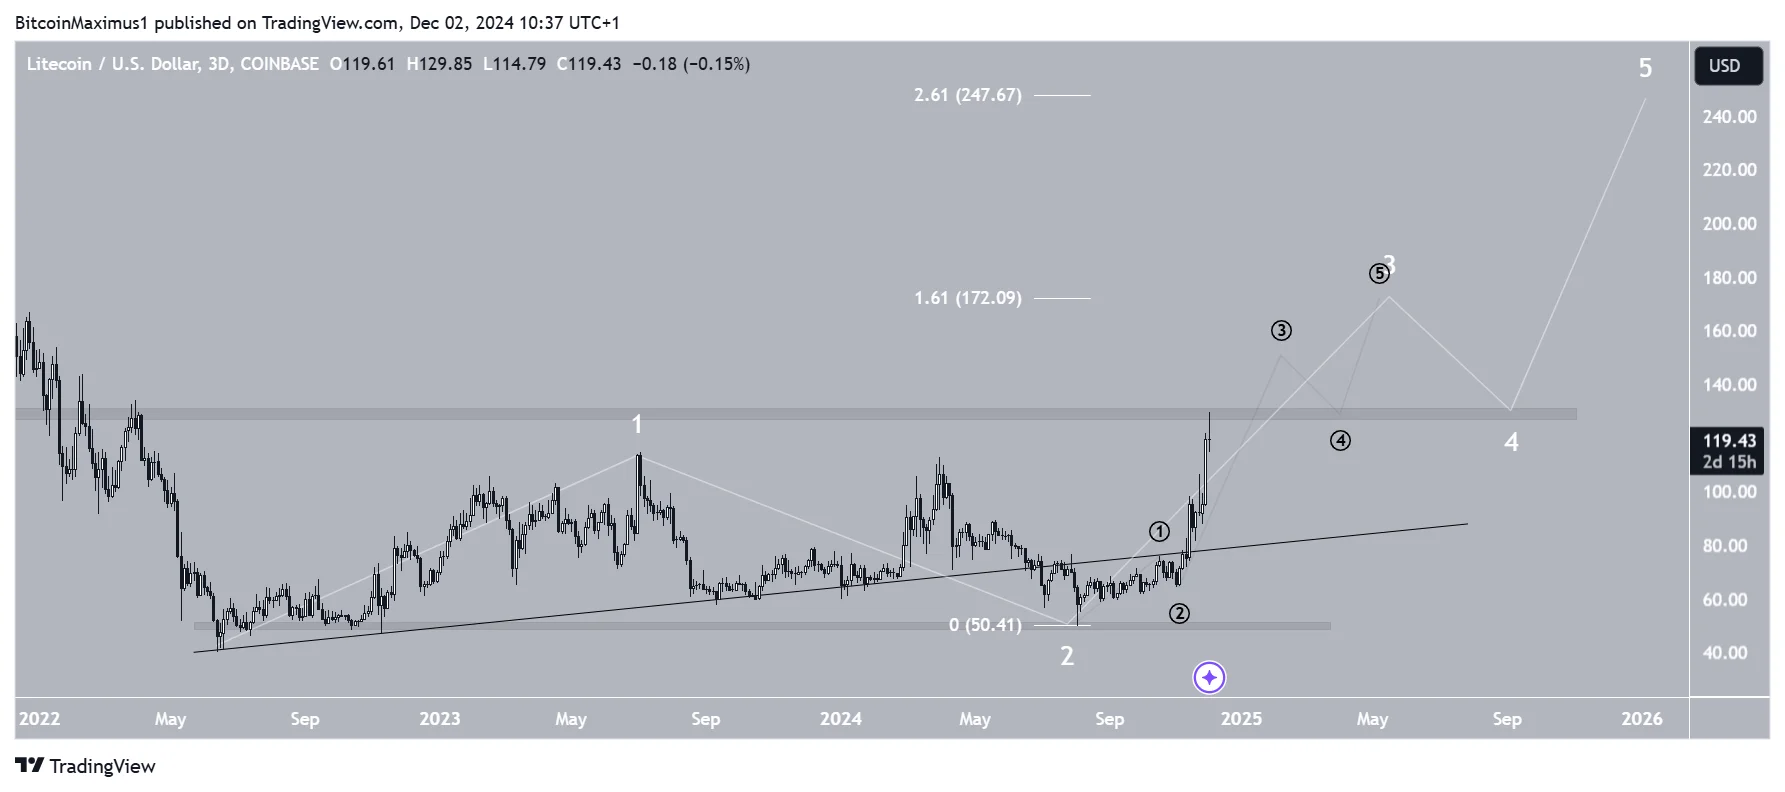
Similarly to the weekly time frame price action and indicator readings, the LTC wave count is bullish.
Before November, it was unclear if the upward movement was an A-B-C structure or a new five-wave increase.
However, since the ongoing upward movement is already larger than the one starting in May 2022, a new five-wave increase (white) becomes much more likely.
The sub-wave count is in black, showing the price is in sub-wave three, which is usually the most rapid portion of the upward movement.
If the count is accurate, LTC will break out above the $130 resistance area and validate it as support soon. Then, a target for the top of wave three is $172.
Then, the entire five-wave upward movement may end at $248, close to the long-term horizontal resistance area.
LTC Price Will Break Out
The weekly time frame chart shows that Litecoin has reclaimed long-term diagonal support and reached long-term horizontal resistance.
The indicator readings are positive, and the wave count suggests that the upward movement will accelerate soon, giving short- and long-term targets of $172 and $248, respectively.
Disclaimer:
The information provided in this article is for informational purposes only. It is not intended to be, nor should it be construed as, financial advice. We do not make any warranties regarding the completeness, reliability, or accuracy of this information. All investments involve risk, and past performance does not guarantee future results. We recommend consulting a financial advisor before making any investment decisions.
Valdrin Tahiri is a cryptocurrency analyst and reporter at CCN, specializing in technical analysis with a focus on Elliott Wave theory, on-chain metrics, and fundamental research. He brings over seven years of experience in the crypto space as both a trader and writer.
He discovered cryptocurrencies in 2017 while earning his MSc in Financial Markets at the Barcelona School of Economics, which sparked a deep interest in blockchain and market dynamics. Since then, he’s contributed to top crypto outlets like BeInCrypto and CoinGape.
Valdrin also served as Community Manager of BeInCrypto’s Telegram group for three years, helping grow it into one of the largest crypto communities worldwide. His expertise in market structure and price patterns allows him to break down complex trends into clear, actionable insights.
He’s published thousands of articles covering altcoins, Bitcoin cycles, and macro trends.