The daily chart showcases JUP navigating a descending triangle structure, consolidating the price around the 0.618 Fibonacci retracement level at $0.9737.
After potentially completing a WXY corrective pattern, the price touched a low near $0.7331 on Jan 13, corresponding to the 0.786 Fibonacci retracement level.
These corrective waves suggest the asset might be nearing the end of its downward phase.
JUPUSD bounce from ascending support | Credit: Nikola Lazic/TradingView
Notably, the broader structure aligns with a potential higher-degree corrective cycle nearing completion.
The Relative Strength Index (RSI) has risen from oversold territory, indicating renewed buying pressure.
However, sustained momentum remains a challenge, with the overhead resistance at $1.1427 (0.5 Fibonacci level) serving as a critical hurdle.
If bulls manage to push above the descending triangle’s upper boundary, it could signal the start of a new impulsive wave, potentially targeting $1.3117 (0.382 Fibonacci retracement) as the next significant level.
Failure to hold above $0.7331 could lead to further downside toward $0.4266, the 1.0 Fibonacci extension of the downward leg.
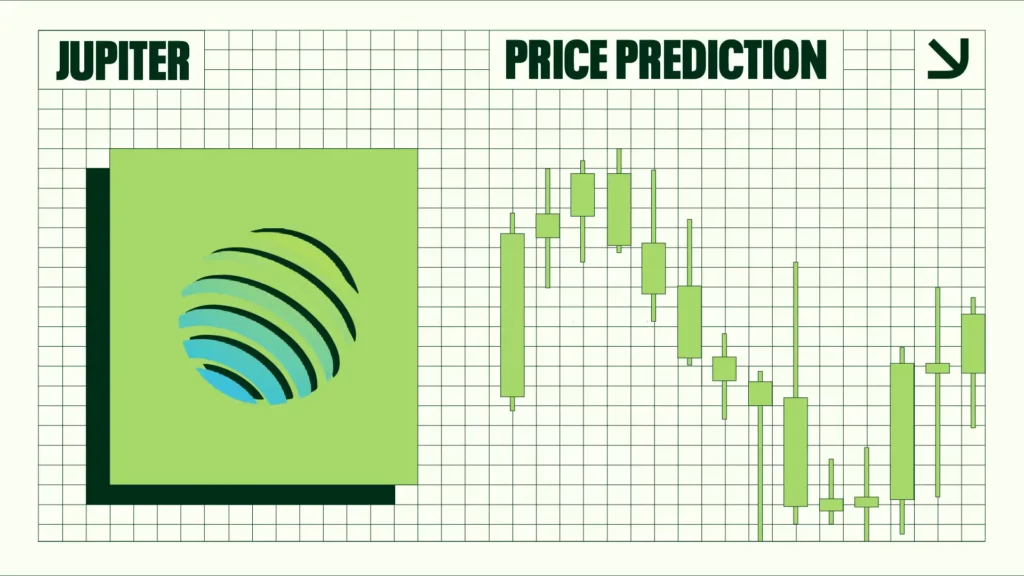
JUP Price Prediction
JUP appears to be initiating a lower-degree five-wave impulsive structure from its recent low on the hourly chart. Wave (i) has likely completed with price testing resistance near $0.8678.
A corrective wave (ii) retracement could bring prices down toward $0.8000 before Wave (iii) begins climbing.
JUPUSD first rise seen | Credit: Nikola Lazic/TradingView
Using Fibonacci extensions, Wave (iii) is projected to target the 1.618 level at approximately $1.10, aligning with previous resistance zones.
Subsequently, Wave (iv) may retrace toward $0.97 before the final Wave (v) extends higher. Wave (v) could target the 2.618 extension near $1.13 based on the current RSI momentum and market structure.
The RSI on this time frame is rising, signaling increased buying interest. However, traders should watch for overbought conditions, which might precede corrective pullbacks.
Overall, the hourly chart suggests bullish potential as long as key supports hold.
Short-Term Target for Wave (v): $1.15 if bullish momentum sustains.
Invalidation Zone: Below $0.7331, signaling a potential bearish trend continuation.
JUP is positioned for a pivotal move. While the daily chart reflects ongoing consolidation, the lower time frame suggests the onset of bullish momentum.
Maintaining support above $0.8000 will be crucial for further upside potential.
Disclaimer:
The information provided in this article is for informational purposes only. It is not intended to be, nor should it be construed as, financial advice. We do not make any warranties regarding the completeness, reliability, or accuracy of this information. All investments involve risk, and past performance does not guarantee future results. We recommend consulting a financial advisor before making any investment decisions.
Nikola Lazic is a cryptocurrency analyst and investor working in the industry since 2017. He holds a bachelor's degree in Sociology, which enables him to better understand the psychology behind the crowd´s positioning. Consequently his preferred analytical tool is Elliott Wave Theory in combination with price action analysis.
Combining his experience in trading and investing with knowledge in content writing he strives to bring the most accurate and actionable information.