ETH price makes a breakout above symmetrical triangle but still kept below horizontal resistance. Upside potential remains but further confirmation is needed.
Share
Key Takeaways
Elliott Wave count shows a completed 5-wave impulsive structure followed by an ABC correction.
Price is consolidating near the 0.382 Fibonacci retracement, indicating indecision.
Symmetrical triangle suggests an imminent breakout, with direction dependent on market momentum.
RSI oscillations highlight neutral momentum, reflecting indecision in the market.
After finishing its corrective stage on Dec. 20 to a low of $3,110, the price of ETH started consolidating. It formed a symmetrical triangle whose breakout we’ve seen, but the price was kept below local horizontal resistance.
Although the bullish outlook remains primary, further confirmation is needed.
The 4-hour ETH chart displays detailed Elliott Wave labeling and Fibonacci retracement levels. A corrective ABC structure to a low of $3,110 followed a significant impulsive wave (i-v) to a high of $4,085.
After it attempted to make a breakout, the price consolidated above a symmetrical triangle near the 0.382 Fibonacci retracement level of $3,419.
ETHUSD still consolidating | Credit: Nikola Lazic/TradingView
The Relative Strength Index (RSI) oscillations suggest market indecision, reflecting overbought and oversold signals during recent swings.
The symmetrical triangle came after an ABC correction, as indicated by the 0.618 Fibonacci retracement, and it was expected to be the first potential sign of a trend reversal. This should be a consolidation period after a 25% decline, but there still aren’t many bullish signs.
The RSI indicates a neutral stance, neither signaling strong bullish nor bearish momentum. This consolidation phase inside the triangle suggests a pivotal breakout decision in the coming sessions.
The triangle’s resolution could determine the next major trend, with Fibonacci levels as key support and resistance.
ETH Price Prediction
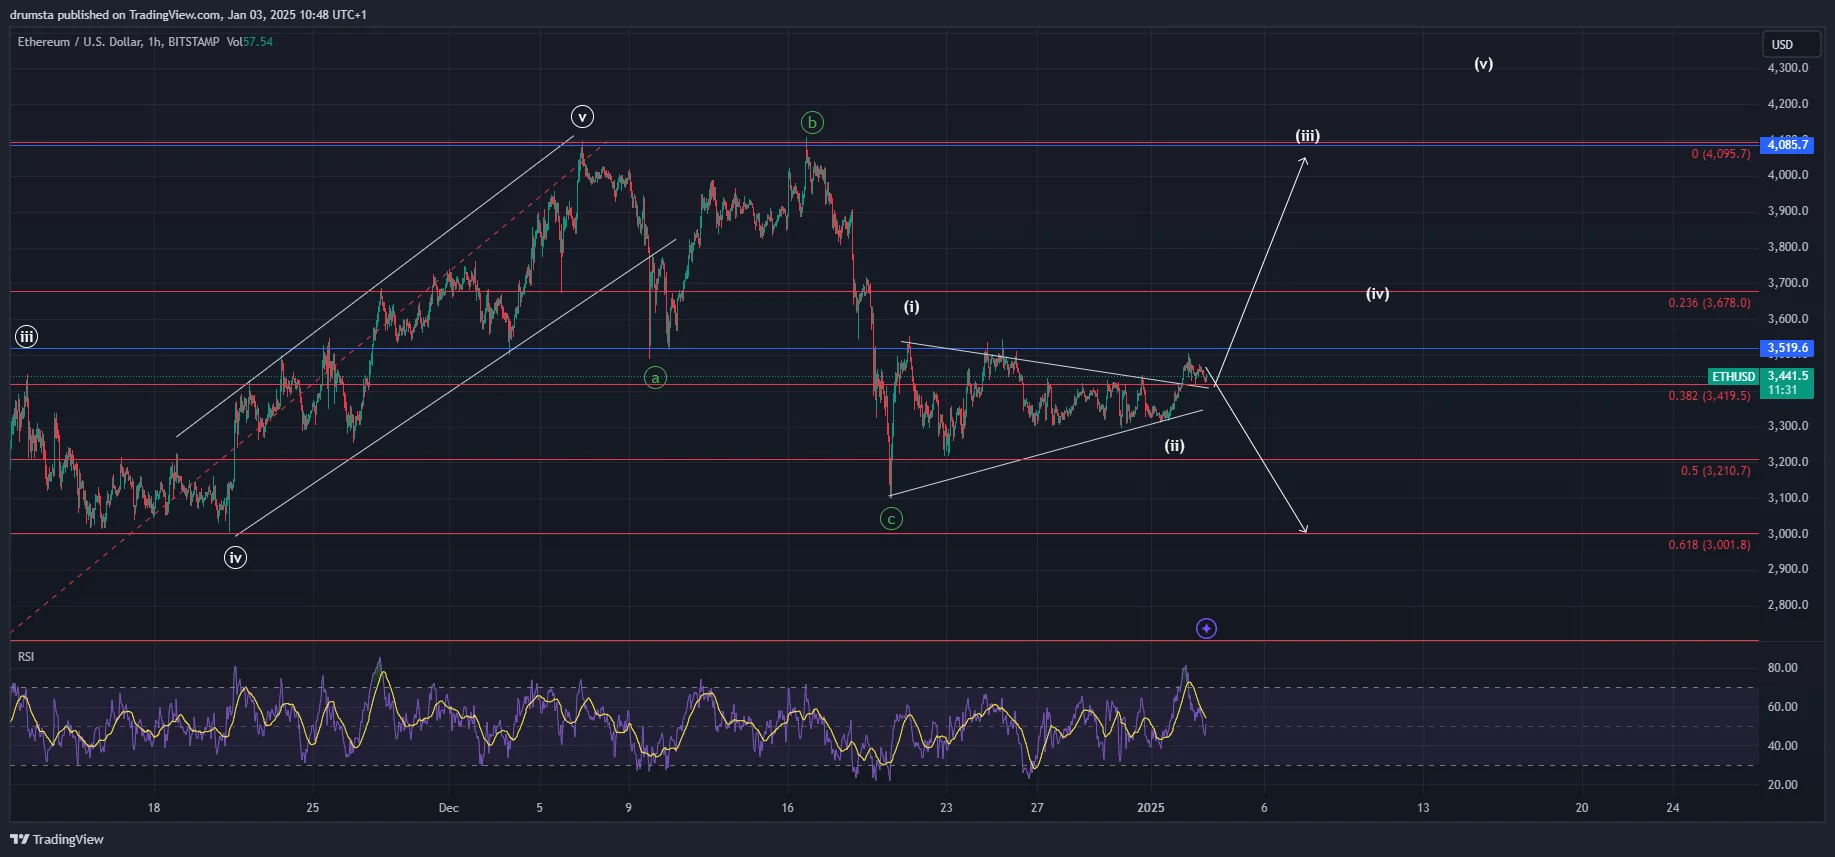
The 1-hour ETH chart showcases a detailed wave analysis and sports zones of interest. Following a completed ABC correction, a potential lower-degree impulsive wave count (i-v) is in progress.
The symmetrical triangle breakout aligns with wave (ii), suggesting the possibility of upward momentum into wave (iii), targeting the $4,085.7 resistance. The RSI shows mild bullish divergence, indicating room for further upward price action, barring rejection at key resistance levels.
ETHUSD breakout above local horizontal resistance will confirm the bullish outlook | Credit: Nikola Lazic/TradingView
The breakout above the triangle indicates a bullish continuation, yet the 0.382 Fibonacci level ($3,419.5) remains pivotal for confirming sustained upward momentum. A potential corrective pullback within wave (iv) could revisit the $3,210.7 level (0.5 Fibonacci retracement).
The bullish target for wave (iii) aligns with prior resistance at $4,085.7, while further downside risk remains at $3,001.8 (0.618 Fibonacci retracement).
Key levels to watch include the $4,085.7 resistance, acting as a major bullish breakout target, and $3,210.7 as crucial support during potential pullbacks. Sustained trading above $3,519.6 (current price level) would signal ongoing bullish sentiment, with the RSI indicating potential for further growth as long as it avoids overbought territory.
Deep Support: $3,001.8 (0.618 Fibonacci retracement).
Short-Term Target for Wave (iii): Above $4,085.7 if bullish momentum sustains.
Disclaimer:
The information provided in this article is for informational purposes only. It is not intended to be, nor should it be construed as, financial advice. We do not make any warranties regarding the completeness, reliability, or accuracy of this information. All investments involve risk, and past performance does not guarantee future results. We recommend consulting a financial advisor before making any investment decisions.
Nikola Lazic is a cryptocurrency analyst and investor working in the industry since 2017. He holds a bachelor's degree in Sociology, which enables him to better understand the psychology behind the crowd´s positioning. Consequently his preferred analytical tool is Elliott Wave Theory in combination with price action analysis.
Combining his experience in trading and investing with knowledge in content writing he strives to bring the most accurate and actionable information.