Has XRP Started a Correction? | Credit: Derek Fenesh
Share
Key Takeaways
The XRP price finally posted a positive monthly performance with an over 30% increase in July.
It failed to break out from a 386-day resistance area despite briefly moving above it.
Will XRP make another attempt at breaking out or does a short-term correction await?
Ripple’s (XRP) has gotten off to a rocky start this year, with the token experiencing a 2% decline year-to-date, while its competitors have largely posted gains. The performance is somewhat of a surprise, given the impressive 31% surge in July, which propelled XRP to its highest price point since March 14.
However, despite this brief uptick, the XRP has consistently struggled to break free from the shackles of its 386-day resistance trend line, which has triggered numerous rejections to date.
The question remains: will XRP finally muster the momentum to shatter this resistance, or will it continue to consolidate before potentially making another breakout attempt?
XRP Declines After Failed Breakout Attempt
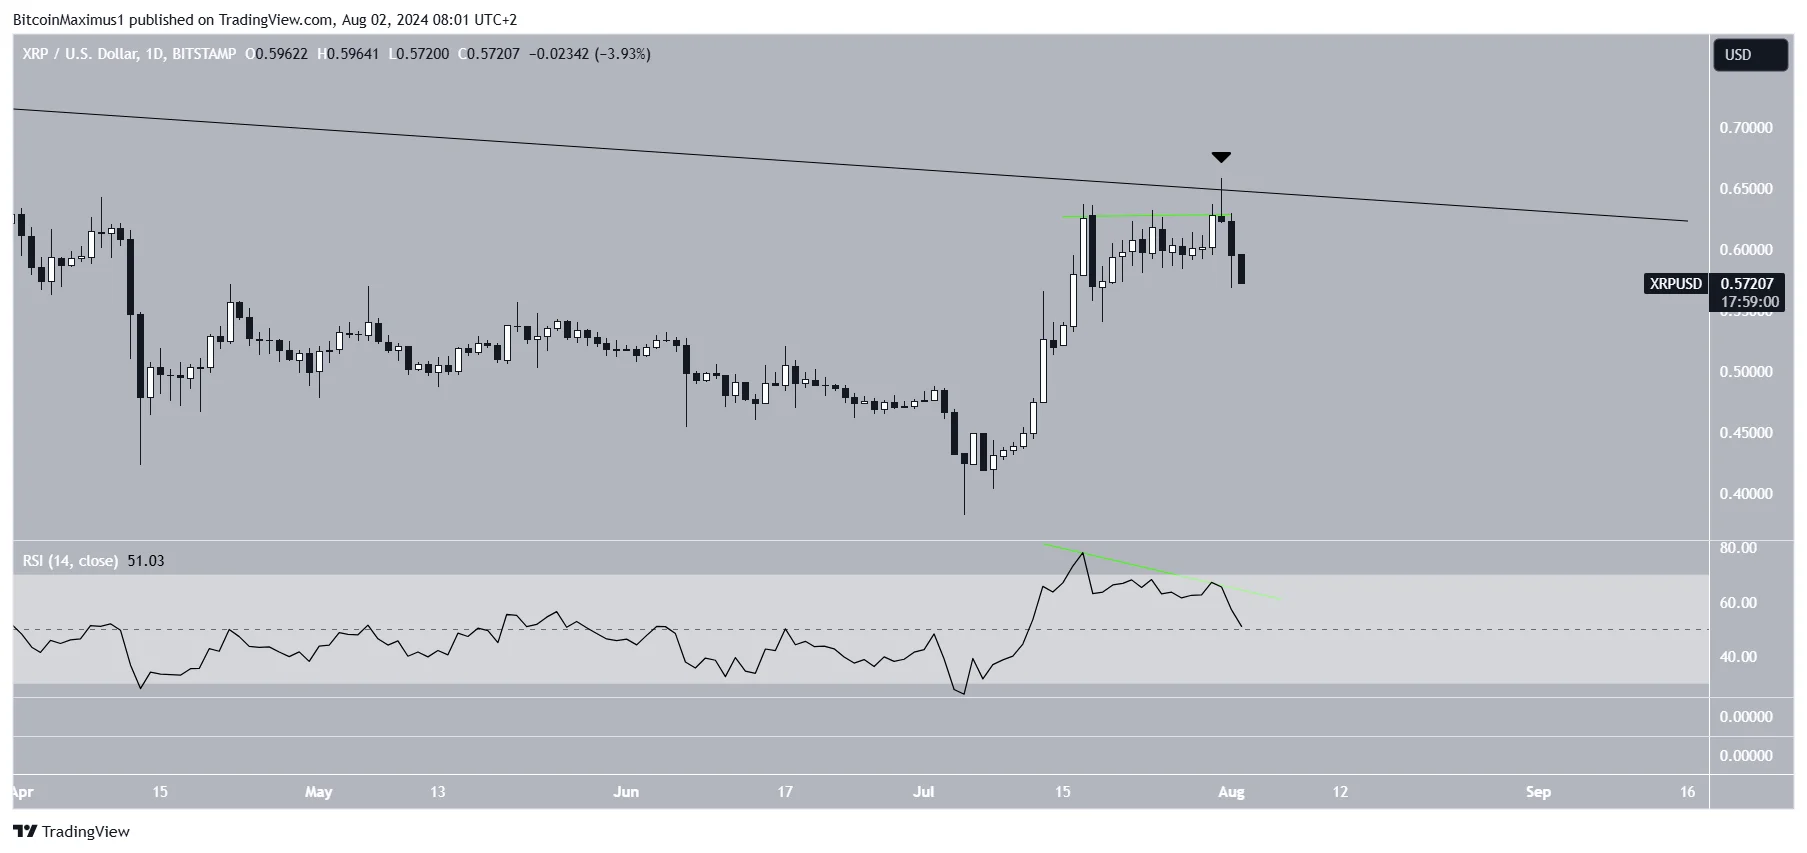
XRP initiated an uptrend on July 5, which gained momentum over the next several weeks. However, this upward movement was brought to a halt on July 31, as the price faced resistance at a 386-day trend line.
Despite attempting to break through this barrier, it was ultimately unsuccessful, with Ripple printing a long upper wick and a brief deviation above the July 18 high.
This failed breakout attempt is a concerning sign, as it suggests that the upward momentum may be losing steam.
Additionally, XRP’s bearish price action was reinforced by a bearish divergence in the RSI, which strengthens the case for a reversal in the upward trend.
These technical indicators suggest that the upward movement may have run its course, and a downturn is likely underway.
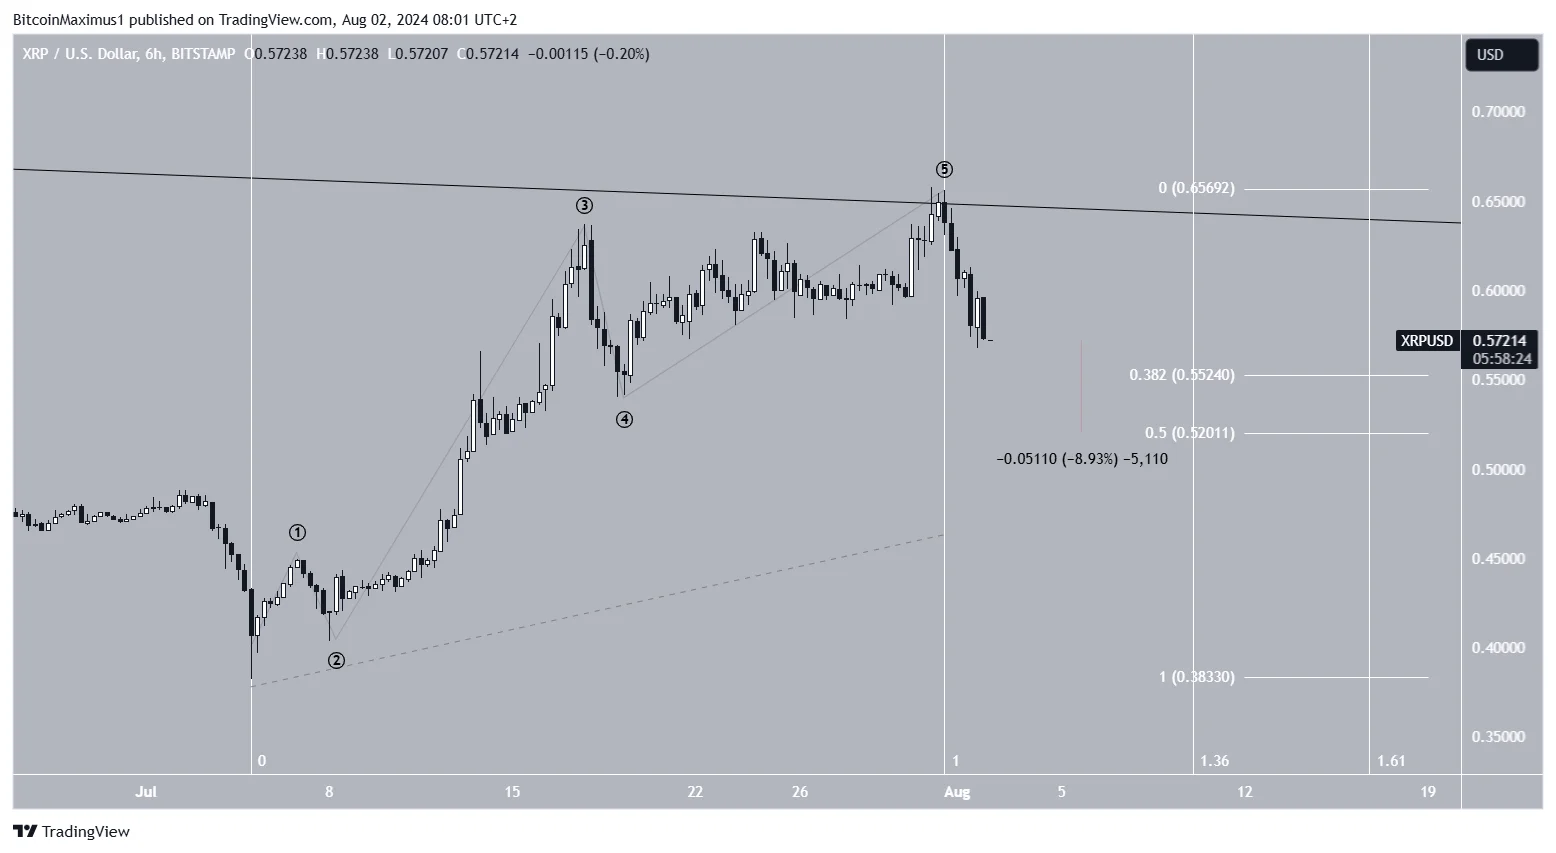
Should this bearish scenario plays out, XRP could continue to decline towards the $0.52-$0.55 support area, which is underpinned by the 0.382-0.5 Fibonacci retracement levels.
A fall to this range would represent a decline of approximately 9%, with the exact magnitude depending on whether the price bottoms out in the upper or lower portion of this support zone.
Using the length of the five-wave increase that started on July 5, XRP could likely bottom out between Aug. 10 and Aug. 16. If this decline is corrective, the XRP price could then make another attempt at breaking out from the long-term descending resistance trend line.
XRP Price Bounces at Long-Term Support – Attempts Breakout
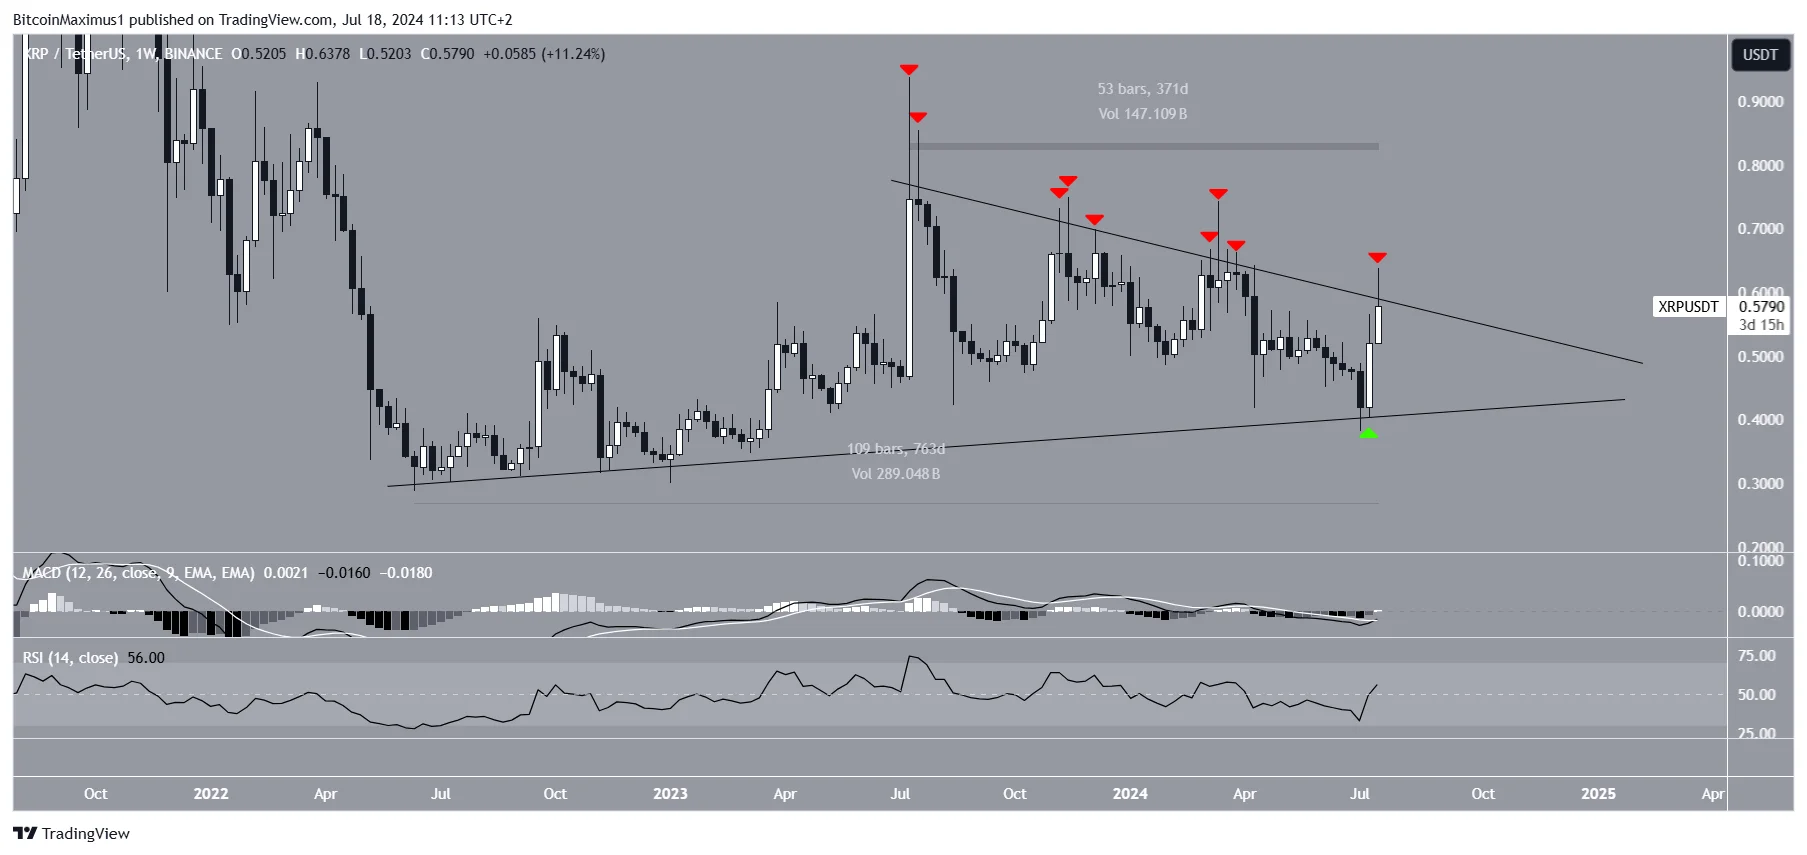
Since July 2023, XRP has been confined by a descending resistance trend line, which has led to multiple rejections (indicated by red icons) and the formation of long upper wicks, typically indicative of selling pressure.
However, it’s worth noting that the more times a resistance level is tested, the weaker it tends to become. In the case of XRP, this repeated testing of the trend line increases the likelihood of a potential breakout.
Additionally, last week’s price bounce successfully validated a long-standing support area, which has been in place for 763 days, thereby maintaining the overall bullish structure of the market.
The formation of a bullish engulfing candlestick pattern (marked by a green icon) on the weekly chart provides additional reinforcement for this optimistic scenario.
Still, technical indicators do not confirm whether XRP will break out. While the RSI has given a bullish signal by increasing above 50 numerous times in the past year and has not yet led to a breakout. Similarly, MACD’s bullish cross has been an untrustworthy signal.
Consequently, to determine whether a breakout will happen, we need to look at a lower time frame and incorporate the wave count.
Has XRP Started an Upward Trend?
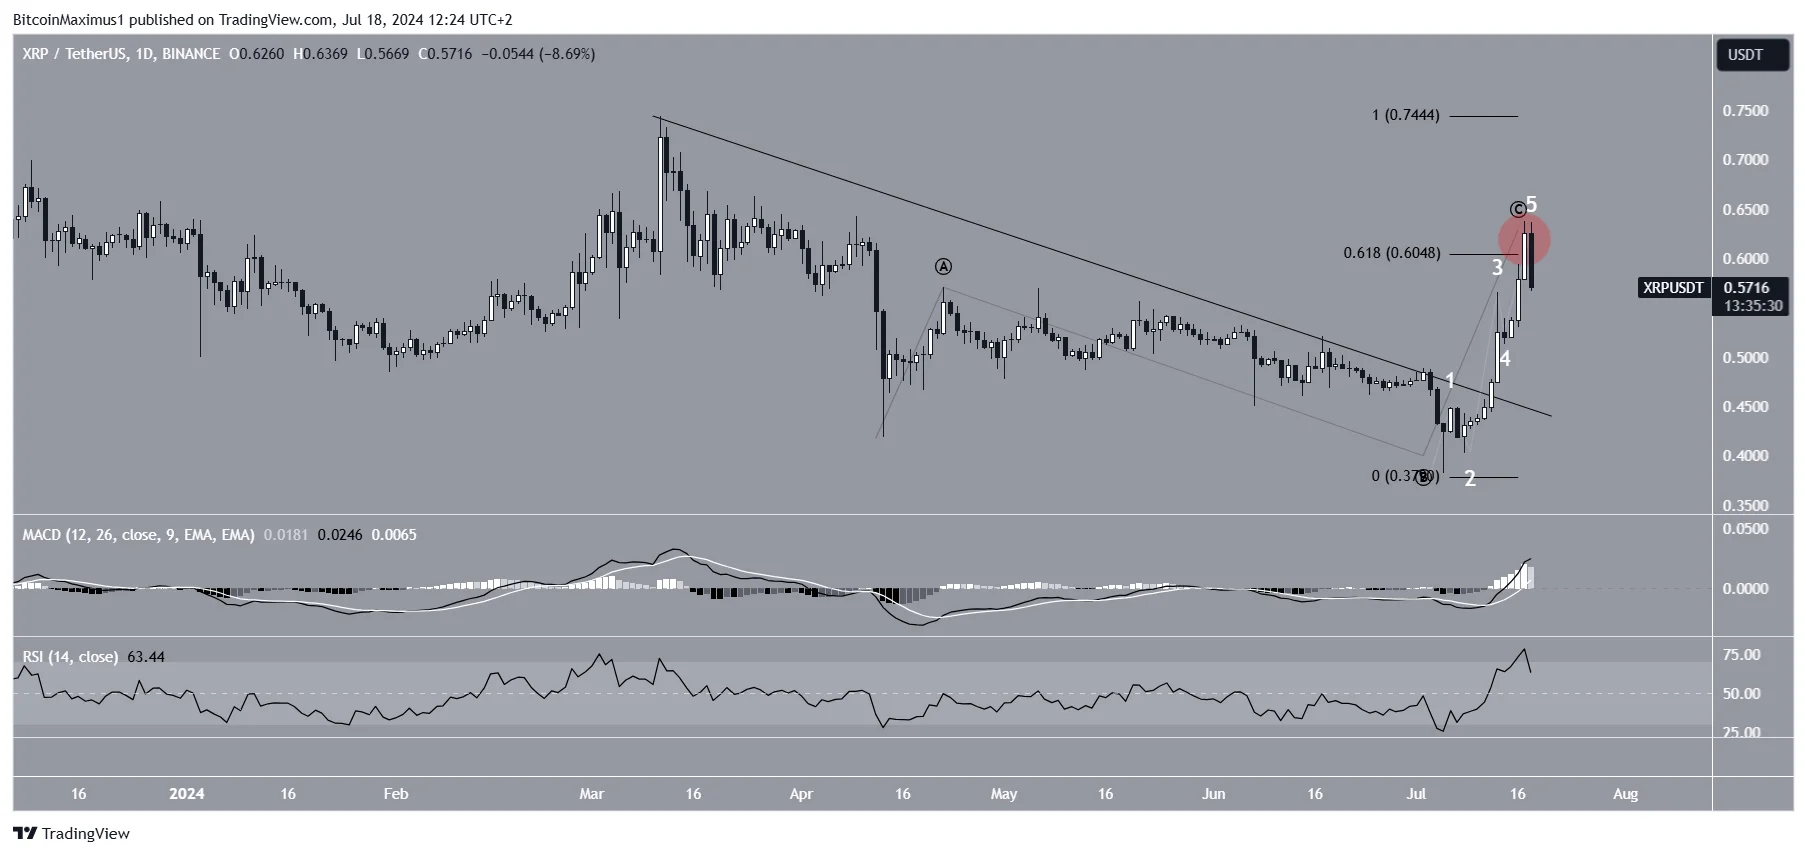
The daily time frame XRP price chart leans in a more bullish direction, though it does not confirm a reversal.
A bullish outlook rests on the breakout from a descending resistance trend line and the RSI and MACD readings. Interestingly, both indicators have moved above their bullish thresholds at 50 and 0, respectively.
However, despite the promising signs, the XRP price faced a setback after breaking out, as it was rejected by the 0.618 Fibonacci retracement resistance level on July 18 (indicated by a red circle).
This rejection raises the possibility that the recent increase may be nothing more than a relief rally, rather than a sustained upward trend.
Additionally, there is still some ambiguity surrounding the larger market structure, as it is unclear whether the price action since April constitutes a corrective A-B-C structure (indicated by the black labels), or if XRP has actually begun a new five-wave impulsive increase that started in July (indicated by the white labels).
XRP Price Prediction: Consolidation Could End Soon
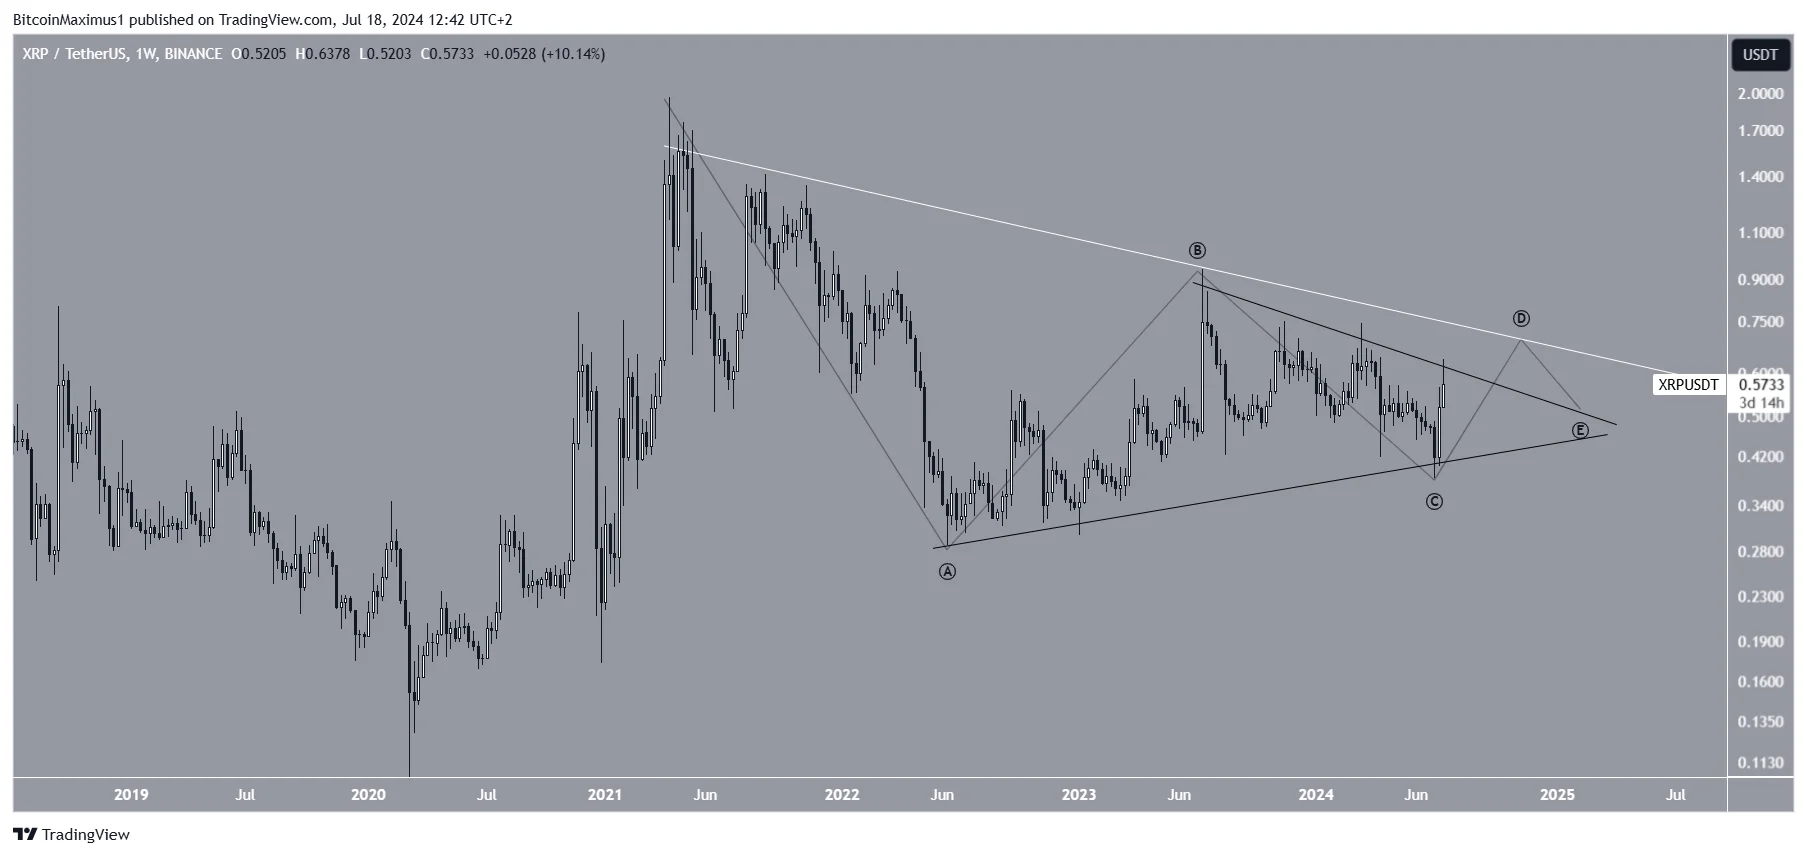
According to the long-term wave count, a breakout from the resistance trend line is anticipated to happen soon. This expectation is based on the likelihood that the entire decline since April 2021 is an A-B-C-D-E corrective structure (indicated by the black labels). If this analysis is correct, XRP is currently completing wave D.
The projected path forward suggests that XRP will break out from the short-term descending resistance trend line (also in black), which coincides with the long-term trend line.
Following the breakout, wave E is expected to unfold, during which the price will likely validate the short-term resistance level before ultimately giving way to an upward movement.
If this is the correct count, XRP will ultimately increase above the 2021 high of $1.97. On the other hand, a breakdown from the long-term ascending support trend line will invalidate this bullish count.
XRP Fails to Break Out From Resistance
While the XRP price increase in July was impressive, its struggle to break out from the resistance trend line has raised doubts about whether the price has already reached its local top.
Furthermore, when considering the weakness evident in lower time frames, it is possible that the XRP price could experience a decline in the first half of August. This potential downturn could ultimately set the stage for another attempt at breaking out from the resistance trend line, as the underlying bullish structure remains intact.
Disclaimer:
The information provided in this article is for informational purposes only. It is not intended to be, nor should it be construed as, financial advice. We do not make any warranties regarding the completeness, reliability, or accuracy of this information. All investments involve risk, and past performance does not guarantee future results. We recommend consulting a financial advisor before making any investment decisions.
Valdrin Tahiri is a cryptocurrency analyst and reporter at CCN, specializing in technical analysis with a focus on Elliott Wave theory, on-chain metrics, and fundamental research. He brings over seven years of experience in the crypto space as both a trader and writer.
He discovered cryptocurrencies in 2017 while earning his MSc in Financial Markets at the Barcelona School of Economics, which sparked a deep interest in blockchain and market dynamics. Since then, he’s contributed to top crypto outlets like BeInCrypto and CoinGape.
Valdrin also served as Community Manager of BeInCrypto’s Telegram group for three years, helping grow it into one of the largest crypto communities worldwide. His expertise in market structure and price patterns allows him to break down complex trends into clear, actionable insights.
He’s published thousands of articles covering altcoins, Bitcoin cycles, and macro trends.