XPIN crypto surges, breaking key resistance before retracing to $0.0025 | Credit: Veronica Cestari
Share
Key Takeaways
XPIN doubled in 24 hours, hitting a new all-time high at $0.0029 before retracing.
The token’s price broke a symmetrical triangle with rising volume driving momentum.
Overbought signals suggest a short-term pullback toward $0.0019 if momentum fades.
The price of XPIN, the native token of the XPIN Network, has hit a new all-time high after its price doubled in the last 24 hours.
Following the move, the XPIN price reached $0.0029 before retracing to $0.0025.
Behind this rally lie many questions that need answers.
Is the run fueled by fundamentals or hype? Can XPIN price maintain support at this level?
Additionally, what resistance zones might hinder its progress? In this analysis, CCN reveals what led to the milestone and what lies ahead for the cryptocurrency.
XPIN Symmetrical Triangle Break Confirmed
For those unfamiliar, XPIN Network is a BNB-Chain DePIN project focusing on AI-powered decentralized connectivity. Up until Oct. 16, the cryptocurrency’s price was $0.0013.
But this changed yesterday as the XPIN price exploded by 100% within 24 hours.
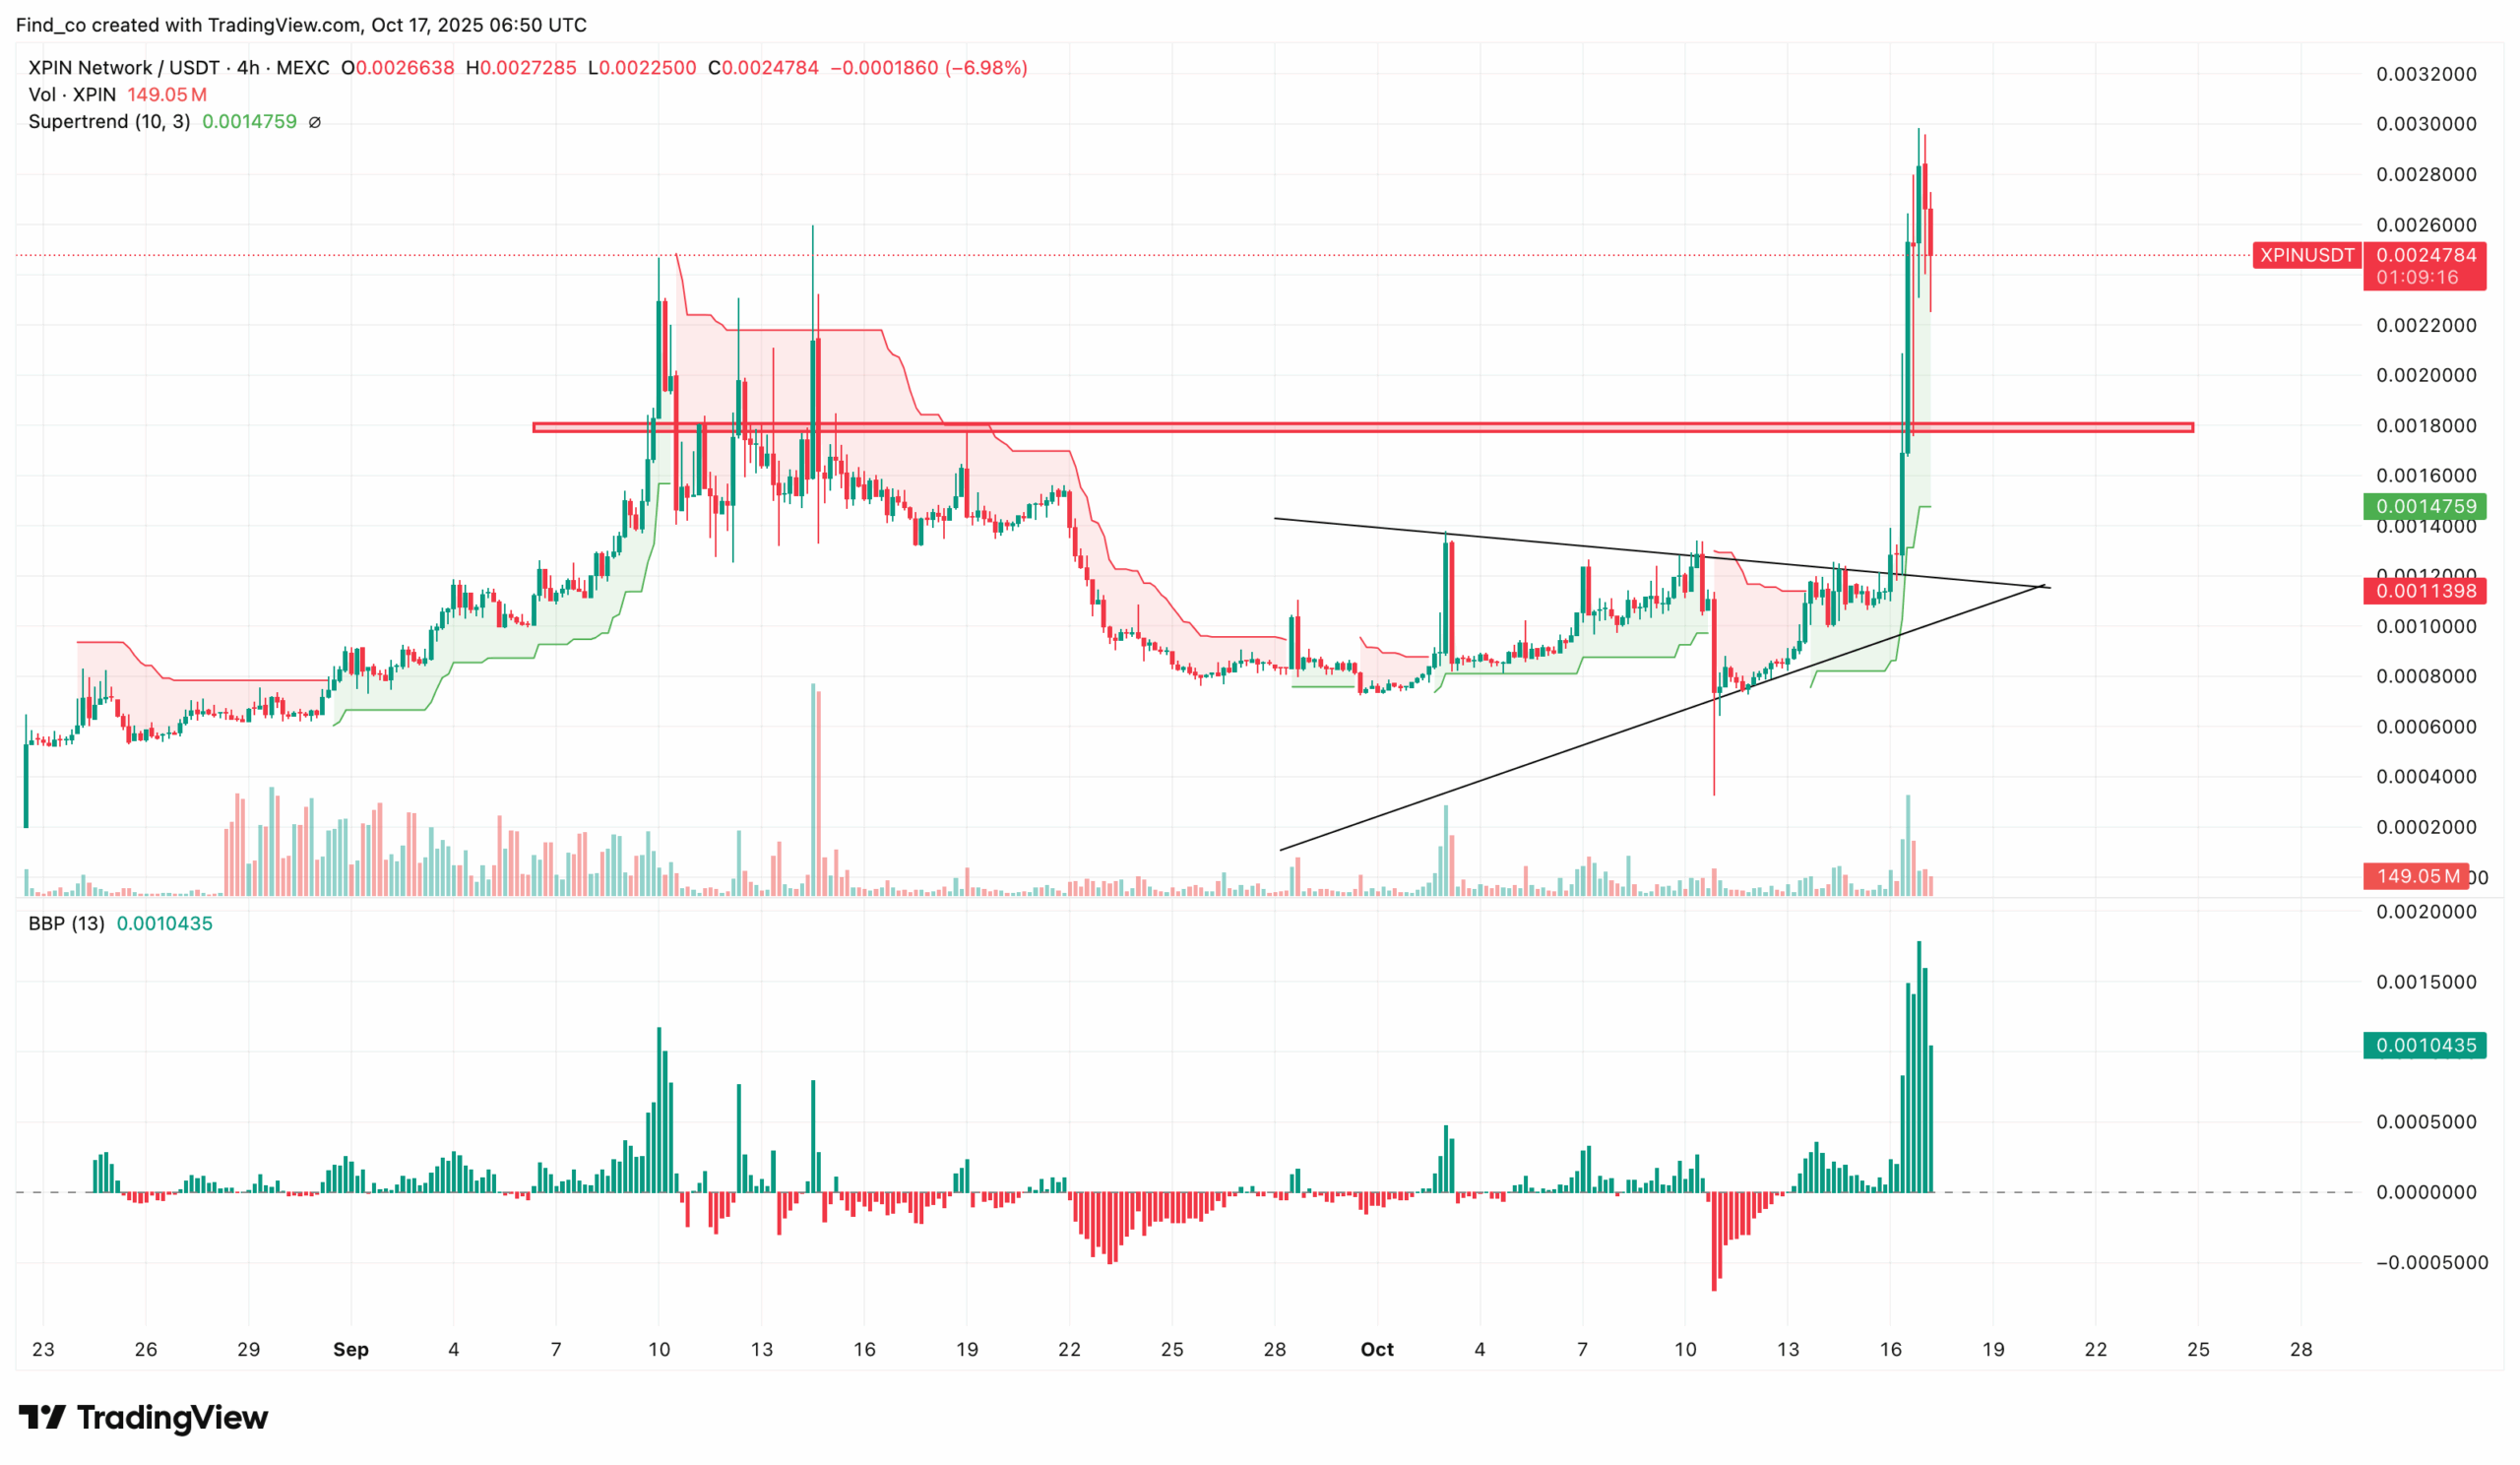
According to CCN’s findings, XPIN’s price reached a new all-time high after it broke above the upper trendline of a symmetrical triangle.
Get These Top Crypto Casino Offers Now!
Sponsored
Disclosure
We sometimes use affiliate links in our content, when clicking on those we might receive a commission at no extra cost to you. By using this website you agree to our terms and conditions and privacy policy.
As seen below, bulls played a huge role in this surge. Specifically, the Bull Bear Power (BBP) printed consecutive green histogram bars.
This helped the altcoin to breach the critical resistance zone at $0.0018. At the same time, the green line of the Supertrend is positioned below the price, while providing support for the breakout.
However, it appears that XPIN has faced another resistance at $0.0029. To clear this hurdle, bulls need more firepower, but this does not appear to be forthcoming in the short term.
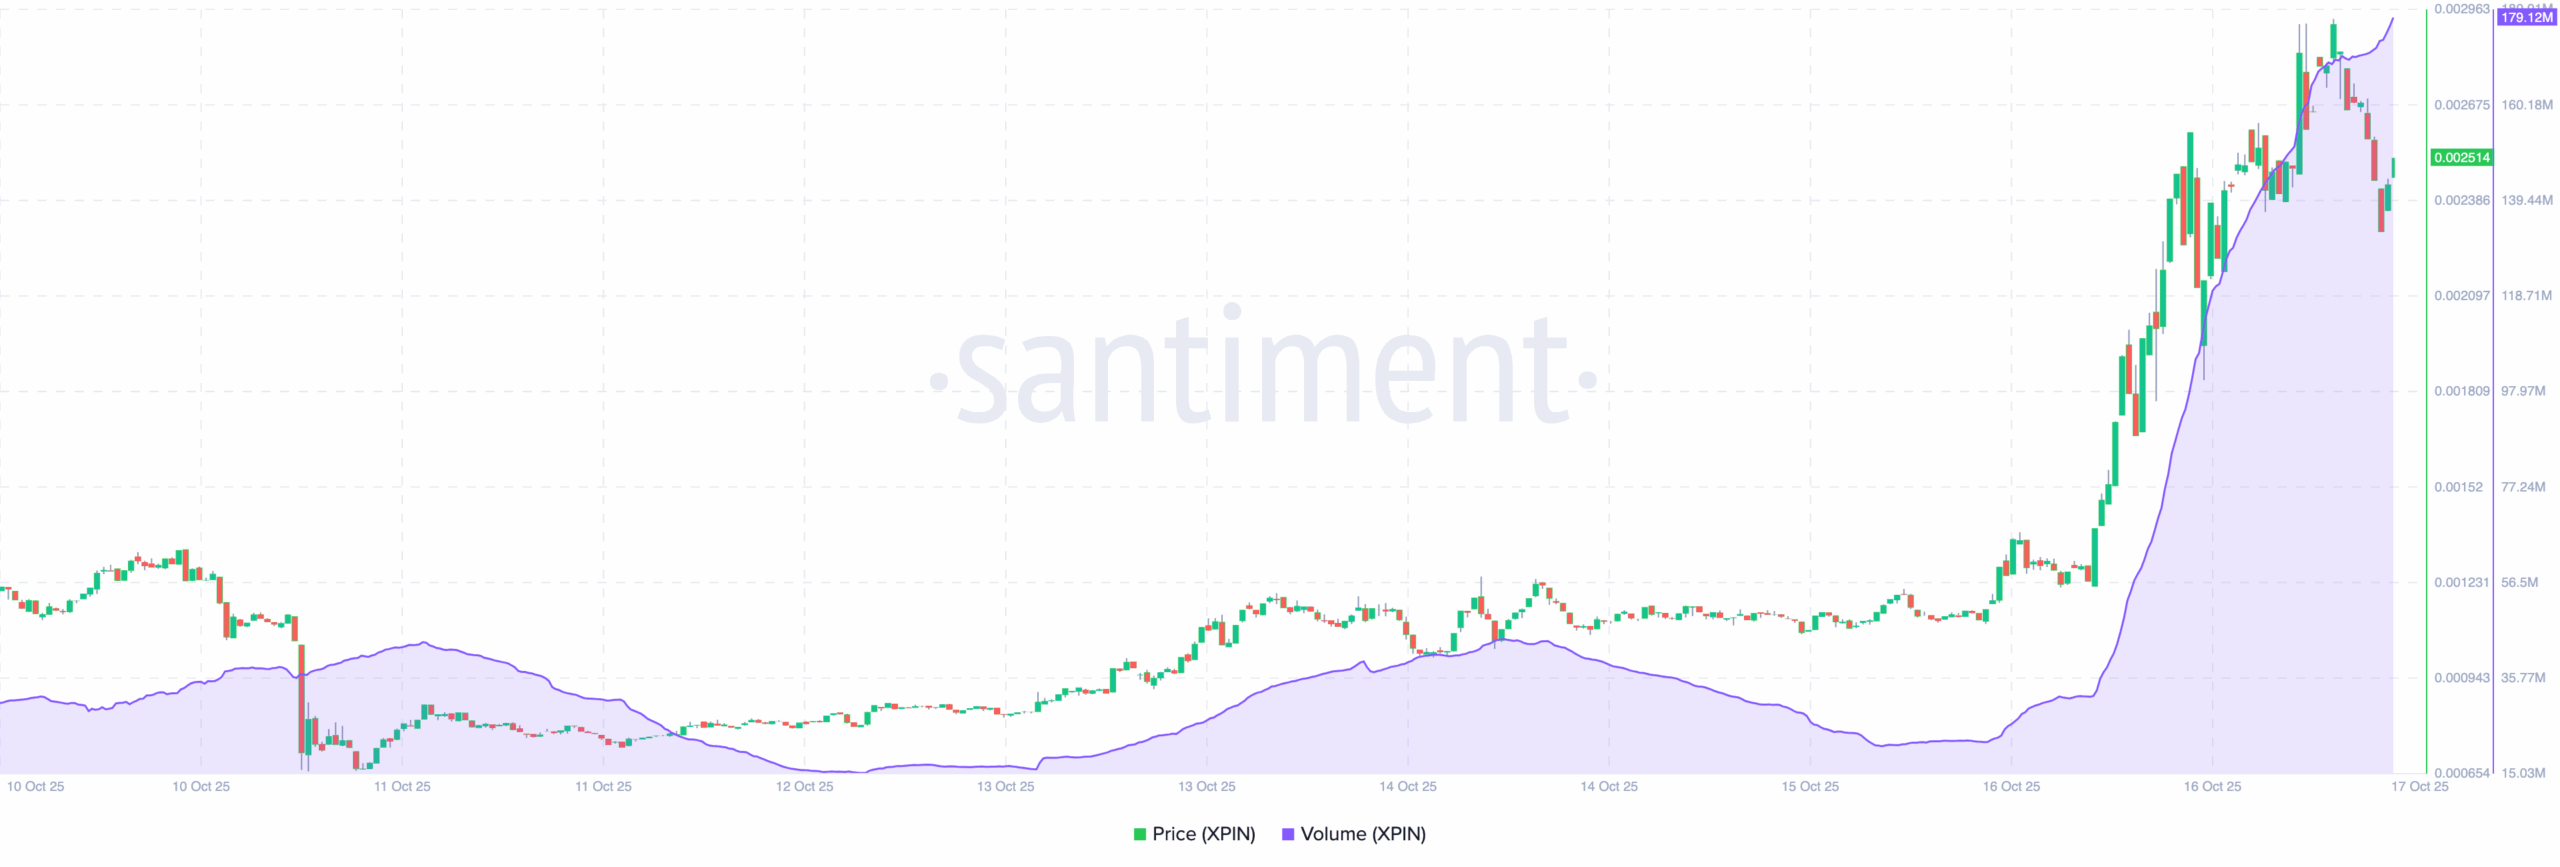
Besides that, the trading volume also appeared to impact the price increase. According to Santiment, the XPIN trading volume on Thursday, Oct. 16, was around $20 million.
As of this writing, it has increased to $179.12 million.
A nearly 9x increase in trading volume signifies a notable rise in market participation. When volume spikes alongside price, it usually signals genuine buying momentum rather than speculative noise.
If this elevated volume persists over the next few days, XPIN’s price could sustain its current uptrend and potentially test higher resistance levels.
However, XPIN’s price has dropped. Therefore, if the volume rises, it could strengthen the downtrend, potentially leading to a temporary correction before another leg higher.
Interestingly, some other analysts appear to share a similar view. One pseudonymous handle on X noted that the recent surge might have formed a double top that could lead to a notable correction.
“Looks like a double top and bull trap here. Bulls need to break above ATH levels, otherwise the pullback could be EPIC,” The analyst stated.
XPIN Price Prediction: Pullback Imminent
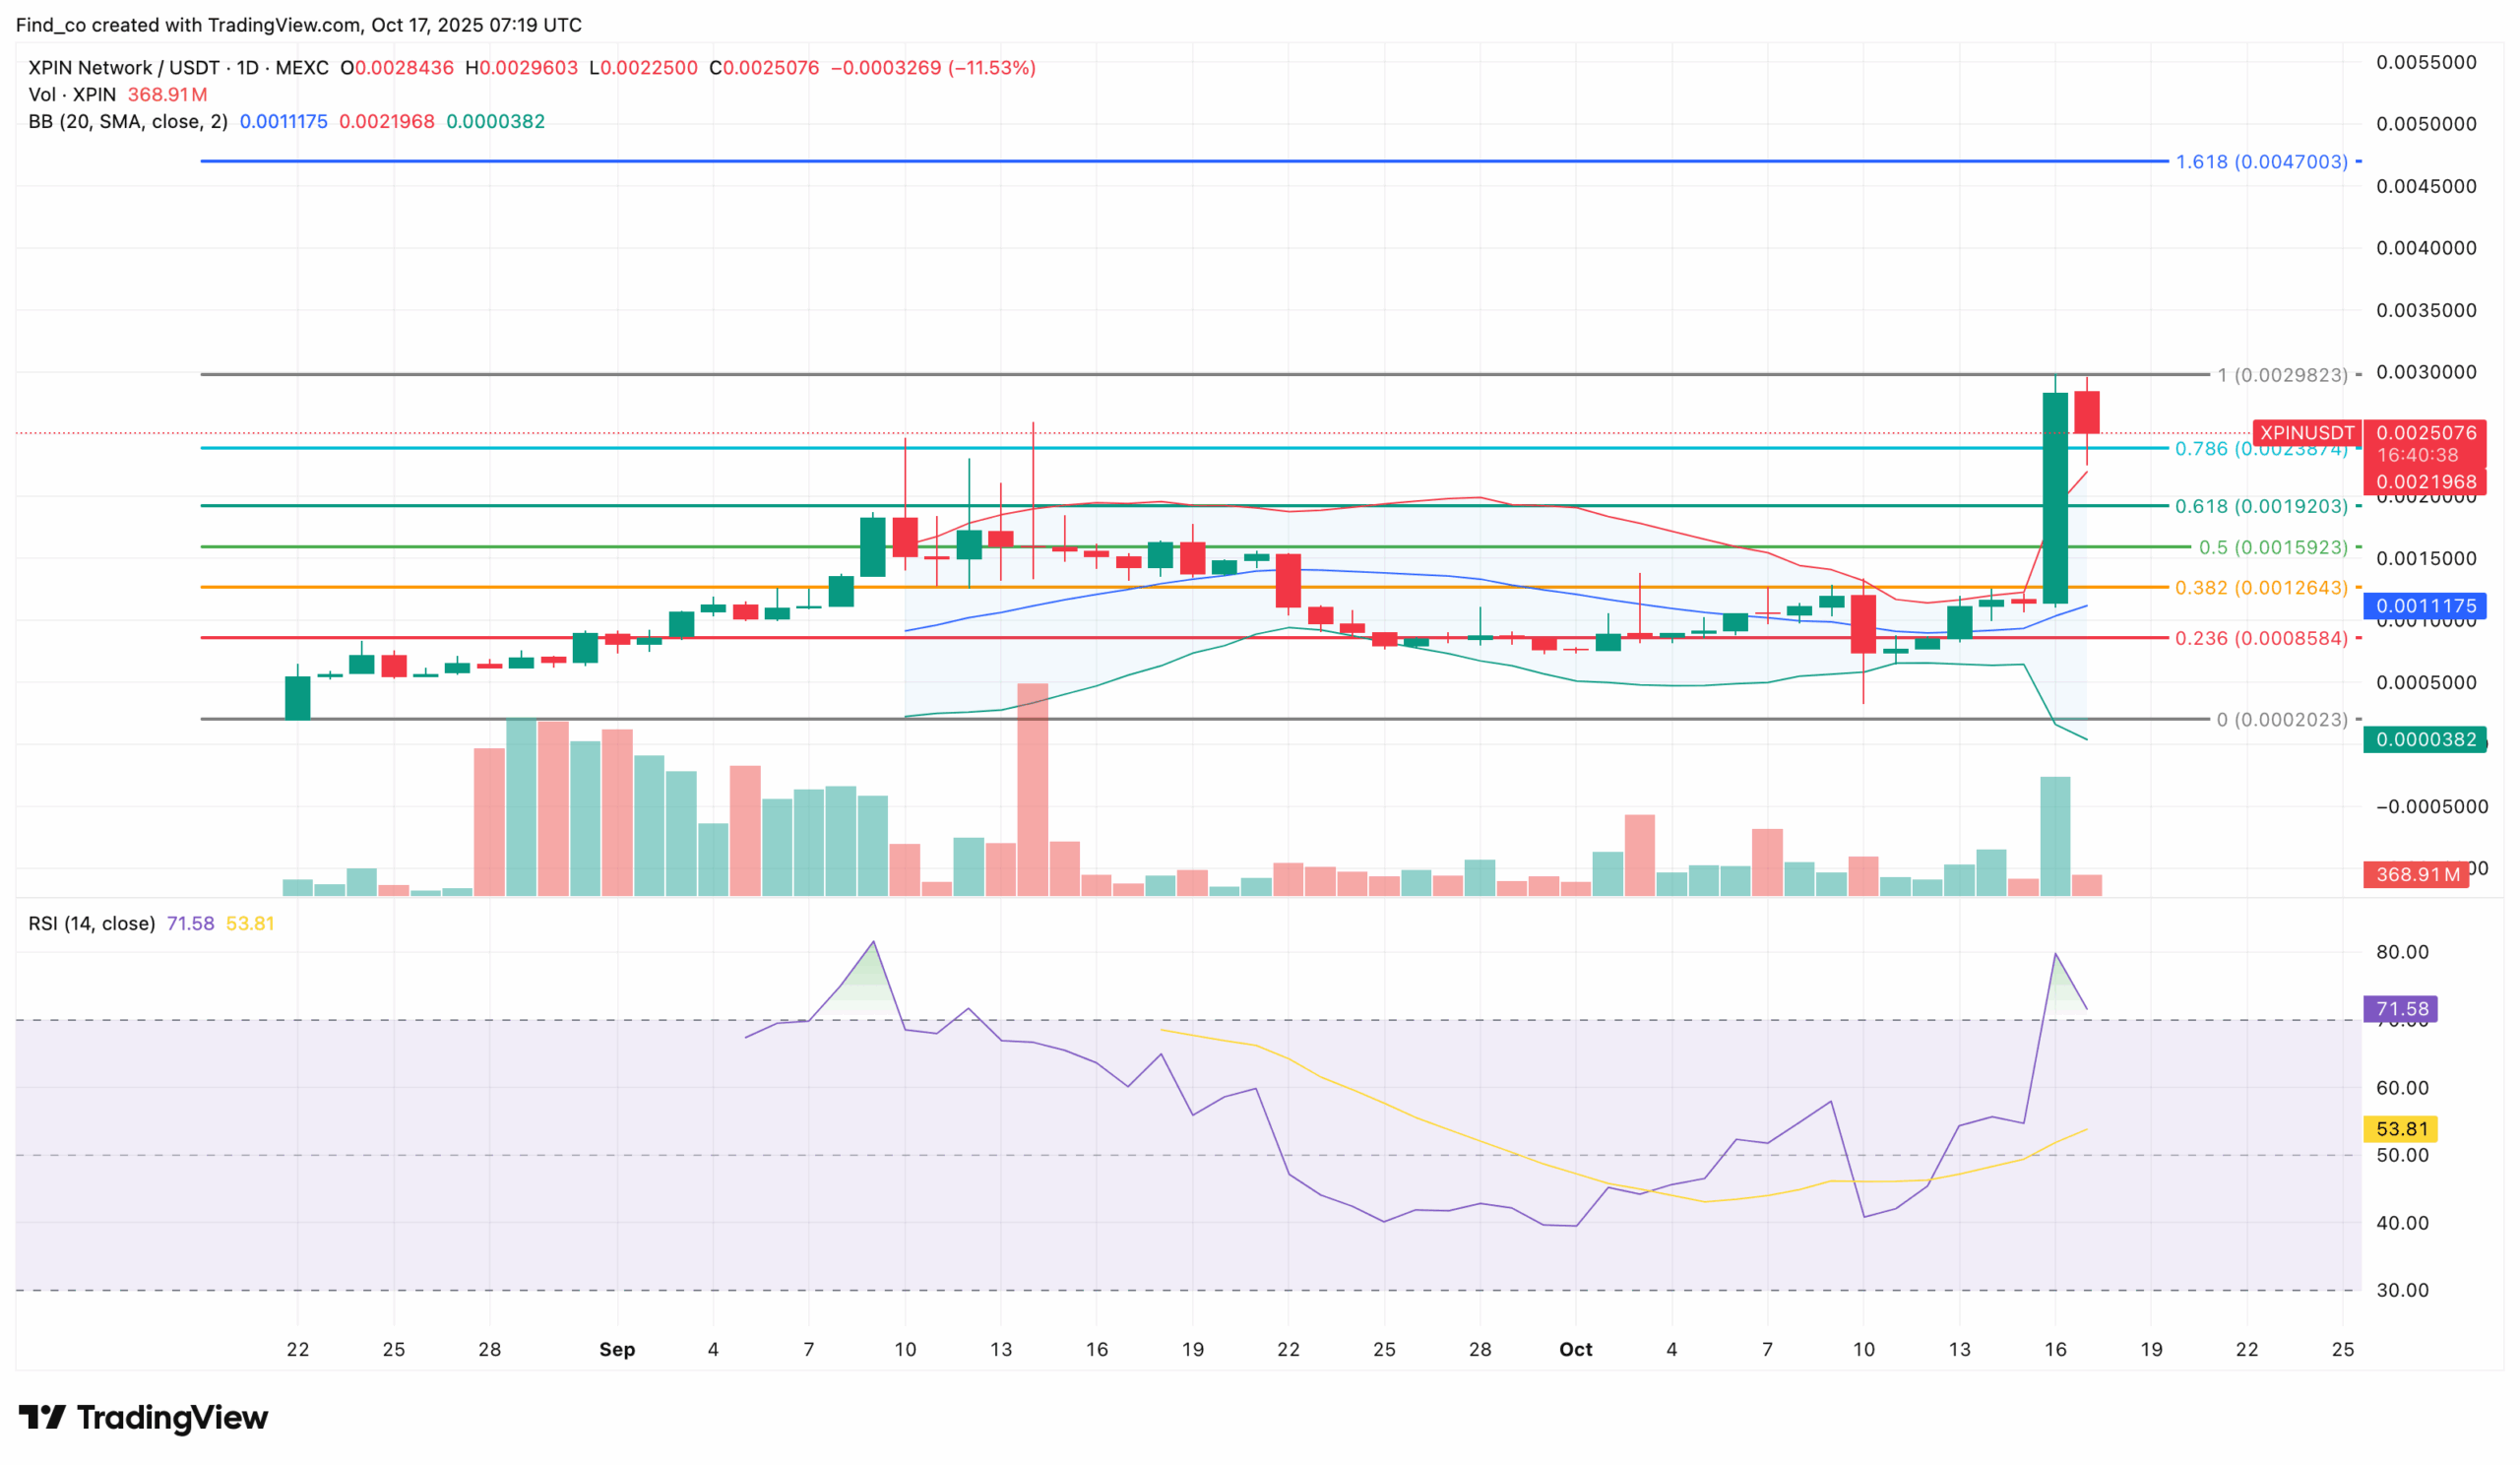
On the daily chart, XPIN’s price is struggling to break past its all-time high, facing visible resistance near that level.
The Bollinger Bands (BB) have widened considerably, signaling heightened volatility.
However, the upper BB line has touched the price, a sign that XPIN may be entering overbought territory.
The Relative Strength Index (RSI) echoes this view. It recently crossed into the overbought zone before bending downward, hinting that buying momentum is cooling off.
If this pullback persists, XPIN risks slipping below the immediate support level at $0.0024. A confirmed breakdown could expose the token to the $0.0019 zone.
Disclaimer:
The information provided in this article is for informational purposes only. It is not intended to be, nor should it be construed as, financial advice. We do not make any warranties regarding the completeness, reliability, or accuracy of this information. All investments involve risk, and past performance does not guarantee future results. We recommend consulting a financial advisor before making any investment decisions.
Victor Olanrewaju is a crypto analyst and reporter at CCN with deep roots in on-chain research and technical analysis. His crypto journey began in 2017, but it was the 2020 Uniswap airdrop that sparked a full-time pivot into the space.
With a foundation in copywriting, Victor honed his craft creating high-converting content for leading crypto brokers — most notably an XRP price prediction that ranked #1 on Google during the 2021 bull run.
He later joined AMBCrypto in 2022, where he combined storytelling with technical and on-chain analysis to cover key market narratives.
In 2024, he expanded his expertise at BeInCrypto, collaborating with analysts and using tools like Glassnode, Santiment, and IntoTheBlock to break down Bitcoin and altcoin trends.
At CCN, Victor covers the top cryptocurrencies, memecoins, macro shifts, blending real-time insights with deep-dive metrics.
He holds a Bachelor’s degree in Physics from the University of Ibadan, equipping him to simplify complex data for a wide audience. Follow his work or connect on LinkedIn or X.