Learn why MARA’s pivot to AI and RIOT’s energy infrastructure are protecting them from the current crypto collapse | Credit: Hameem Sarwar
Share
Key Takeaways
MSTR’s leveraged treasury model is in trouble, resulting in a 0.7x price-to-NAV ratio.
MARA and RIOT are showing relative strength by diversifying into AI and energy services.
Indicators for MARA show a bullish divergence, while RIOT has formed a MACD crossover.
MicroStrategy (MSTR) is imploding. The stock has crashed 62% over the past year and plunged 28% in the last month alone as Bitcoin (BTC) trades below the company’s $76,052 average cost basis.
With $12.44 billion in Q4 2025 losses and Bitcoin briefly falling below $65,000, MSTR’s leveraged treasury model is facing its toughest test yet.
But here’s the twist. While MicroStrategy bleeds, three other crypto stocks — MARA Holdings (MARA), Riot Platforms (RIOT), and the Global X Blockchain ETF (BKCH), are showing surprising resilience.
In this analysis, CCN explains why this is the case and what lies ahead for the crypto stocks.
The company holds 713,502 BTC, worth $59.75 billion, with a cost basis of $54.26 billion, essentially underwater despite being one of the largest corporate Bitcoin holders in the world.
The problem is leverage.
MicroStrategy funded its Bitcoin buying spree with over $8.2 billion in convertible debt and $7.5 billion in preferred stock.
When Bitcoin falls below the company’s average purchase price, the premium to net asset value (NAV) evaporates. MSTR now trades at a 0.7x price-to-NAV ratio.
That means the crypto stock is at a discount, not a premium.
Furthermore, this also matters because MicroStrategy’s growth strategy relied on issuing new shares at a premium to buy more Bitcoin.
With the premium gone, new issuance would be dilutive rather than accretive. The perpetual motion machine has stalled.
Why pay a premium for leveraged Bitcoin exposure when you can buy a spot ETF with zero debt and no dilution risk?
However, this seems different for other crypto stocks.
Why Crypto Mining Stocks Are Different
MARA Holdings and Riot Platforms operate completely different business models.
Unlike MSTR, which simply buys and holds Bitcoin, miners earn Bitcoin through network operations, and they’re pivoting hard toward diversification.
For MARA, it recently purchased $1 billion worth of Bitcoin and is targeting 75 exahash per second (EH/s) of mining capacity by end-2025.
But critically, the company is also moving into AI infrastructure and high-performance computing data centers. In January 2026, MARA announced its acquisition of a majority stake in Exaion, an AI and HPC data center operator.
As a result, the MARA price declined, undergoing an extended correction.
MARA Set for Recovery
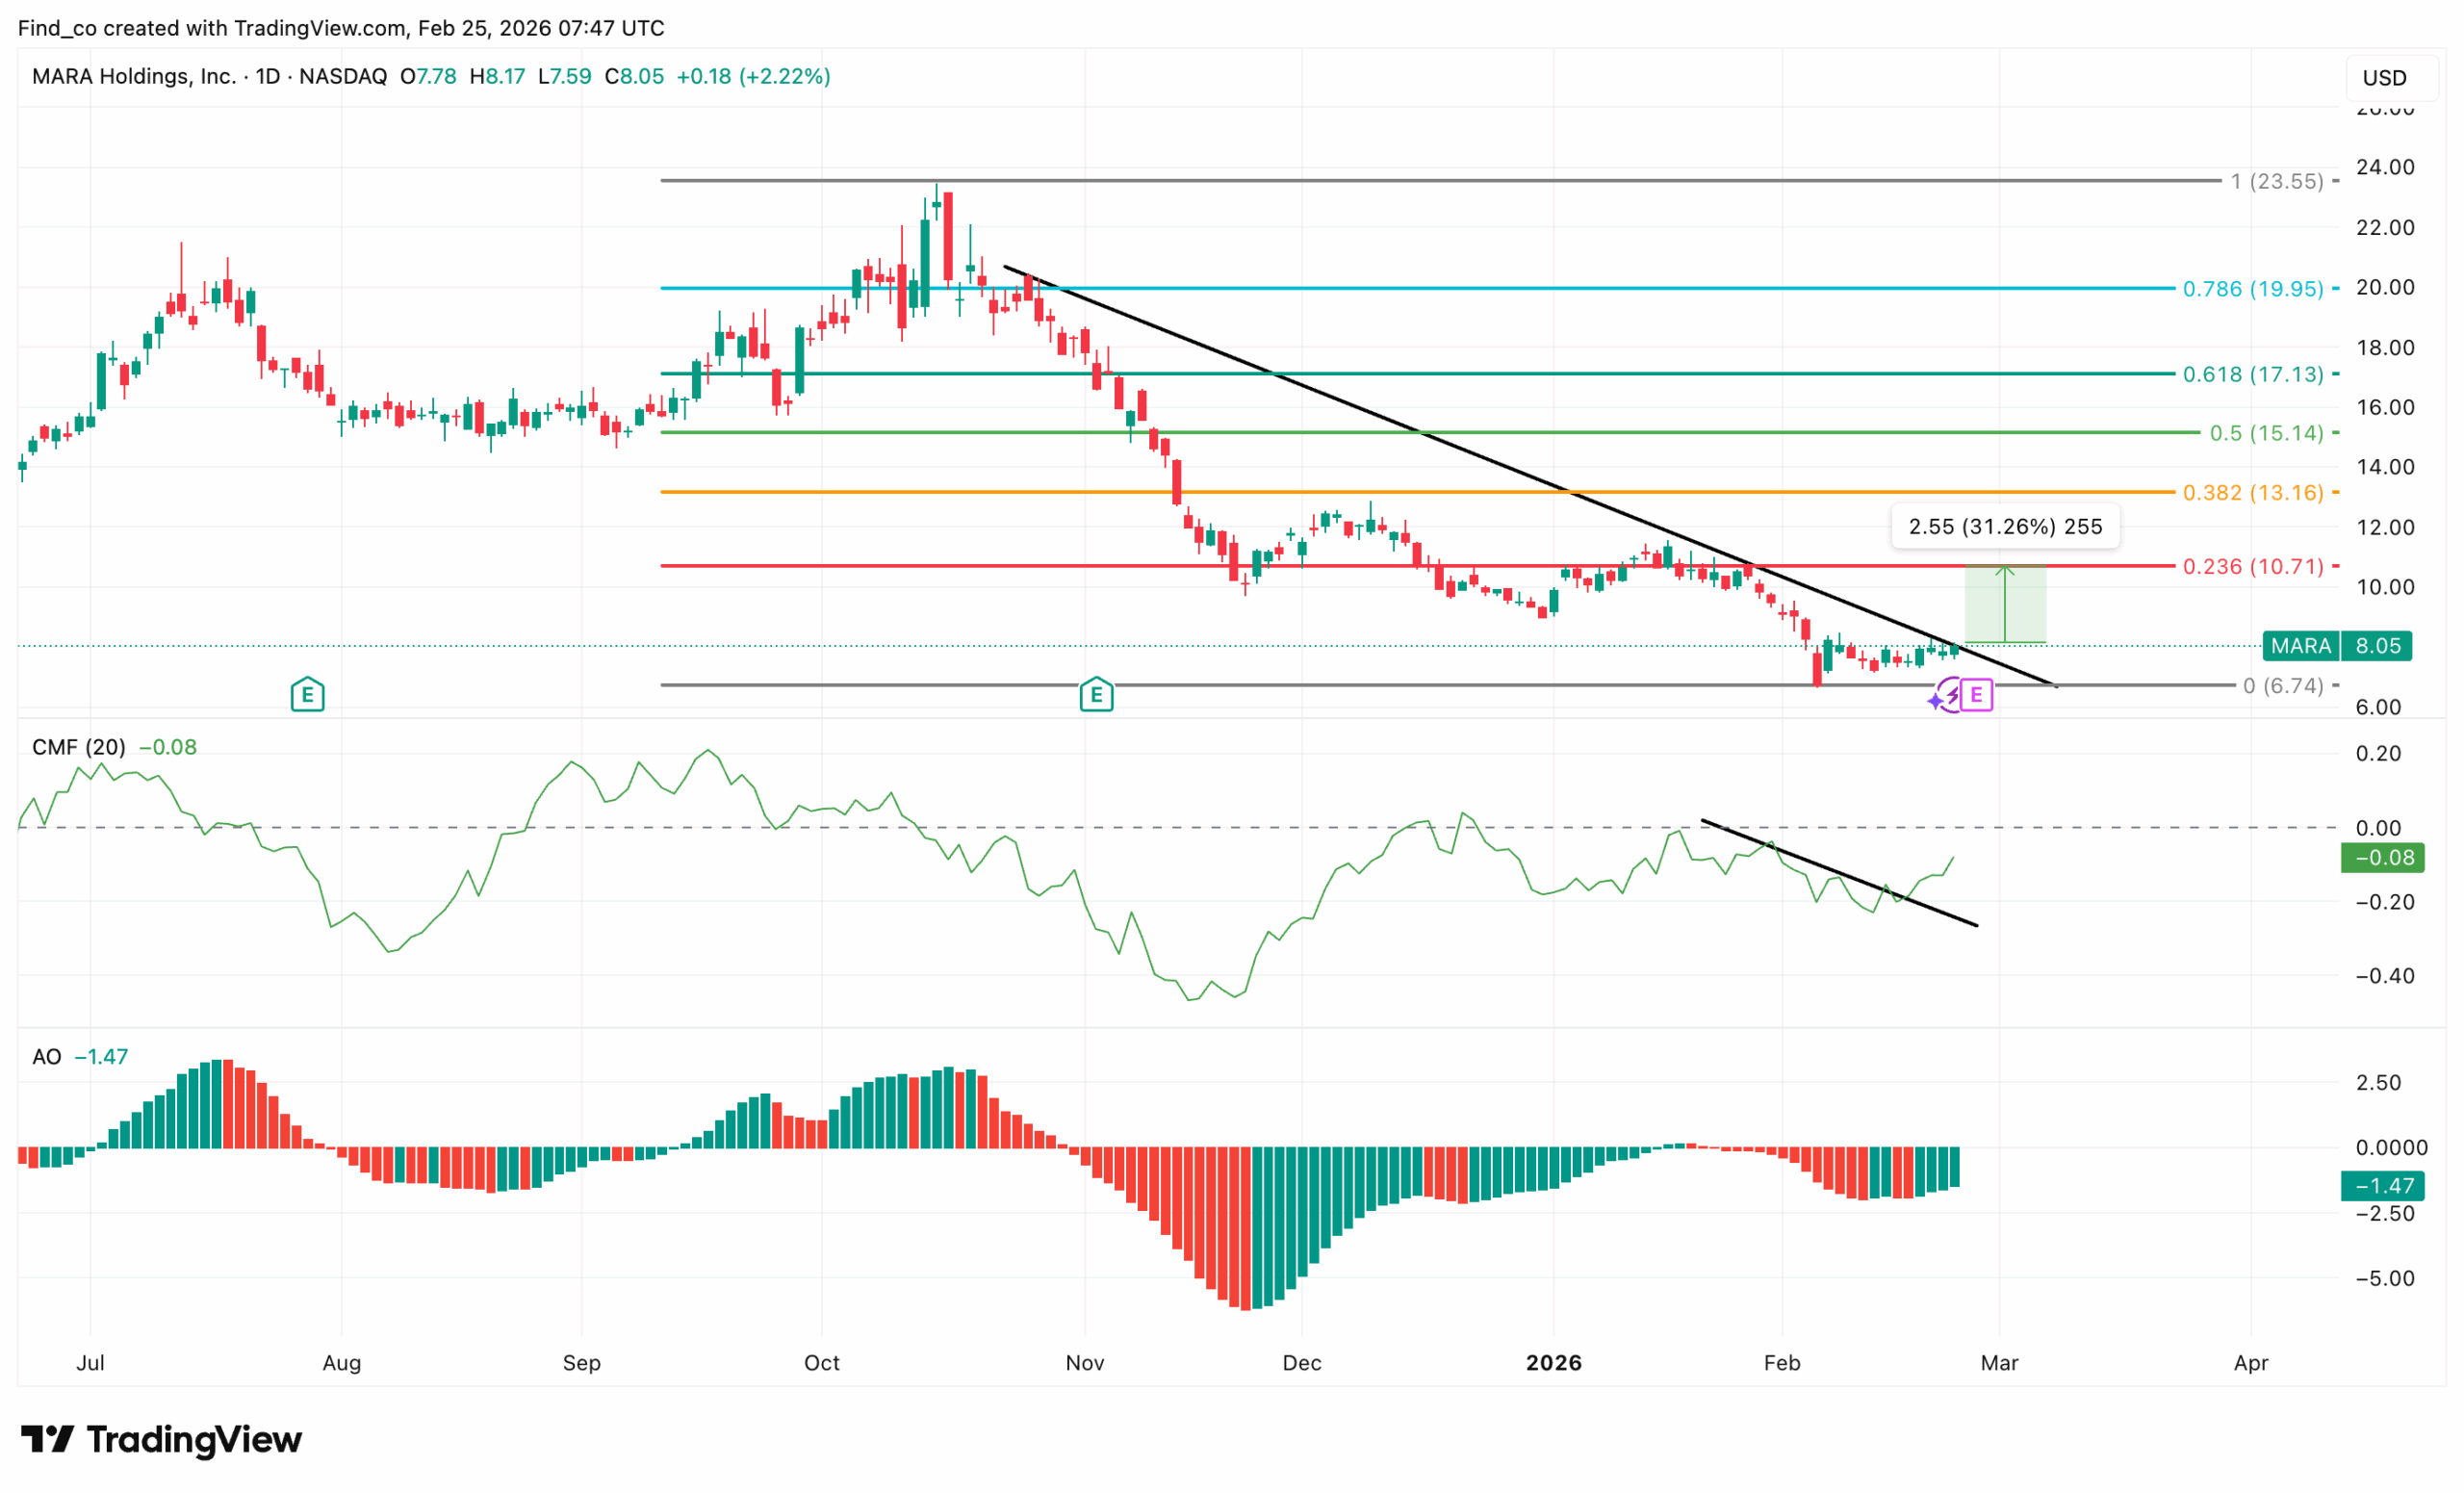
From a technical perspective, MARA Holdings is testing a critical support. Shares trade at $8.05, up 2.22% on the day, but still deep in a bear trend that has erased most of the stock’s 2025 gains.
The damage is significant. A descending trendline has capped every rally since the November peak near $23.55.
However, as of this writing, the MARA share price is flirting with the trendline and seems ready to breach it.
Price has cut through every Fibonacci retracement level (0.786, 0.618, 0.5, 0.382, and 0.236), and now sits just above the zero Fib at $6.74. That is the last line of defence.
Signs of life are emerging, however. A measured move target of +31.26% is annotated near the current price as the chart flags a potential bounce toward $10.71.
The Chaikin Money Flow (CMF) reads -0.08 but is diverging bullishly: price is making lower lows while CMF is rising.
In addition, the Awesome Oscillator (AO) at -1.47 remains negative. However, histogram bars are shrinking and turning green, indicating that bearish momentum is slowing.
Bulls need a daily close above $10.71 (0.236 Fib) to signal a genuine trend shift. Until then, any bounce risks being absorbed by the descending trendline overhead.
RIOT Price Sees Respite
Riot Platforms is following the same playbook. The company closed a $579 million debt offering in late 2024 to fund additional Bitcoin purchases.
However, it’s also building non-mining revenue streams through energy infrastructure and data center services.
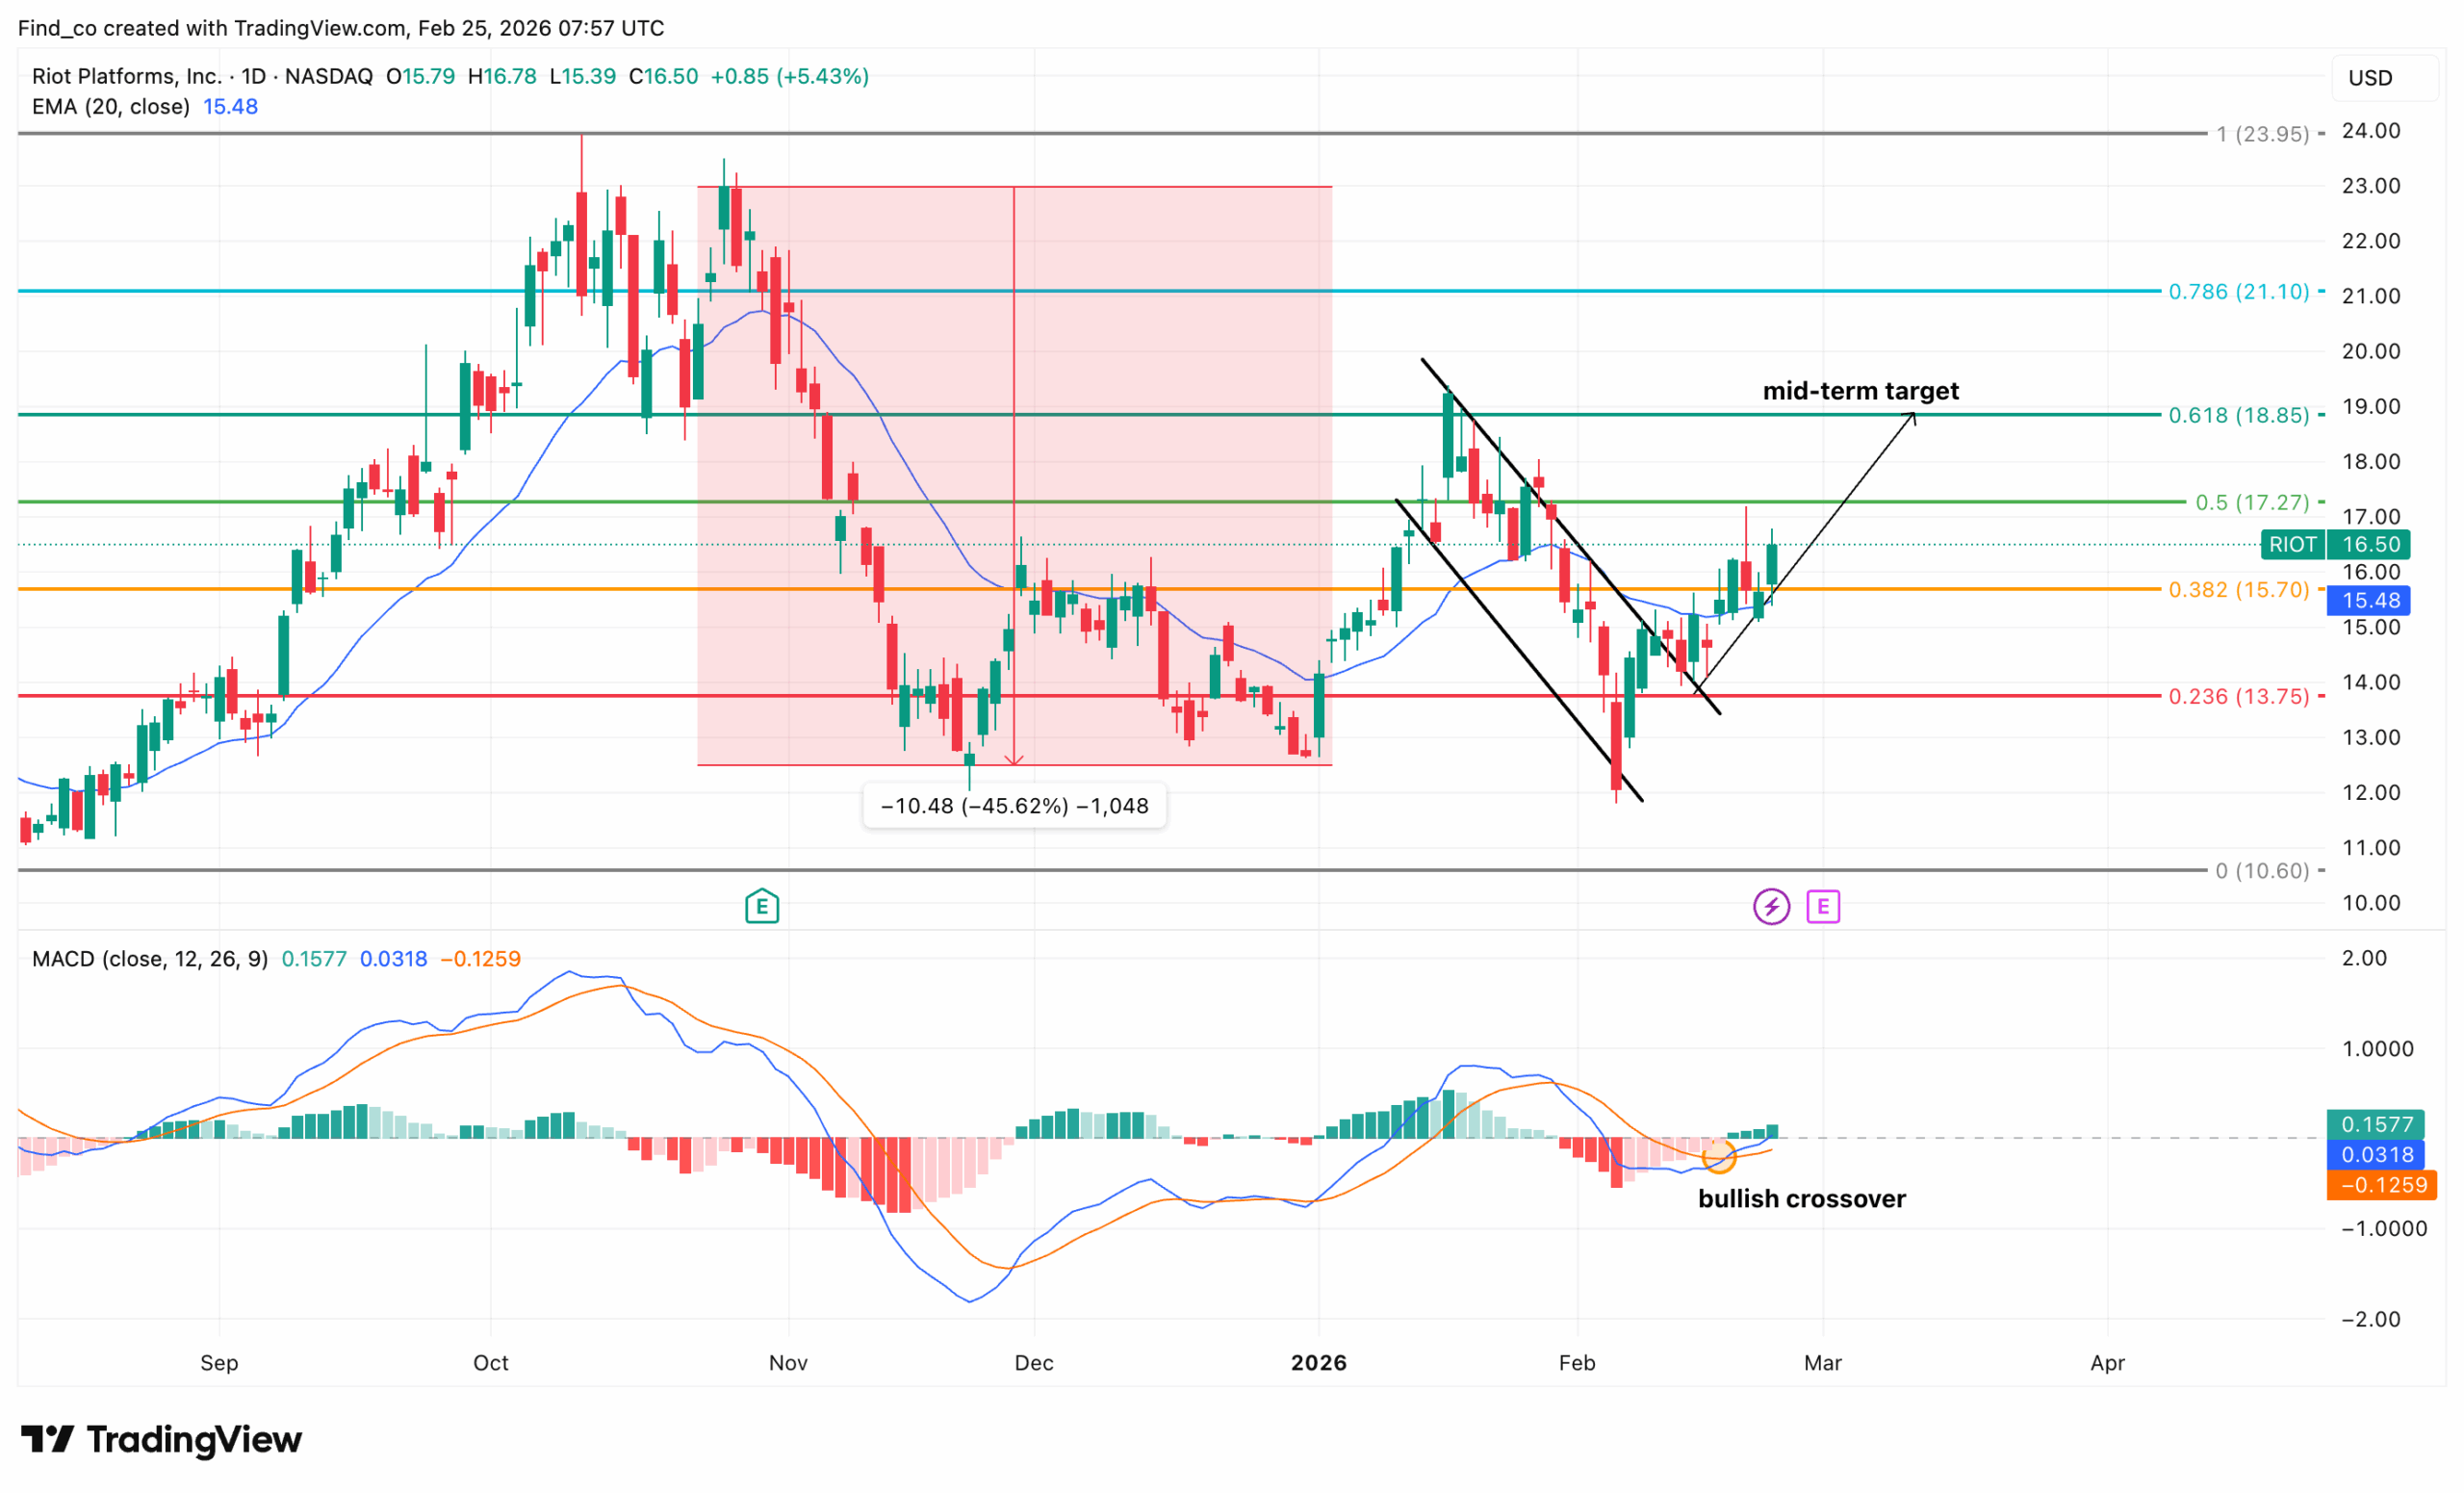
On the technical side, Riot Platforms is showing real signs of life. Shares trade at $16.50, up 5.43% on the day, and have broken above the 20-EMA ($15.48) for the first time since January.
After a brutal 45.62% decline from the October peak to the December low near $10.60, RIOT found support and began to rebound.
A short descending channel formed in February, and the price has now broken above it.
The Earnings “E” label (set for March 2) could be near the recent low, flagging a potential wave completion, typically a launchpad for the next breakout.
Furthermore, the catalyst is clear on the Moving Average Convergence Divergence (MACD) as it formed a bullish crossover.
The MACD line has crossed above the signal line, and the histogram bars are turning green. That crossover preceded the current move above 5%.
The chart targets $18.85 as the mid-term objective, aligning with the 0.618 Fibonacci retracement. Beyond that, $21.10 (0.786) also comes into view.
Key support to hold on to any pullback is $15.70 (0.382 Fib). If RIOT loses that level, the breakout thesis weakens considerably.
Why BKCH ETF Outperformed Individual Miners
The Global X Blockchain ETF (BKCH) gained 31.6% in 2025 while individual miners experienced significant declines. How?
Diversification. BKCH holds a 12% position in Coinbase, which benefits from institutional trading volume regardless of Bitcoin’s direction.
It also holds stakes in mining-heavy names like Bitmine Immersion Technologies (13%), Iren Ltd (10.9%), and Applied Digital (8.7%), but spreads risk across the entire blockchain ecosystem.
When mining profitability deteriorates, BKCH can rebalance quarterly. When exchanges benefit from volatility, BKCH captures that upside. MicroStrategy can’t pivot. It’s all-in on Bitcoin price appreciation.
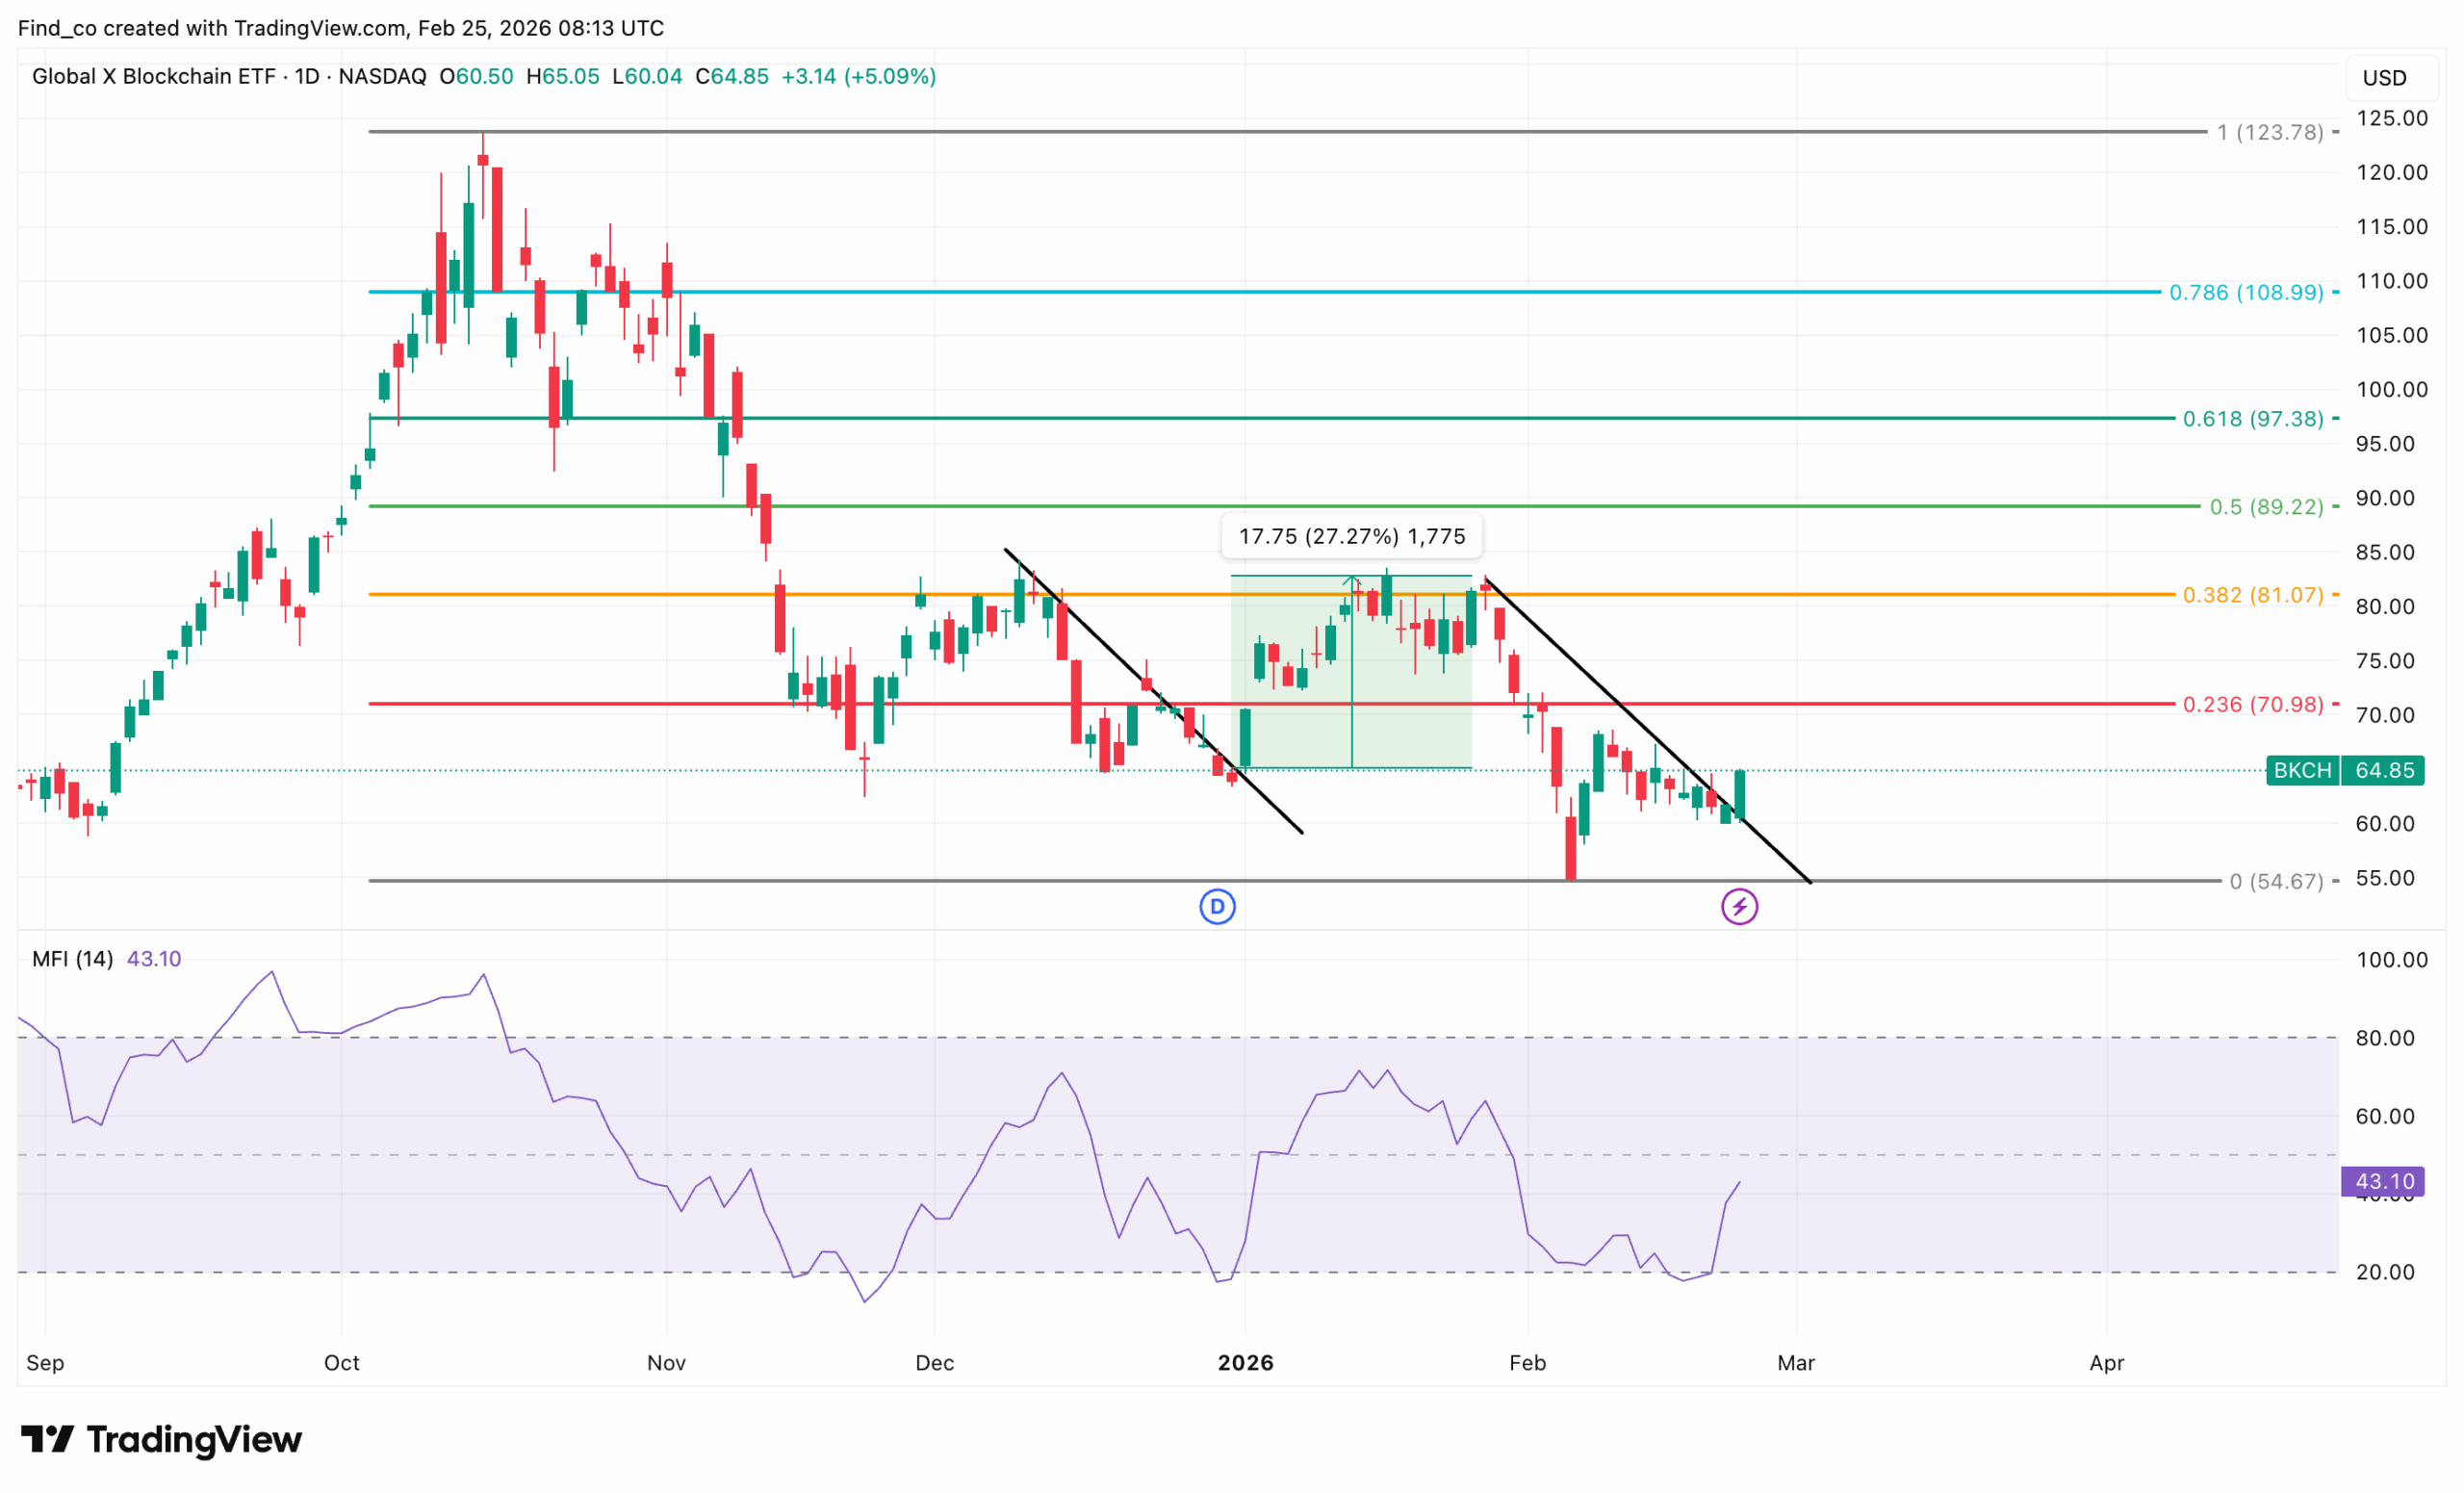
At the time of writing, BKCH trades at $64.85, up 5.09% on the daily chart. However, it remains trapped inside a descending channel that has defined the price action since October’s peak near $123.78.
As shown below, two lower legs are now visible. Notably, the first channel carried BKCH’s price from $100 down to the December lows, and a second channel has formed since February, dragging BKCH toward the 0zeroFib support at $54.67.
That floor is the last meaningful level on the chart.
However, today’s 5% bounce follows a test of the channel’s lower boundary. A measured move of 27.27% is flagged from the recent support, targeting a recovery toward $84.
But the prior attempt at that same pattern in January failed at $81.07 (0.382 Fib) and dropped hard.
The Money Flow Index (MFI) at 43.10 is neutral and recovering from oversold levels.
Disclaimer:
The information provided in this article is for informational purposes only. It is not intended to be, nor should it be construed as, financial advice. We do not make any warranties regarding the completeness, reliability, or accuracy of this information. All investments involve risk, and past performance does not guarantee future results. We recommend consulting a financial advisor before making any investment decisions.
Victor Olanrewaju is a crypto analyst and reporter at CCN with deep roots in on-chain research and technical analysis. His crypto journey began in 2017, but it was the 2020 Uniswap airdrop that sparked a full-time pivot into the space.
With a foundation in copywriting, Victor honed his craft creating high-converting content for leading crypto brokers — most notably an XRP price prediction that ranked #1 on Google during the 2021 bull run.
He later joined AMBCrypto in 2022, where he combined storytelling with technical and on-chain analysis to cover key market narratives.
In 2024, he expanded his expertise at BeInCrypto, collaborating with analysts and using tools like Glassnode, Santiment, and IntoTheBlock to break down Bitcoin and altcoin trends.
At CCN, Victor covers the top cryptocurrencies, memecoins, macro shifts, blending real-time insights with deep-dive metrics.
He holds a Bachelor’s degree in Physics from the University of Ibadan, equipping him to simplify complex data for a wide audience. Follow his work or connect on LinkedIn or X.