Uniswap’s comeback might be on the way | Credit: Hameem Sarwar
Share
Key Takeaways
Considerable UNI accumulation from Binance wallets suggests a potential trend reversal.
RSI at 58.22 and green MACD histogram bars confirm growing buying strength.
A breakout above $7 could lift UNI toward $8.50; however, traders should be cautious.
Uniswap (UNI) shows early signs of recovery as whale accumulation intensifies across major exchanges, particularly Binance.
As of this writing, the token appears poised for a trend reversal, with technical indicators aligning for a potential bullish move.
Is UNI’s price ready for its next leg? Let’s check the charts.
UNI Price Begins Recovery
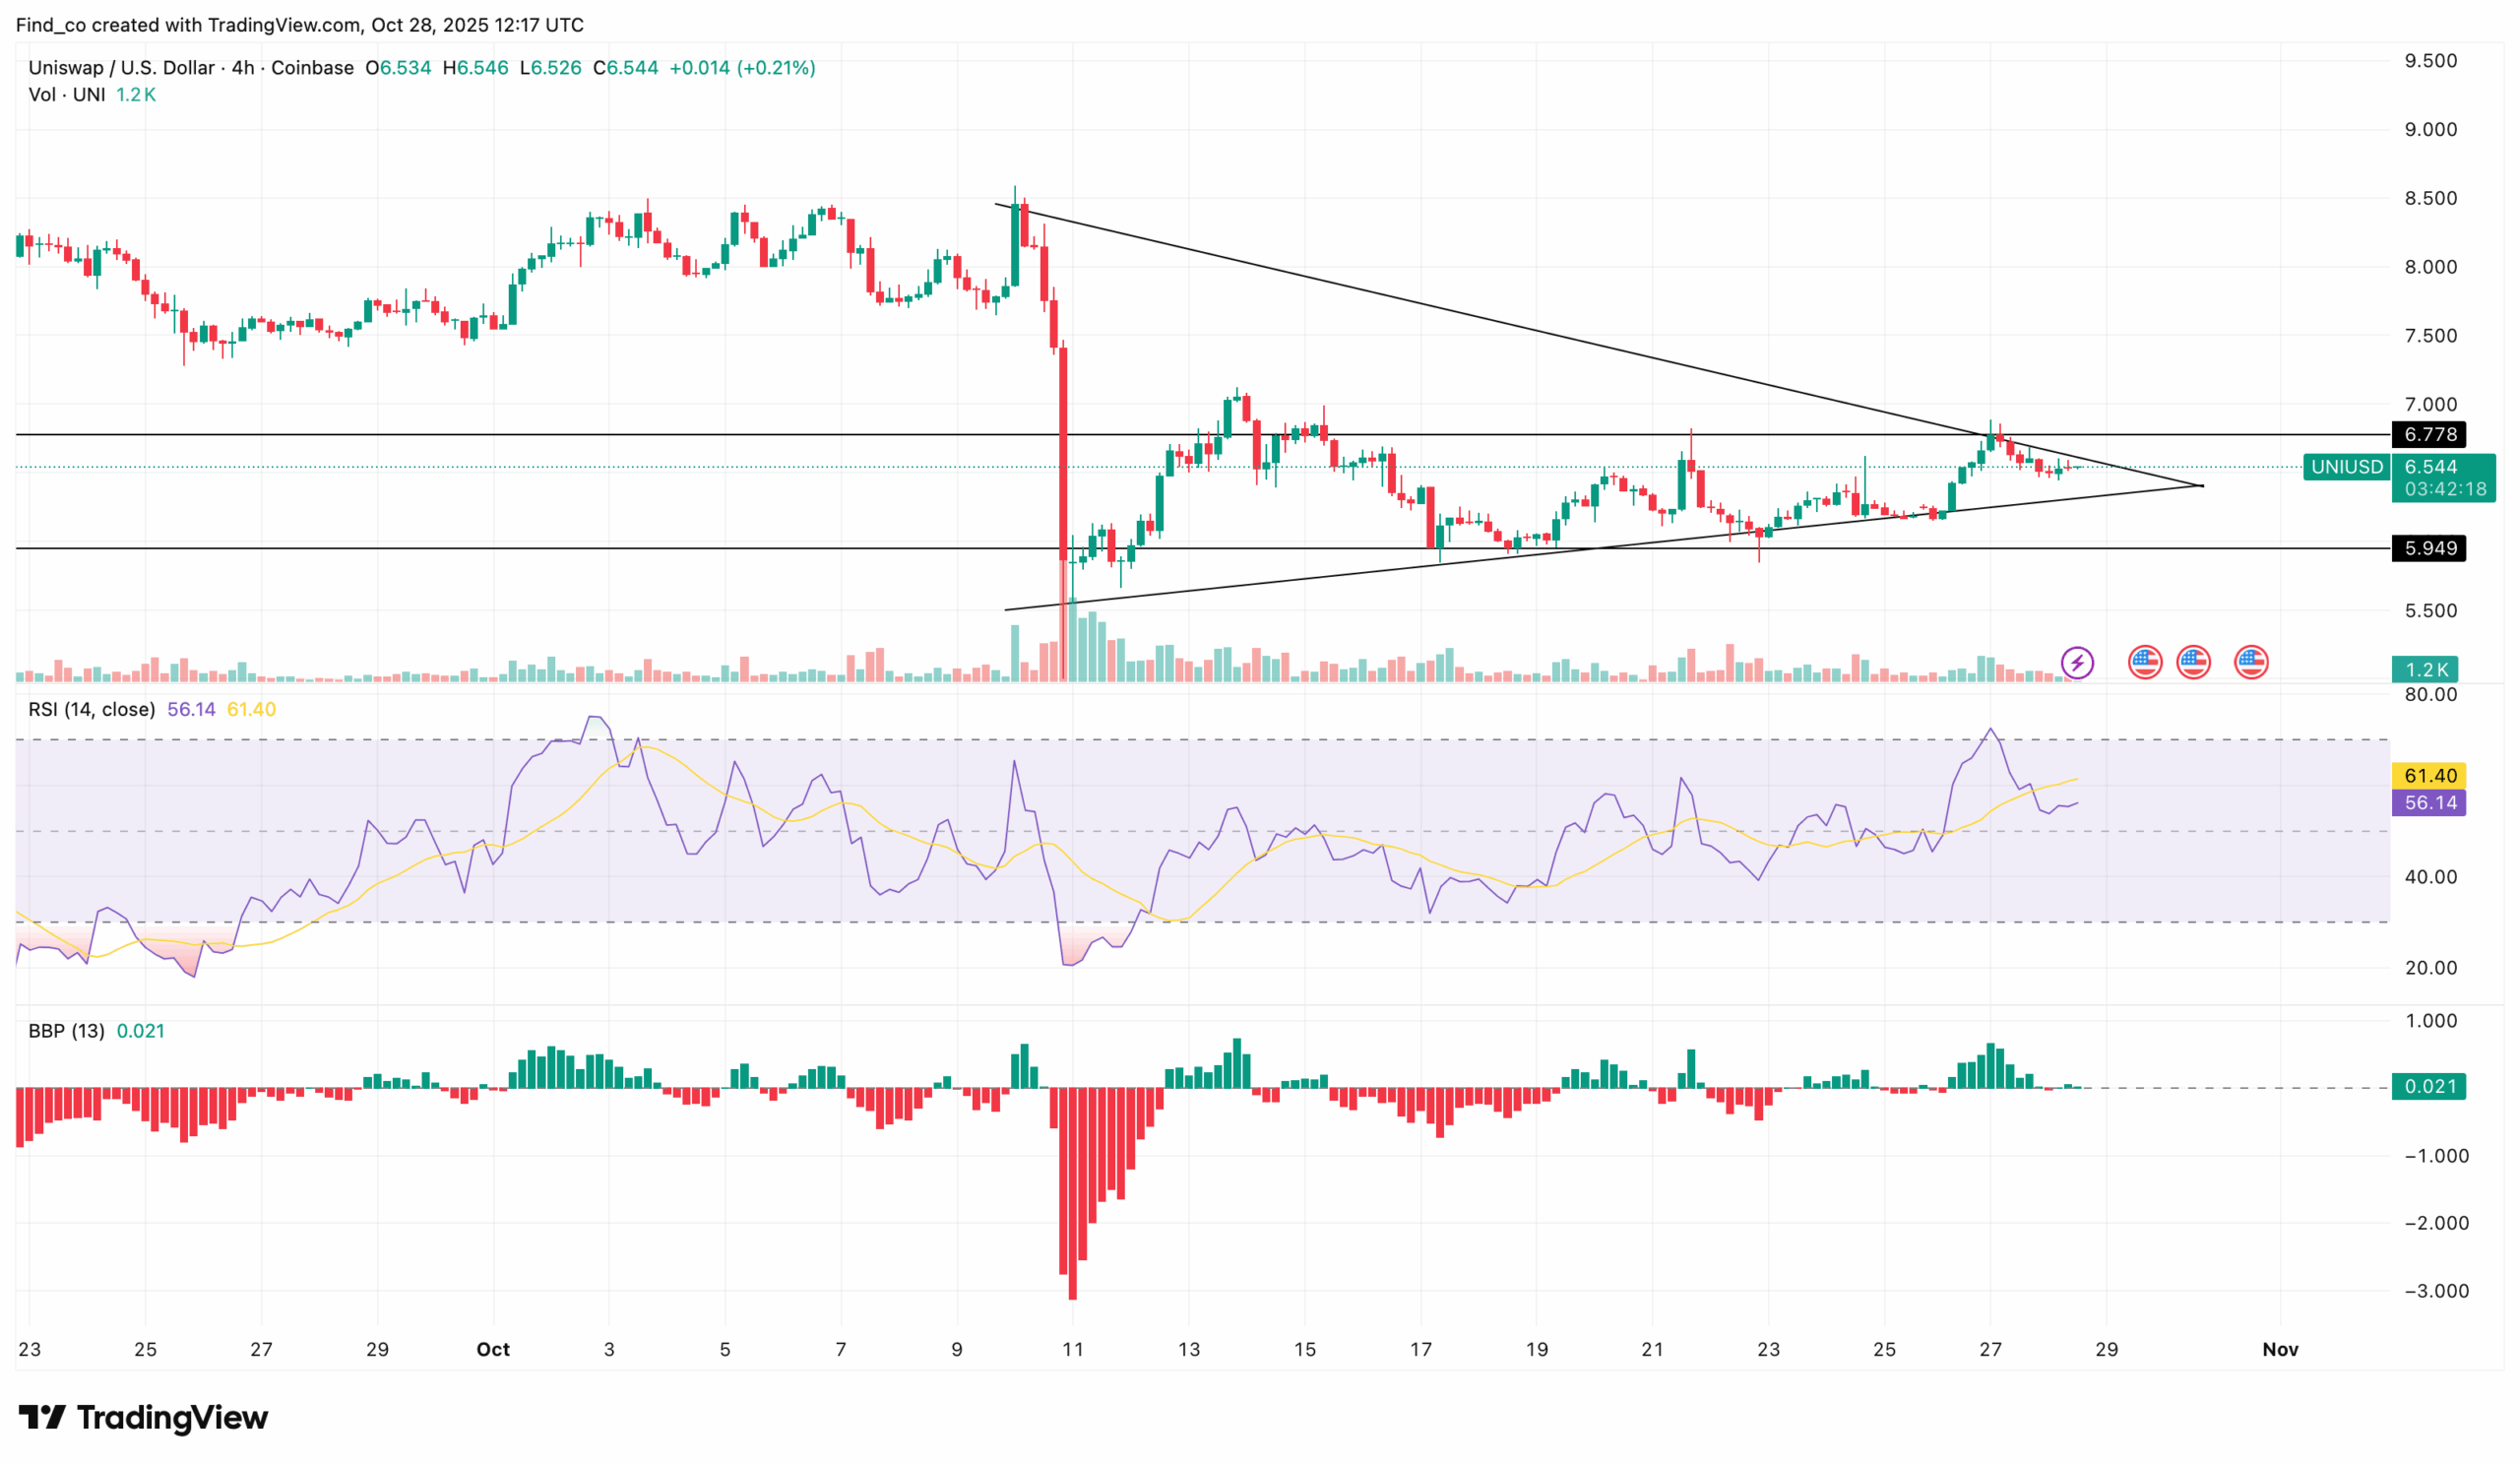
On the 4-hour chart, UNI’s Relative Strength Index (RSI) has risen to 58.22, signaling bullish momentum as it approaches the key 60 to 70 zone. This steady climb suggests renewed buying interest following a long consolidation period.
Get These Top Crypto Casino Offers Now!
Sponsored
Disclosure
We sometimes use affiliate links in our content, when clicking on those we might receive a commission at no extra cost to you. By using this website you agree to our terms and conditions and privacy policy.
The Bull Bear Power (BBP) indicator stands at 0.041, flipping positive and indicating that buyers are gaining control over short-term price action. UNI trades near $6.54, facing resistance between $6.78 and $7.00, with support around $5.40.
A breakout above the upper boundary could lift the token toward $7.67, while sustained whale demand may extend gains beyond $8.53.
Furthermore, on-chain data support this bullish sentiment.
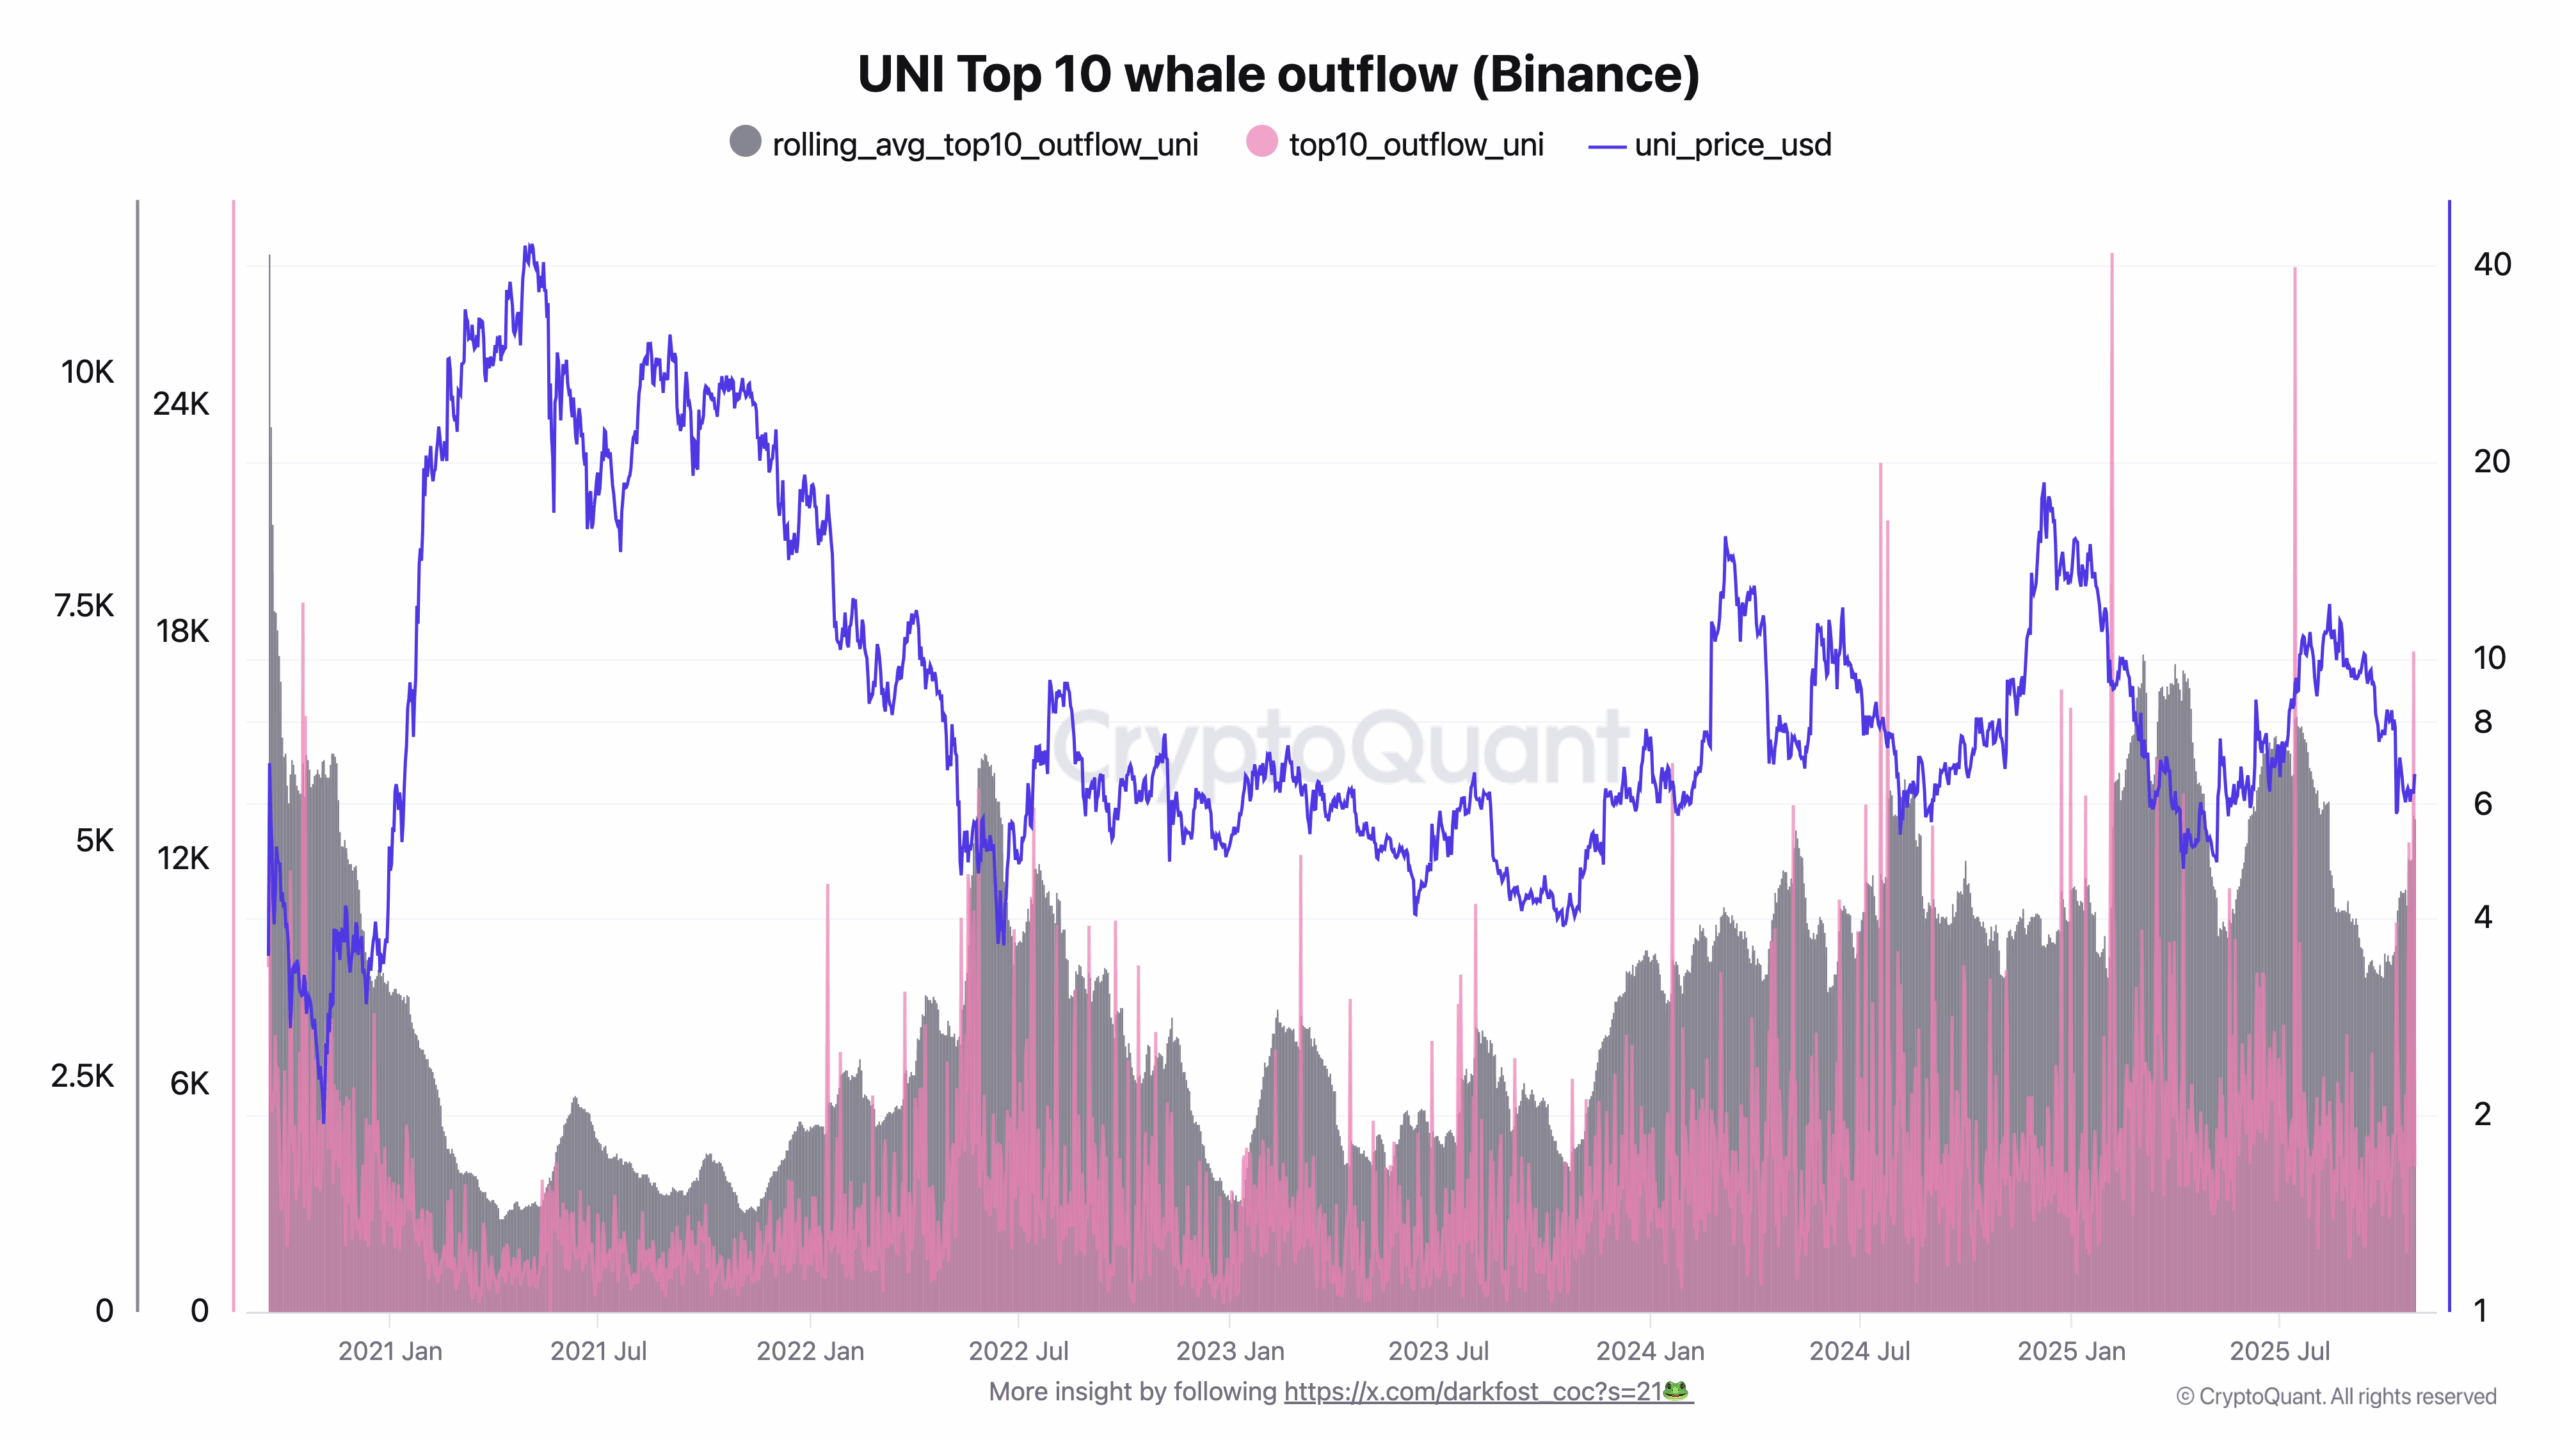
According to crypto analyst Darkfost, Binance whales are accumulating more UNI.
Over the past few days, UNI has experienced unusual activity, with significant outflows from Binance wallets. The top 10 largest transactions peaked at daily highs of 17,400 UNI and monthly highs of 5,250 UNI, marking a three-month record.
“This renewed activity coincides with a market phase where UNI is still experiencing the effects of the correction that began in July.
Seeing whales become active in this asset could signal a return of confidence and could mark the start of a trend reversal, as some of the top 10 transactions were from Binance.” Darkfost explained.
Should this trend continue, Uniswap’s price will likely close in on $10 in the coming days.
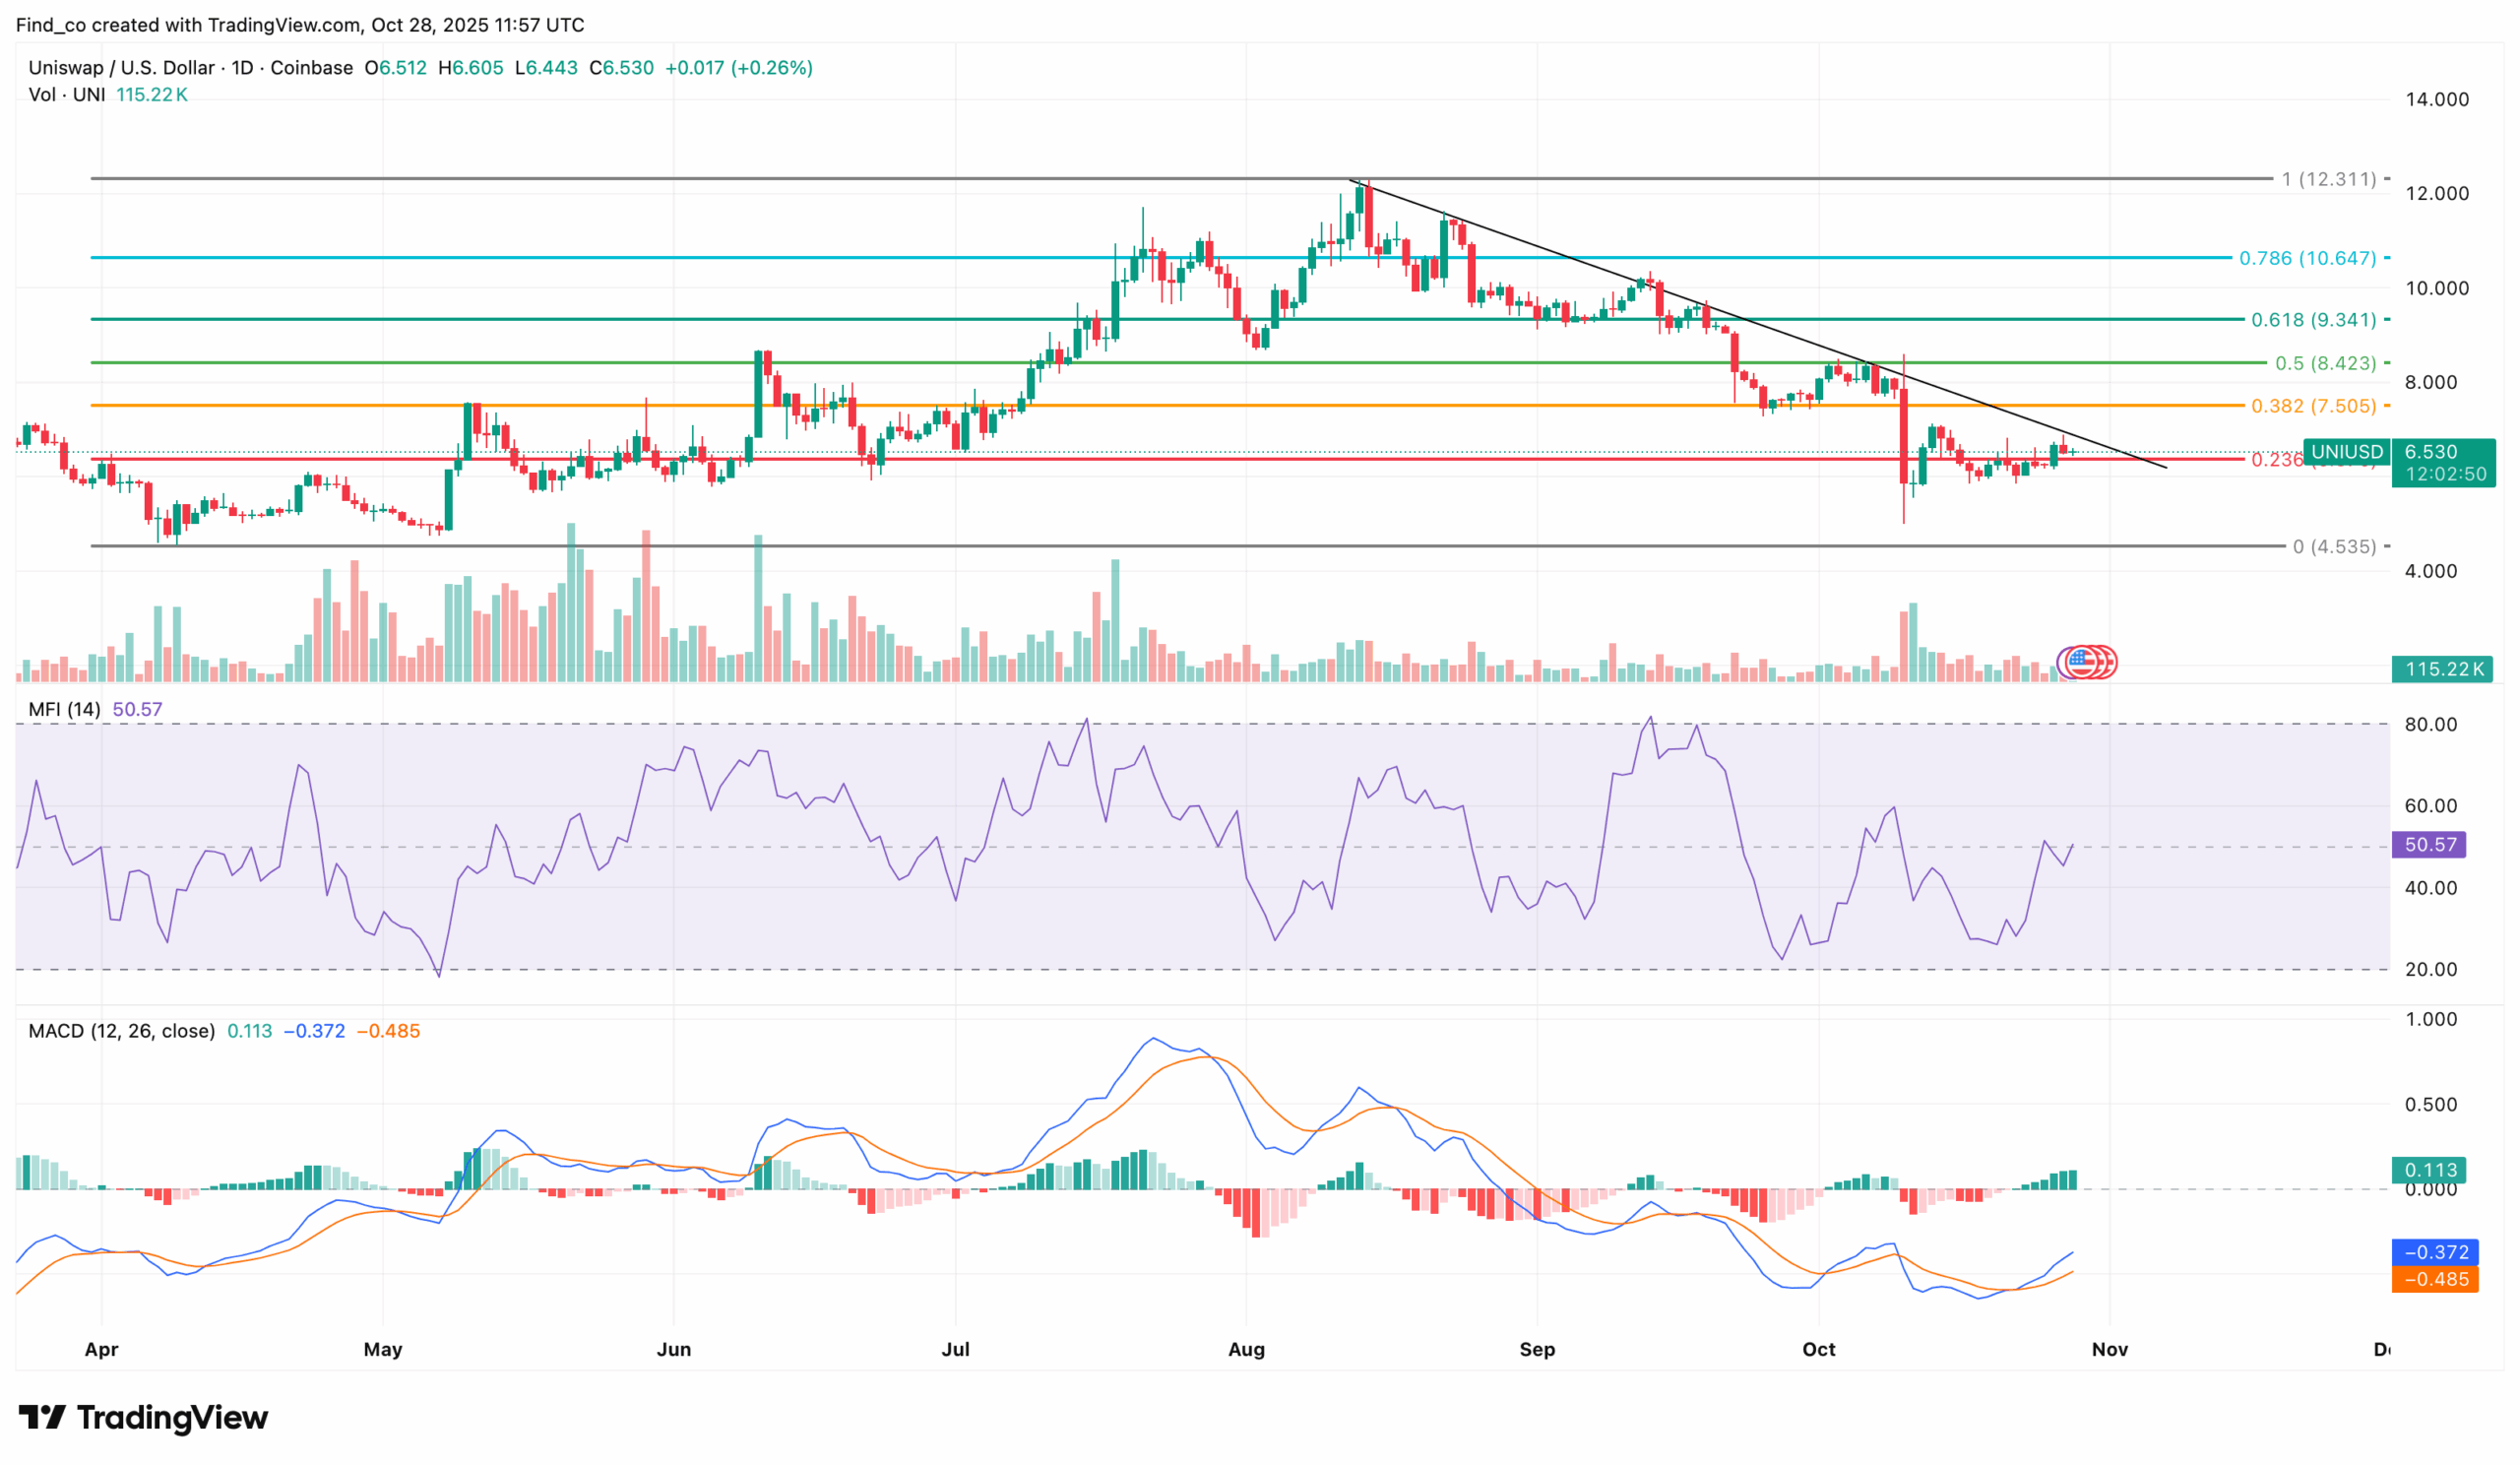
The daily chart supports this outlook, with Uniswap’s price moving away from the bearish trend.
Furthermore, the Money Flow indicator is climbing, now at 50.57, above the neutral zone and trending toward the overbought region near 80.
Although buyers and sellers remain at odds, strengthening inflows hint that buyers are gradually gaining the upper hand.
Meanwhile, the Moving Average Convergence Divergence (MACD) indicator flashes early bullish signals.
Additionally, the histogram bars have turned green. They are widening, indicating growing momentum as the MACD line inches closer to crossing above the signal line, a typical precursor to an upward price movement.
Examining the Fibonacci retracement levels, UNI’s price has formed a green candle above the 0.236 Fib level and continues to trend upward. With momentum building, the altcoin could target the 0.382 Fib level at $7.51.
Disclaimer:
The information provided in this article is for informational purposes only. It is not intended to be, nor should it be construed as, financial advice. We do not make any warranties regarding the completeness, reliability, or accuracy of this information. All investments involve risk, and past performance does not guarantee future results. We recommend consulting a financial advisor before making any investment decisions.
Victor Olanrewaju is a crypto analyst and reporter at CCN with deep roots in on-chain research and technical analysis. His crypto journey began in 2017, but it was the 2020 Uniswap airdrop that sparked a full-time pivot into the space.
With a foundation in copywriting, Victor honed his craft creating high-converting content for leading crypto brokers — most notably an XRP price prediction that ranked #1 on Google during the 2021 bull run.
He later joined AMBCrypto in 2022, where he combined storytelling with technical and on-chain analysis to cover key market narratives.
In 2024, he expanded his expertise at BeInCrypto, collaborating with analysts and using tools like Glassnode, Santiment, and IntoTheBlock to break down Bitcoin and altcoin trends.
At CCN, Victor covers the top cryptocurrencies, memecoins, macro shifts, blending real-time insights with deep-dive metrics.
He holds a Bachelor’s degree in Physics from the University of Ibadan, equipping him to simplify complex data for a wide audience. Follow his work or connect on LinkedIn or X.