This recovery looks like a classic five-wave impulse. Wave (III) ended above $3.80 on April 25, followed by consolidation beneath wave (IV).
Subsequently, SUI pushed higher again, reaching a peak near $4.30 on May 11, which may mark the completion of wave (V).
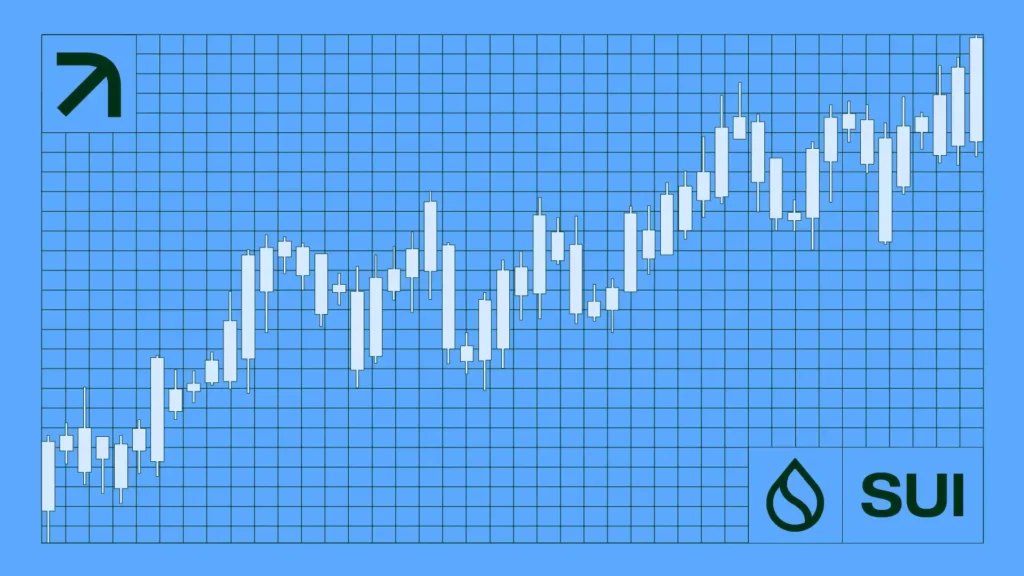
SUIUSD 4h chart | Credit: Nikola Lazic/TradingView
The Fibonacci retracement from the low to the recent high shows the price stabilizing around the 0.618 retracement at $3.83, which aligns with strong horizontal resistance-turned-support.
Relative Strength Index (RSI) momentum remains neutral-to-strong without showing major bearish divergence, indicating this is likely a healthy consolidation phase rather than a reversal.
The Elliott Wave structure suggests the current movement is part of a wave (v), but the main question is whether the two-week consolidation can lead to a new high.
Major resistance lies at the 0.786 level ($4.55) and wave (v) projection near $5.32.
A break above the current consolidation would confirm the final leg higher.
SUI Price Prediction
Zooming into the 1-hour chart, SUI appears to have completed wave (iv) of a smaller impulse, with subwaves (a)-(b)-(c)-(d)-(e) forming a textbook triangle or flat correction.
This consolidation pattern held the 0.236 Fib extension of the previous rally at $3.60, a key support that held firm during several tests.
SUIUSD 1h chart | Credit: Nikola Lazic/TradingView
Momentum seems to be coiling for a breakout, with the RSI rising modestly without being overbought.
If the structure plays out cleanly, wave (v) may be in development.
Fibonacci extensions project potential targets at $4.29 (0.618), $4.59 (0.786), and up to $4.98 (1.0), aligning with macro resistance zones and wave count expectations.
Since yesterday’s upward spike, we saw a 10% decrease, but the price still holds a higher low, leaving room for a bullish outlook.
This is why a failure to break above the $3.96 resistance would short-term invalidate the bullish scenario and could send the price back to test $3.53 or $3.10.
A clean five-wave completion and RSI confirmation would be necessary for a confident long continuation.
On the other hand, the whole five-wave impulse from April 7 could have ended on May 9, with the following consolidation being the distribution phase.
In that case, we already saw the first two sub-waves of the corrective stage.
Disclaimer:
The information provided in this article is for informational purposes only. It is not intended to be, nor should it be construed as, financial advice. We do not make any warranties regarding the completeness, reliability, or accuracy of this information. All investments involve risk, and past performance does not guarantee future results. We recommend consulting a financial advisor before making any investment decisions.
Nikola Lazic is a cryptocurrency analyst and investor working in the industry since 2017. He holds a bachelor's degree in Sociology, which enables him to better understand the psychology behind the crowd´s positioning. Consequently his preferred analytical tool is Elliott Wave Theory in combination with price action analysis.
Combining his experience in trading and investing with knowledge in content writing he strives to bring the most accurate and actionable information.