A breakout from the falling wedge structure began a powerful impulsive wave sequence.
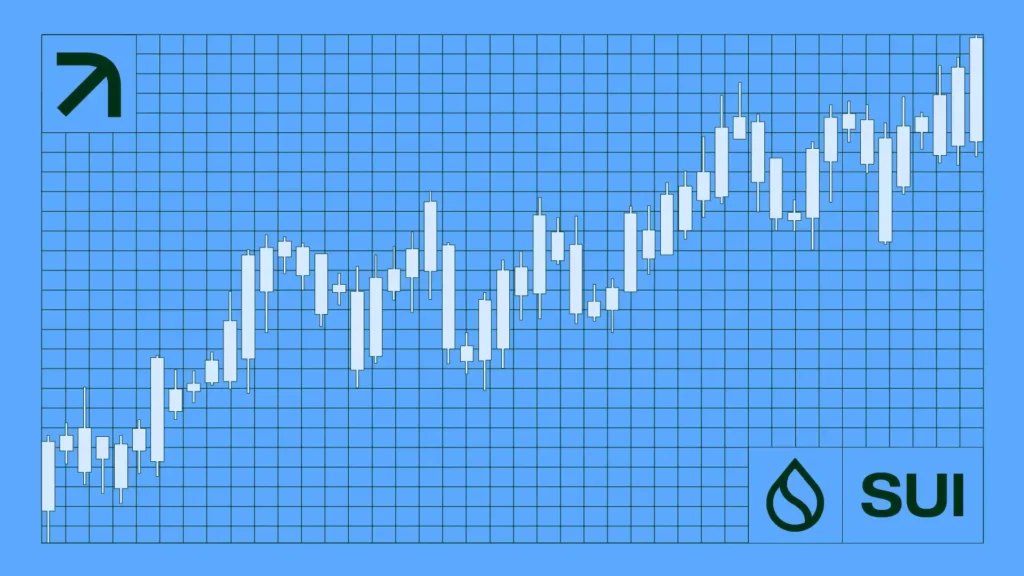
SUIUSD 4h chart | Credit: Nikola Lazic/TradingView
This rally pushed SUI from around $1.80 to a peak near $4.30 on May 12.
The impulsive structure is visible through waves I to III, while wave IV appears to have completed as a falling wedge – a typical bullish continuation pattern.
The Relative Strength Index (RSI) has cooled down from overbought territory and now sits in neutral zones, indicating room for another upward leg.
SUI is now in its end wave V, and with its current recovery testing at the 0.618 Fibonacci level, we will see if there is a potential for a higher high.
The $3.53 level (0.5 Fib retracement from the recent move) supported the correction, while the current bounce from $3.60 further confirms the bullish continuation.
If the impulsive structure plays out fully, wave V may extend beyond the previous high of $4.30, targeting $4.56 or even $5.32 as final wave targets.
SUI Price Prediction
The lower time frame shows a detailed Elliott Wave count, unfolding wave IV as a textbook triangle (a-b-c-d-e).
This indicates consolidation before the final move.
A breakout above $3.90 confirms wave v may be underway, aiming toward the $4.29–$4.98 resistance band.
SUIUSD 1h chart | Credit: Nikola Lazic/TradingView
Support at $3.60 (0.236 Fib retracement) was defended successfully, aligning with a wave IV low.
The structure suggests the rally could extend toward $4.29 (0.618), possibly overshooting to $4.59–$5.32 if bullish momentum persists.
However, if the recent bounce fails and price drops below $3.53, this would invalidate the wave V thesis and point toward a deeper correction.
RSI on the 1-hour remains in a healthy mid-range, providing space for upside movement, though short-term traders should watch for divergence signals.
In the coming days, price action around the $4.08–$4.29 range will determine whether SUI completes its fifth wave or rolls over into a deeper retracement phase.
From the current price levels to the first optimal target of $4.59, there is a 18% increase potential, but the first step in confirming this outlook will be breaking above $4. area.
Key Levels to Watch
Immediate Support: $3.60 (0.236 Fib of recent rally).
Structural Support: $3.53 (0.5 Fib retracement).
Wave High: $4.29 (0.618 extension target).
Fibonacci Resistance: $4.56 (0.786 extension).
Macro Target: $5.32 (1.0 extension of wave i–iii).
Disclaimer:
The information provided in this article is for informational purposes only. It is not intended to be, nor should it be construed as, financial advice. We do not make any warranties regarding the completeness, reliability, or accuracy of this information. All investments involve risk, and past performance does not guarantee future results. We recommend consulting a financial advisor before making any investment decisions.
Nikola Lazic is a cryptocurrency analyst and investor working in the industry since 2017. He holds a bachelor's degree in Sociology, which enables him to better understand the psychology behind the crowd´s positioning. Consequently his preferred analytical tool is Elliott Wave Theory in combination with price action analysis.
Combining his experience in trading and investing with knowledge in content writing he strives to bring the most accurate and actionable information.