Will Omni Network Finally Break Out? | Credit: Hameem Sarwar
Share
Key Takeaways
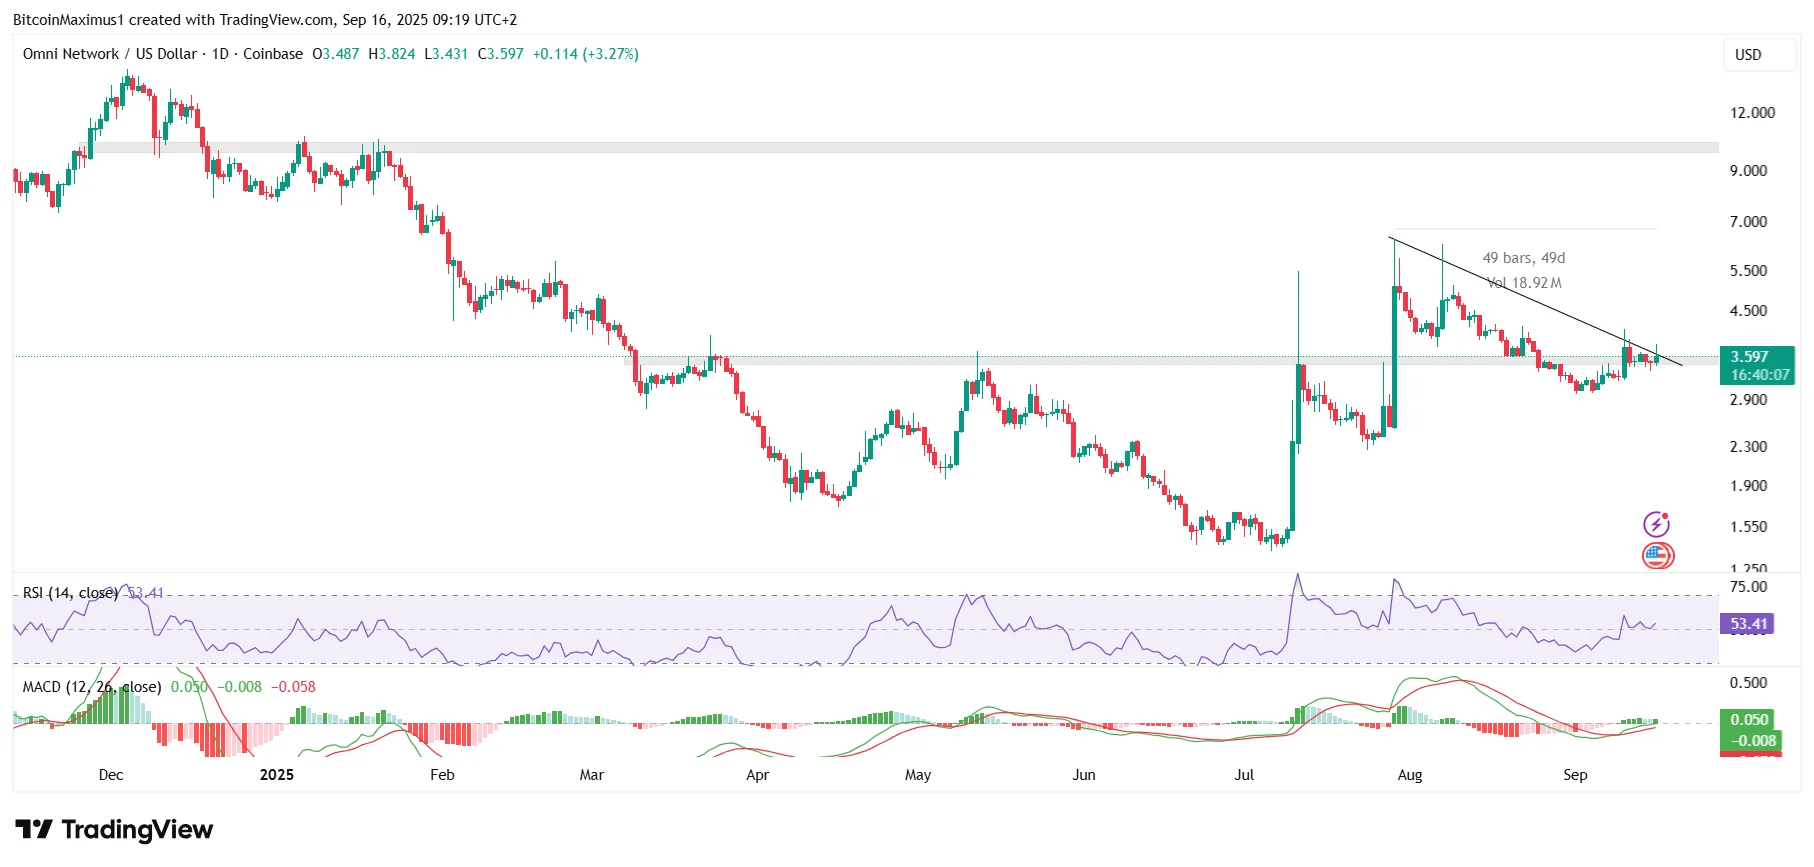
Omni Network (OMNI) bounced at the $3.55 horizontal support area.
The OMNI price is attempting to break out from a diagonal resistance.
Will OMNI finally break out and confirm the end of its correction?
Omni Network (OMNI) retraced in July, but is showing strength after bouncing at the $3.55 support area.
The OMNI price is testing a diagonal resistance, opening the possibility for a considerable breakout soon.
If a breakout occurs, Omni Network could reach a new cycle high.
Omni Network Price Analysis
The OMNI price initially pumped in July, triggered by an Upbit listing. After a brief decline, the price reached a new high of $6.40 on July 29, marking a local top.
Omni Network has been under a descending resistance trend line since Sept. 1, when it fell to a low of $2.97 and briefly declined below the $3.60 horizontal support area.
Get These Top Crypto Casino Offers Now!
Sponsored
Disclosure
We sometimes use affiliate links in our content, when clicking on those we might receive a commission at no extra cost to you. By using this website you agree to our terms and conditions and privacy policy.
The Relative Strength Index (RSI) crossed 50 and the Moving Average Convergence/Divergence (MACD) crossed into positive territory, both signs of a bullish trend.
So, the Omni Network prediction is bullish, and a breakout from the trend line is likely in September.
What Lies Ahead?
The wave count aligns with the positive price action and indicator readings.
According to the count, OMNI finished a five-wave downward movement (red) shortly after launch, culminating with a low of $1.37 on July 6.
If the count is accurate, OMNI has finished wave B in an A-B-C correction (green), retesting the resistance trend line of a descending parallel channel.
Disclaimer:
The information provided in this article is for informational purposes only. It is not intended to be, nor should it be construed as, financial advice. We do not make any warranties regarding the completeness, reliability, or accuracy of this information. All investments involve risk, and past performance does not guarantee future results. We recommend consulting a financial advisor before making any investment decisions.
Valdrin Tahiri is a cryptocurrency analyst and reporter at CCN, specializing in technical analysis with a focus on Elliott Wave theory, on-chain metrics, and fundamental research. He brings over seven years of experience in the crypto space as both a trader and writer.
He discovered cryptocurrencies in 2017 while earning his MSc in Financial Markets at the Barcelona School of Economics, which sparked a deep interest in blockchain and market dynamics. Since then, he’s contributed to top crypto outlets like BeInCrypto and CoinGape.
Valdrin also served as Community Manager of BeInCrypto’s Telegram group for three years, helping grow it into one of the largest crypto communities worldwide. His expertise in market structure and price patterns allows him to break down complex trends into clear, actionable insights.
He’s published thousands of articles covering altcoins, Bitcoin cycles, and macro trends.