Lido’s Growth Committee has proposed deploying up to 10,000 stETH from the DAO treasury to accumulate LDO.
LDO has gained 6.2% since the proposal went live Friday, with RSI crossing above 50, the Smart Money Index rising, and the long/short ratio flipping above 1.0 for the first time in weeks.
On-chain data from Glassnode shows a pattern historically associated with undervaluation and potential price recovery.
In a governance proposal shared Friday, Lido’s Growth Committee is considering a one-off 10,000 stETH buyback of LDO governance tokens to address the decimation in the altcoin’s value.
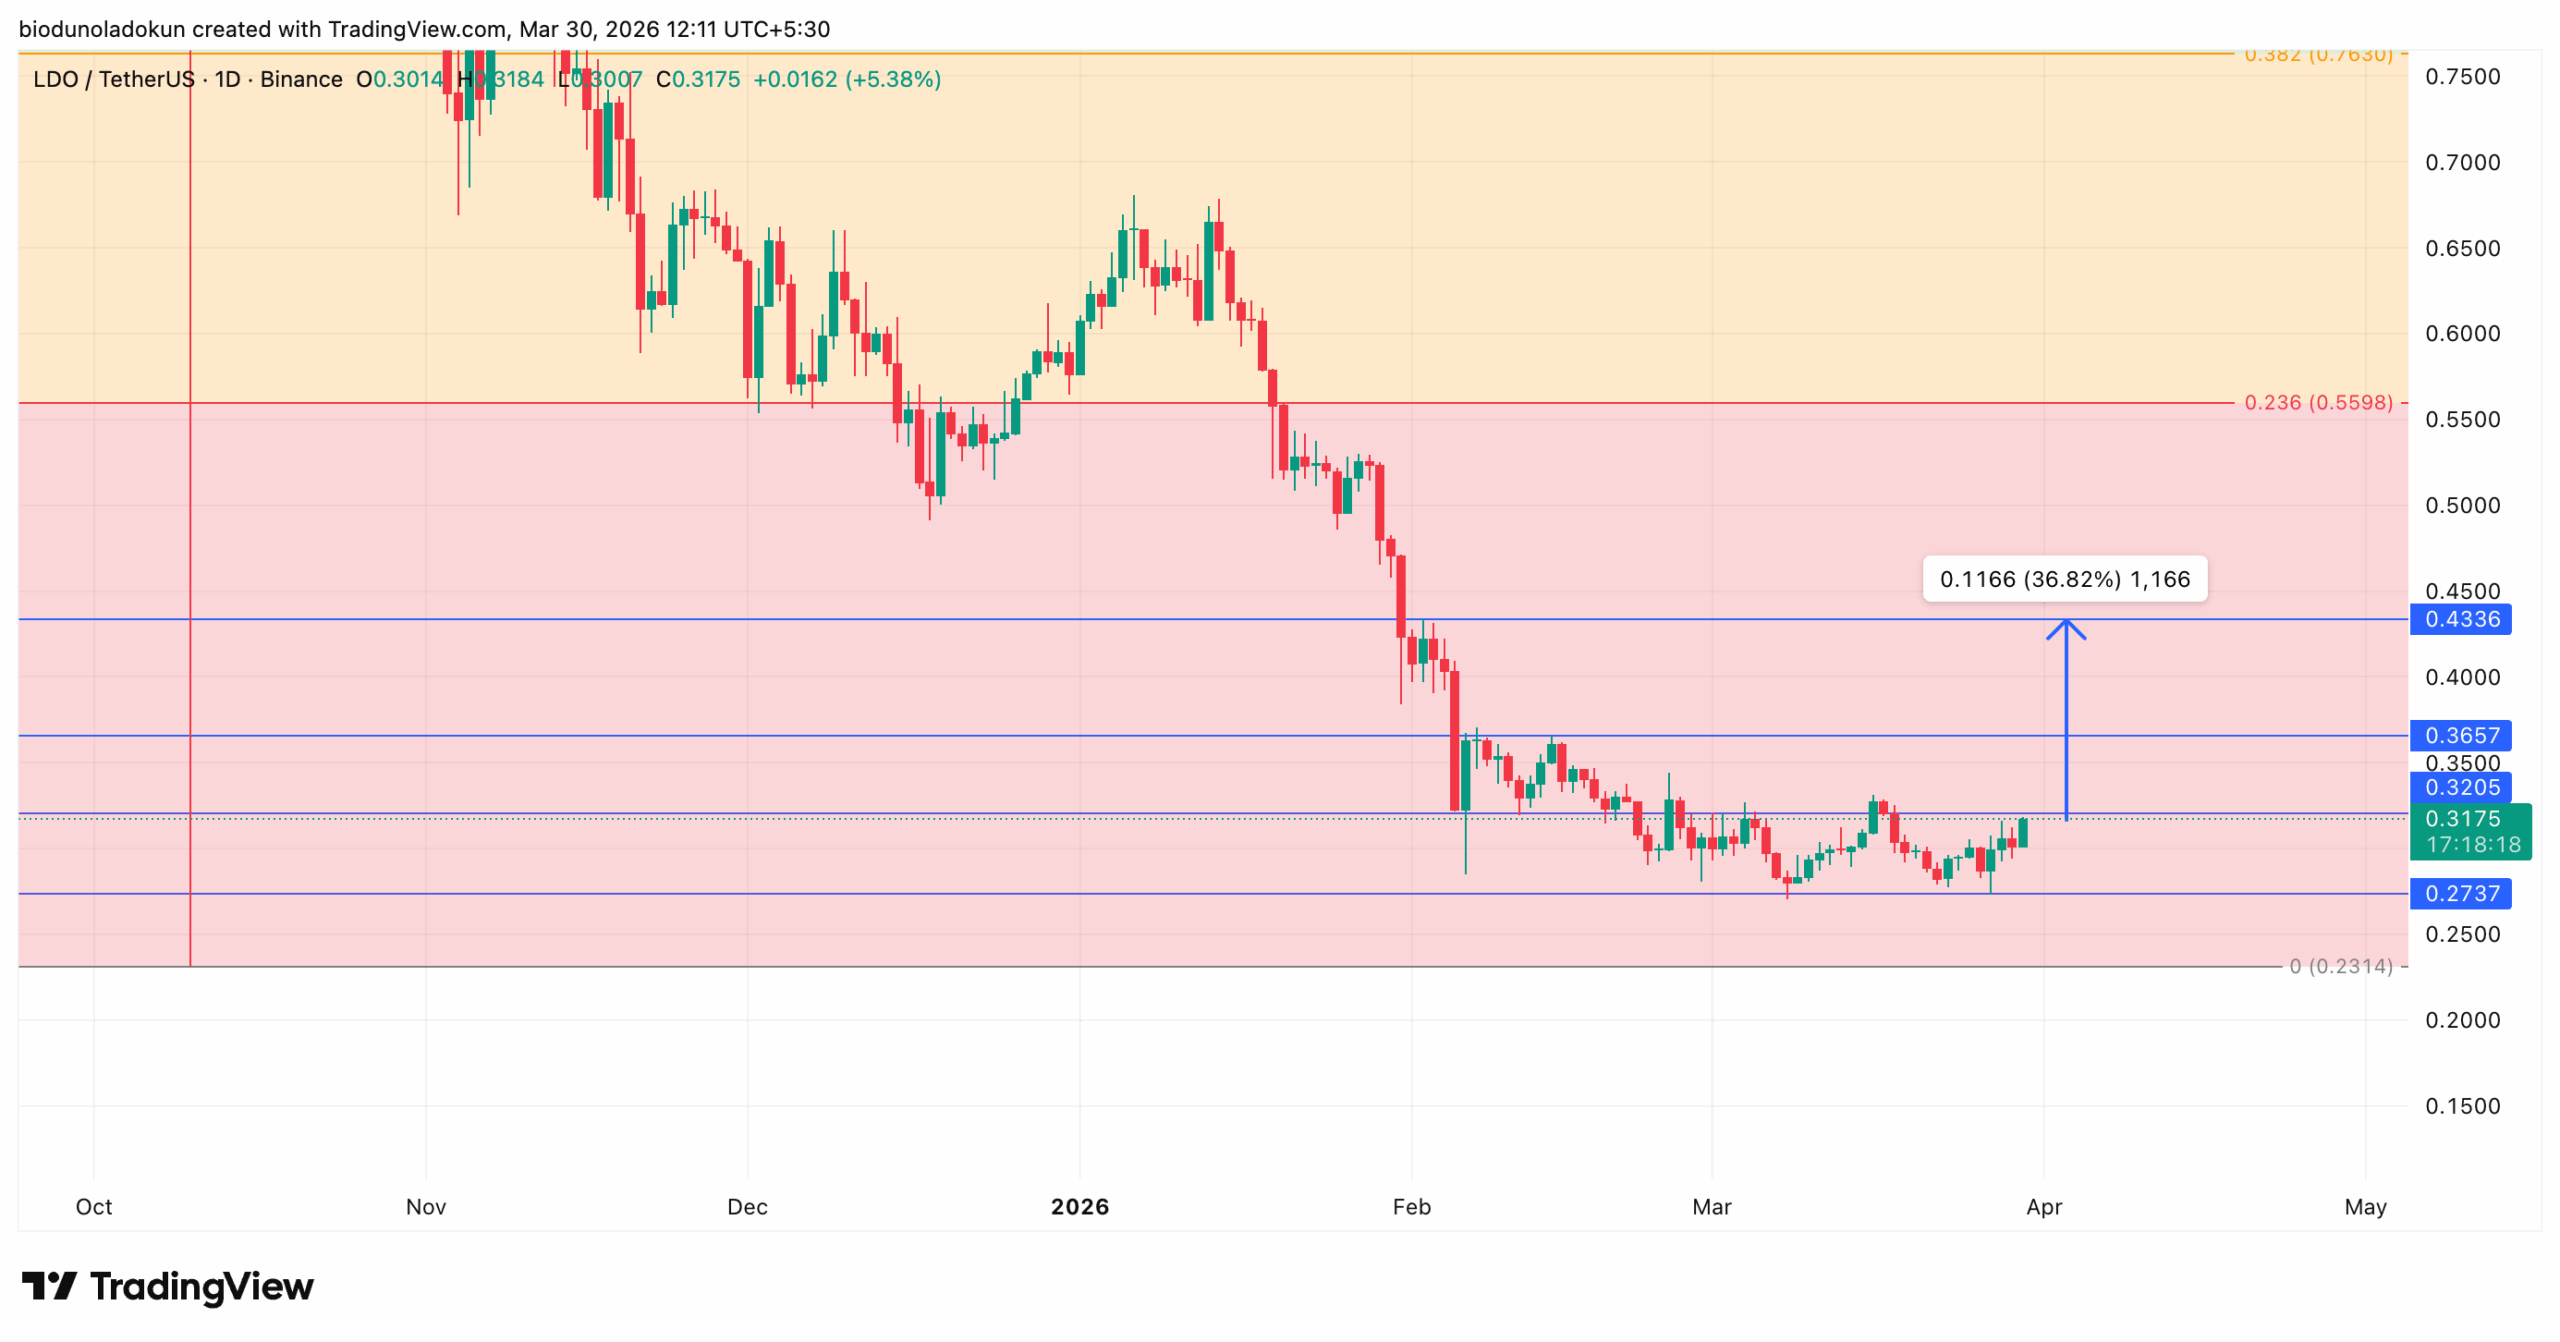
Since the proposal went live, LDO has gained 6% and is now pressing against the upper boundary of the horizontal channel that has kept its price trading sideways since late February.
Here is what the proposal entails, how LDO has reacted since it went live, and what to expect in the near term.
Why Lido’s DAO Wants to Spend $20M Buying Its Own Token
According to the proposal, the LDO-to-ETH ratio is currently 0.00016. This marks a 70% drop from the 0.0005 level, which the ratio held for most of the past two years.
While the DAO argues that this dislocation is “not justified by a proportional deterioration in protocol performance,” and that Lido “continues to lead as the dominant liquid staking middleware by TVL,” CCN had earlier reported a steady decline in the liquid staking protocol’s market share.
This, which is still underway, has been due to a constant dip in Lido’s total protocol Annual Percentage Rate (APR). At press time, this stands at 2.67%, down sharply from 13.06% on February 3, 2025.
As staking rewards fall, the protocol continues to lose market share to competitors, eroding demand for its governance token and weighing on its price throughout the past year.
To address this, the DAO wants to deploy up to 10,000 stETH — roughly $20 million — from its treasury to buy LDO tokens on the open market.
LDO Gains as Momentum Indicators Turn Bullish
Since the proposal went live, LDO’s market reaction has been notable. Trading at $0.31 at press time, the governance token is up 6.2% since Friday.
This near double-digit price rally has now pushed the altcoin towards the upper resistance line of the horizontal channel that has capped its price action since late February.
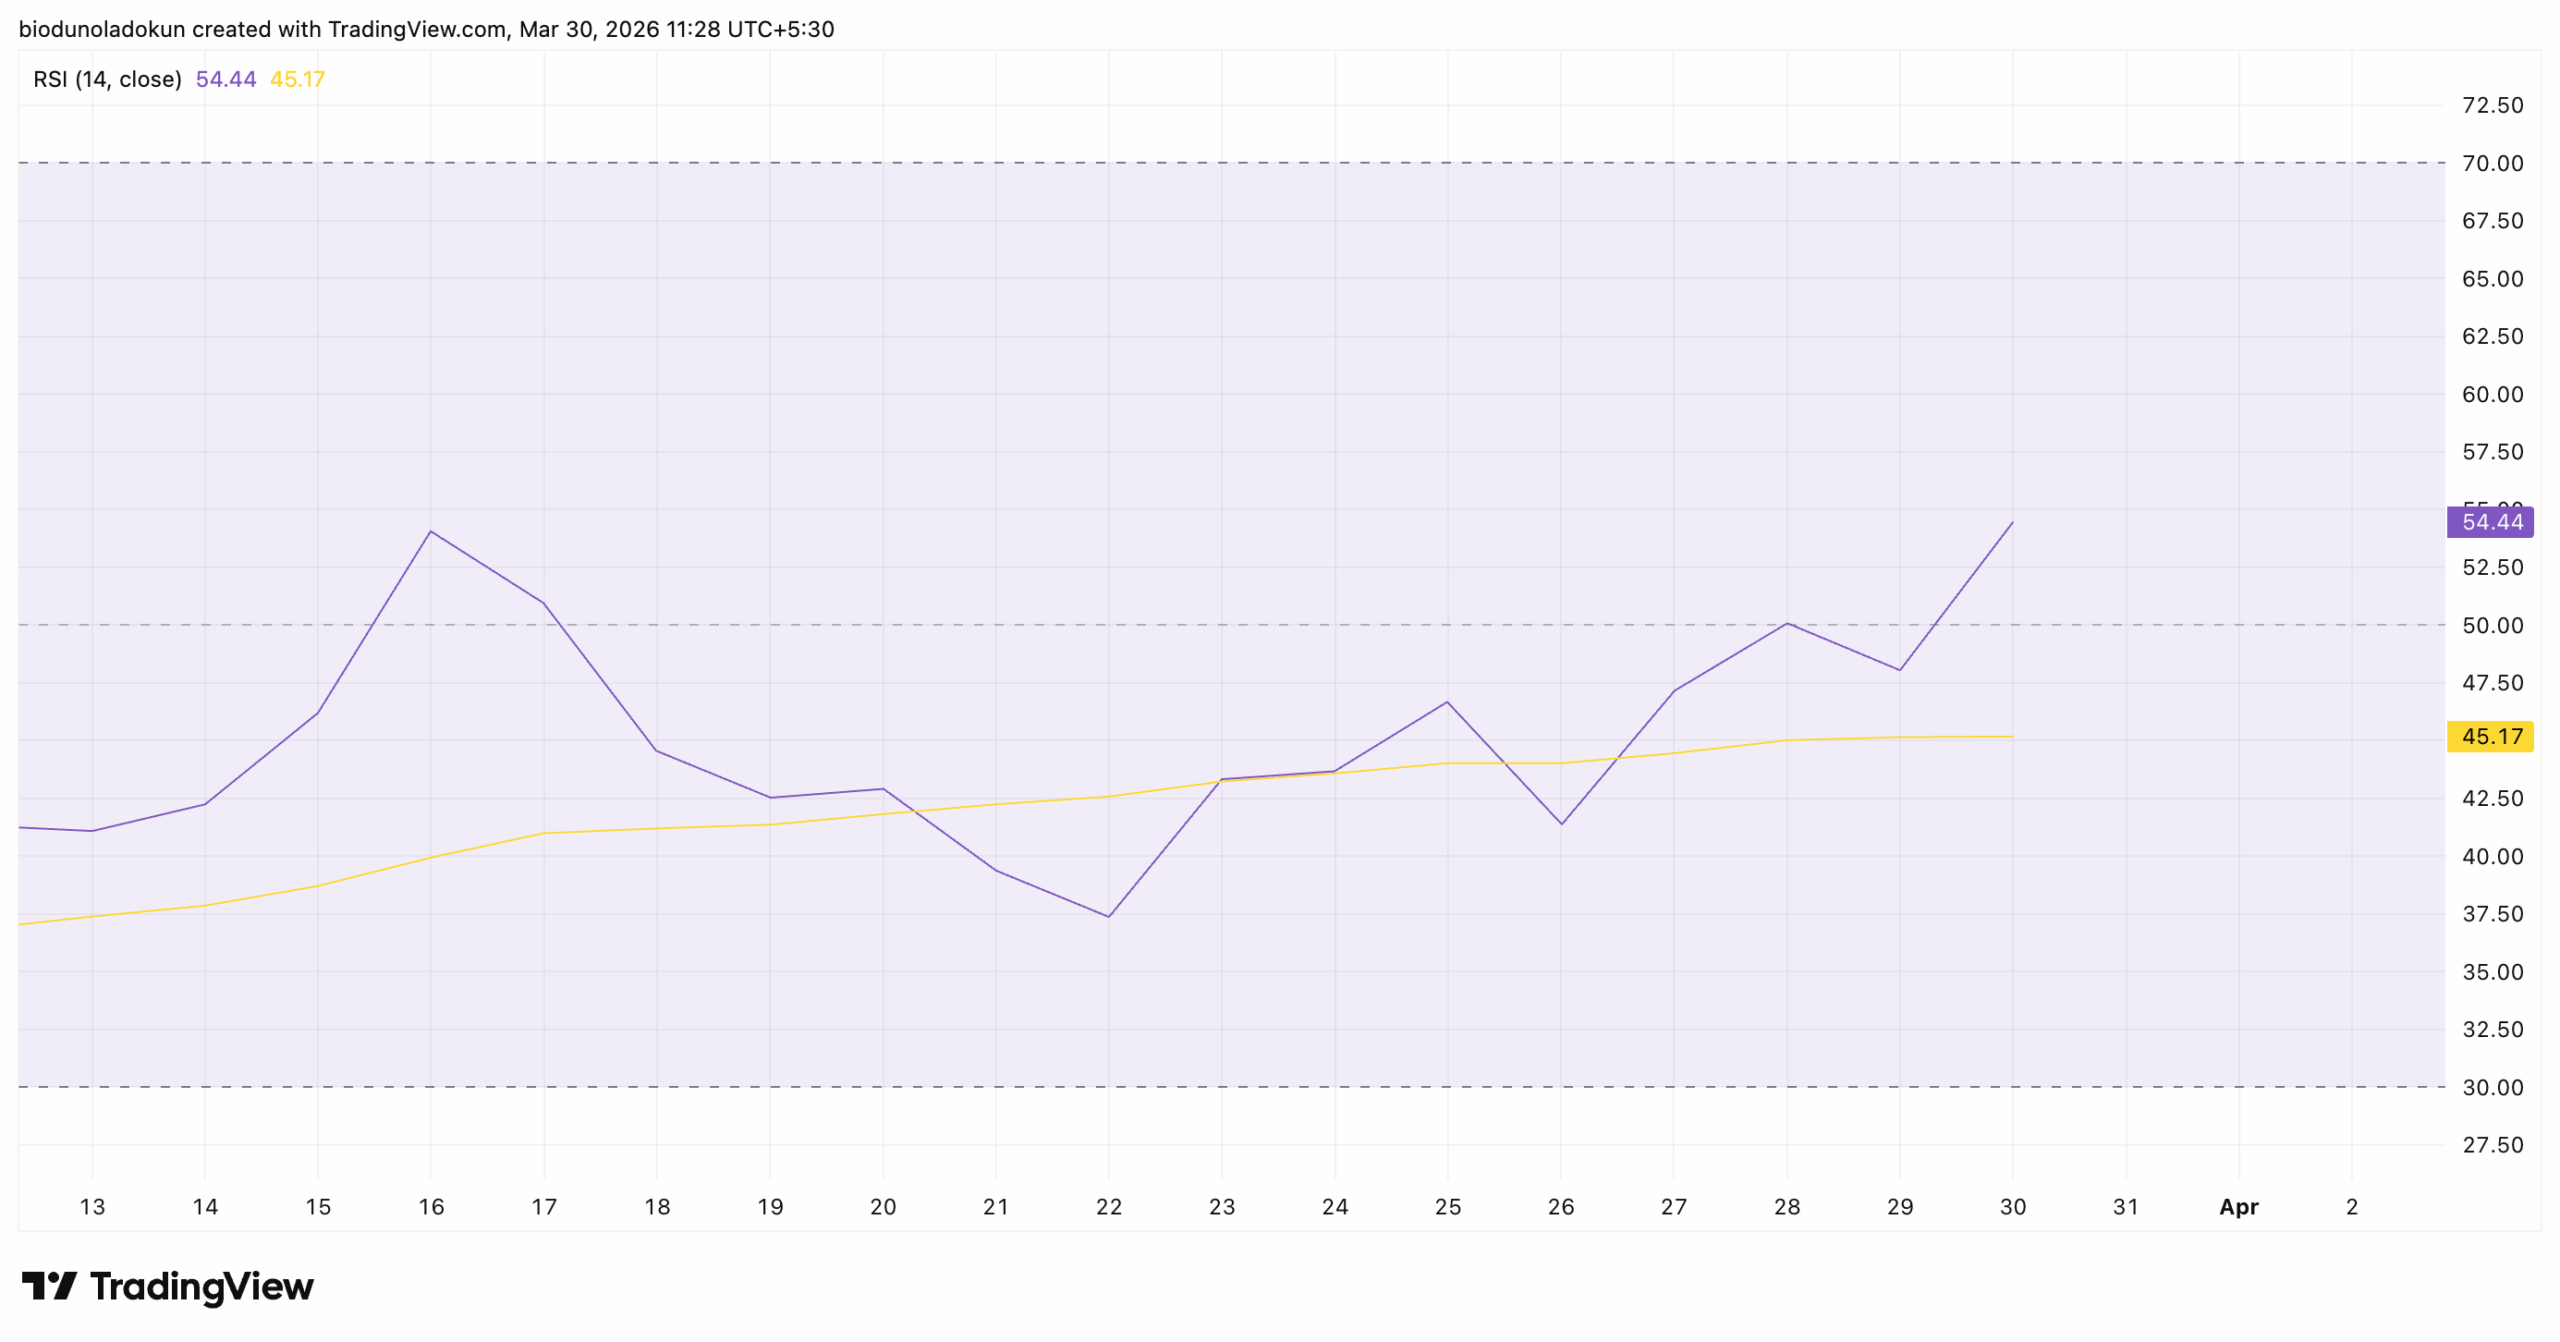
On the daily chart, some key momentum indicators have flipped bullish, supporting the case for further price growth. For example, LDO’s Relative Strength Index (RSI) has climbed above the 50-neutral line and is trending upward, indicating an uptick in buy-side pressure.
The RSI indicator measures whether an asset is being overbought or oversold. When an asset’s RSI rises above 70, it signals that the asset is overbought and a pullback is imminent.
Conversely, when the RSI falls below 30, it signals that the asset is oversold, increasing the likelihood of a price recovery.
At 54.44 and rising, LDO’s RSI is well clear of oversold conditions. This means the token’s price has room to extend before hitting overbought levels.
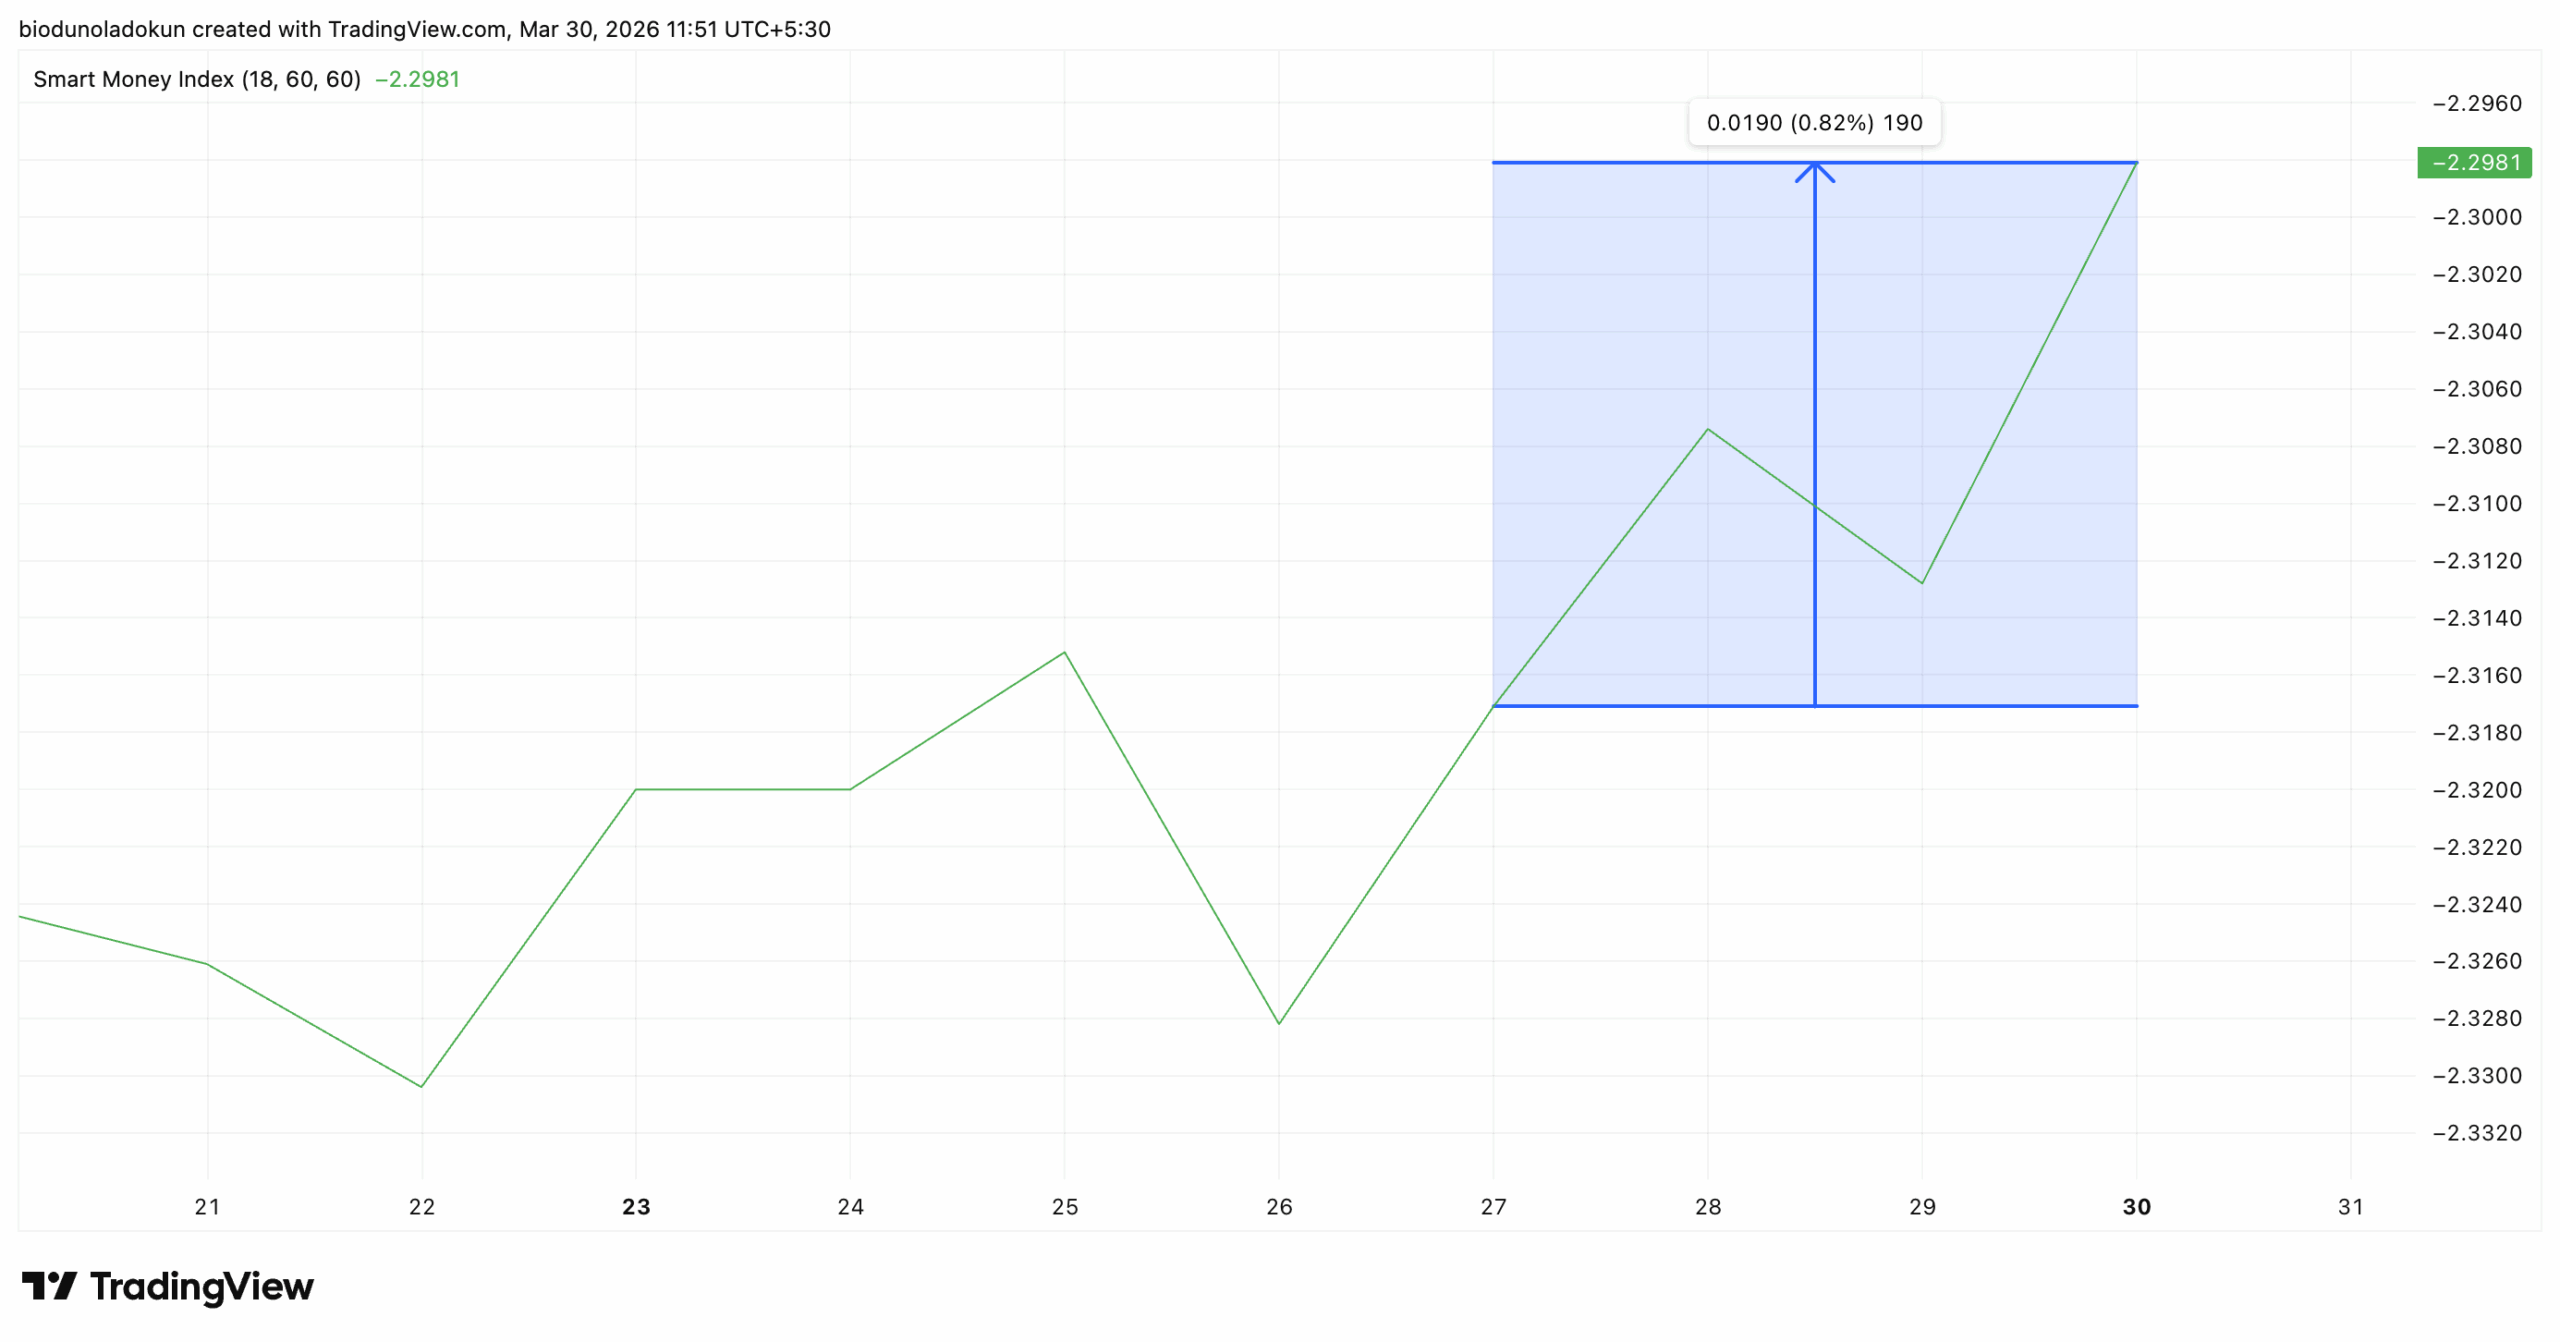
Moreover, its growing Smart Money Index (SMI) also supports this bullish outlook. As of this writing, this indicator is at -2.29, up 1% since the buyback proposal went live on Friday.
Smart money refers to capital managed by institutional investors or seasoned traders with deeper insight into market trends and timing.
The SMI tracks its activity by analyzing intraday price movements. Specifically, it compares morning selling, when retail traders dominate, to afternoon buying, when institutions are more active.
When this indicator trends upward, it indicates that smart money is accumulating the asset, hinting at further rallies.
For LDO, this uptick in institutional interest is significant. This signals the token is attracting informed capital ahead of a potential governance decision.
If sustained, this trend could provide the demand floor needed to push LDO above its sideways channel.
On-Chain Data Points to Seller Exhaustion
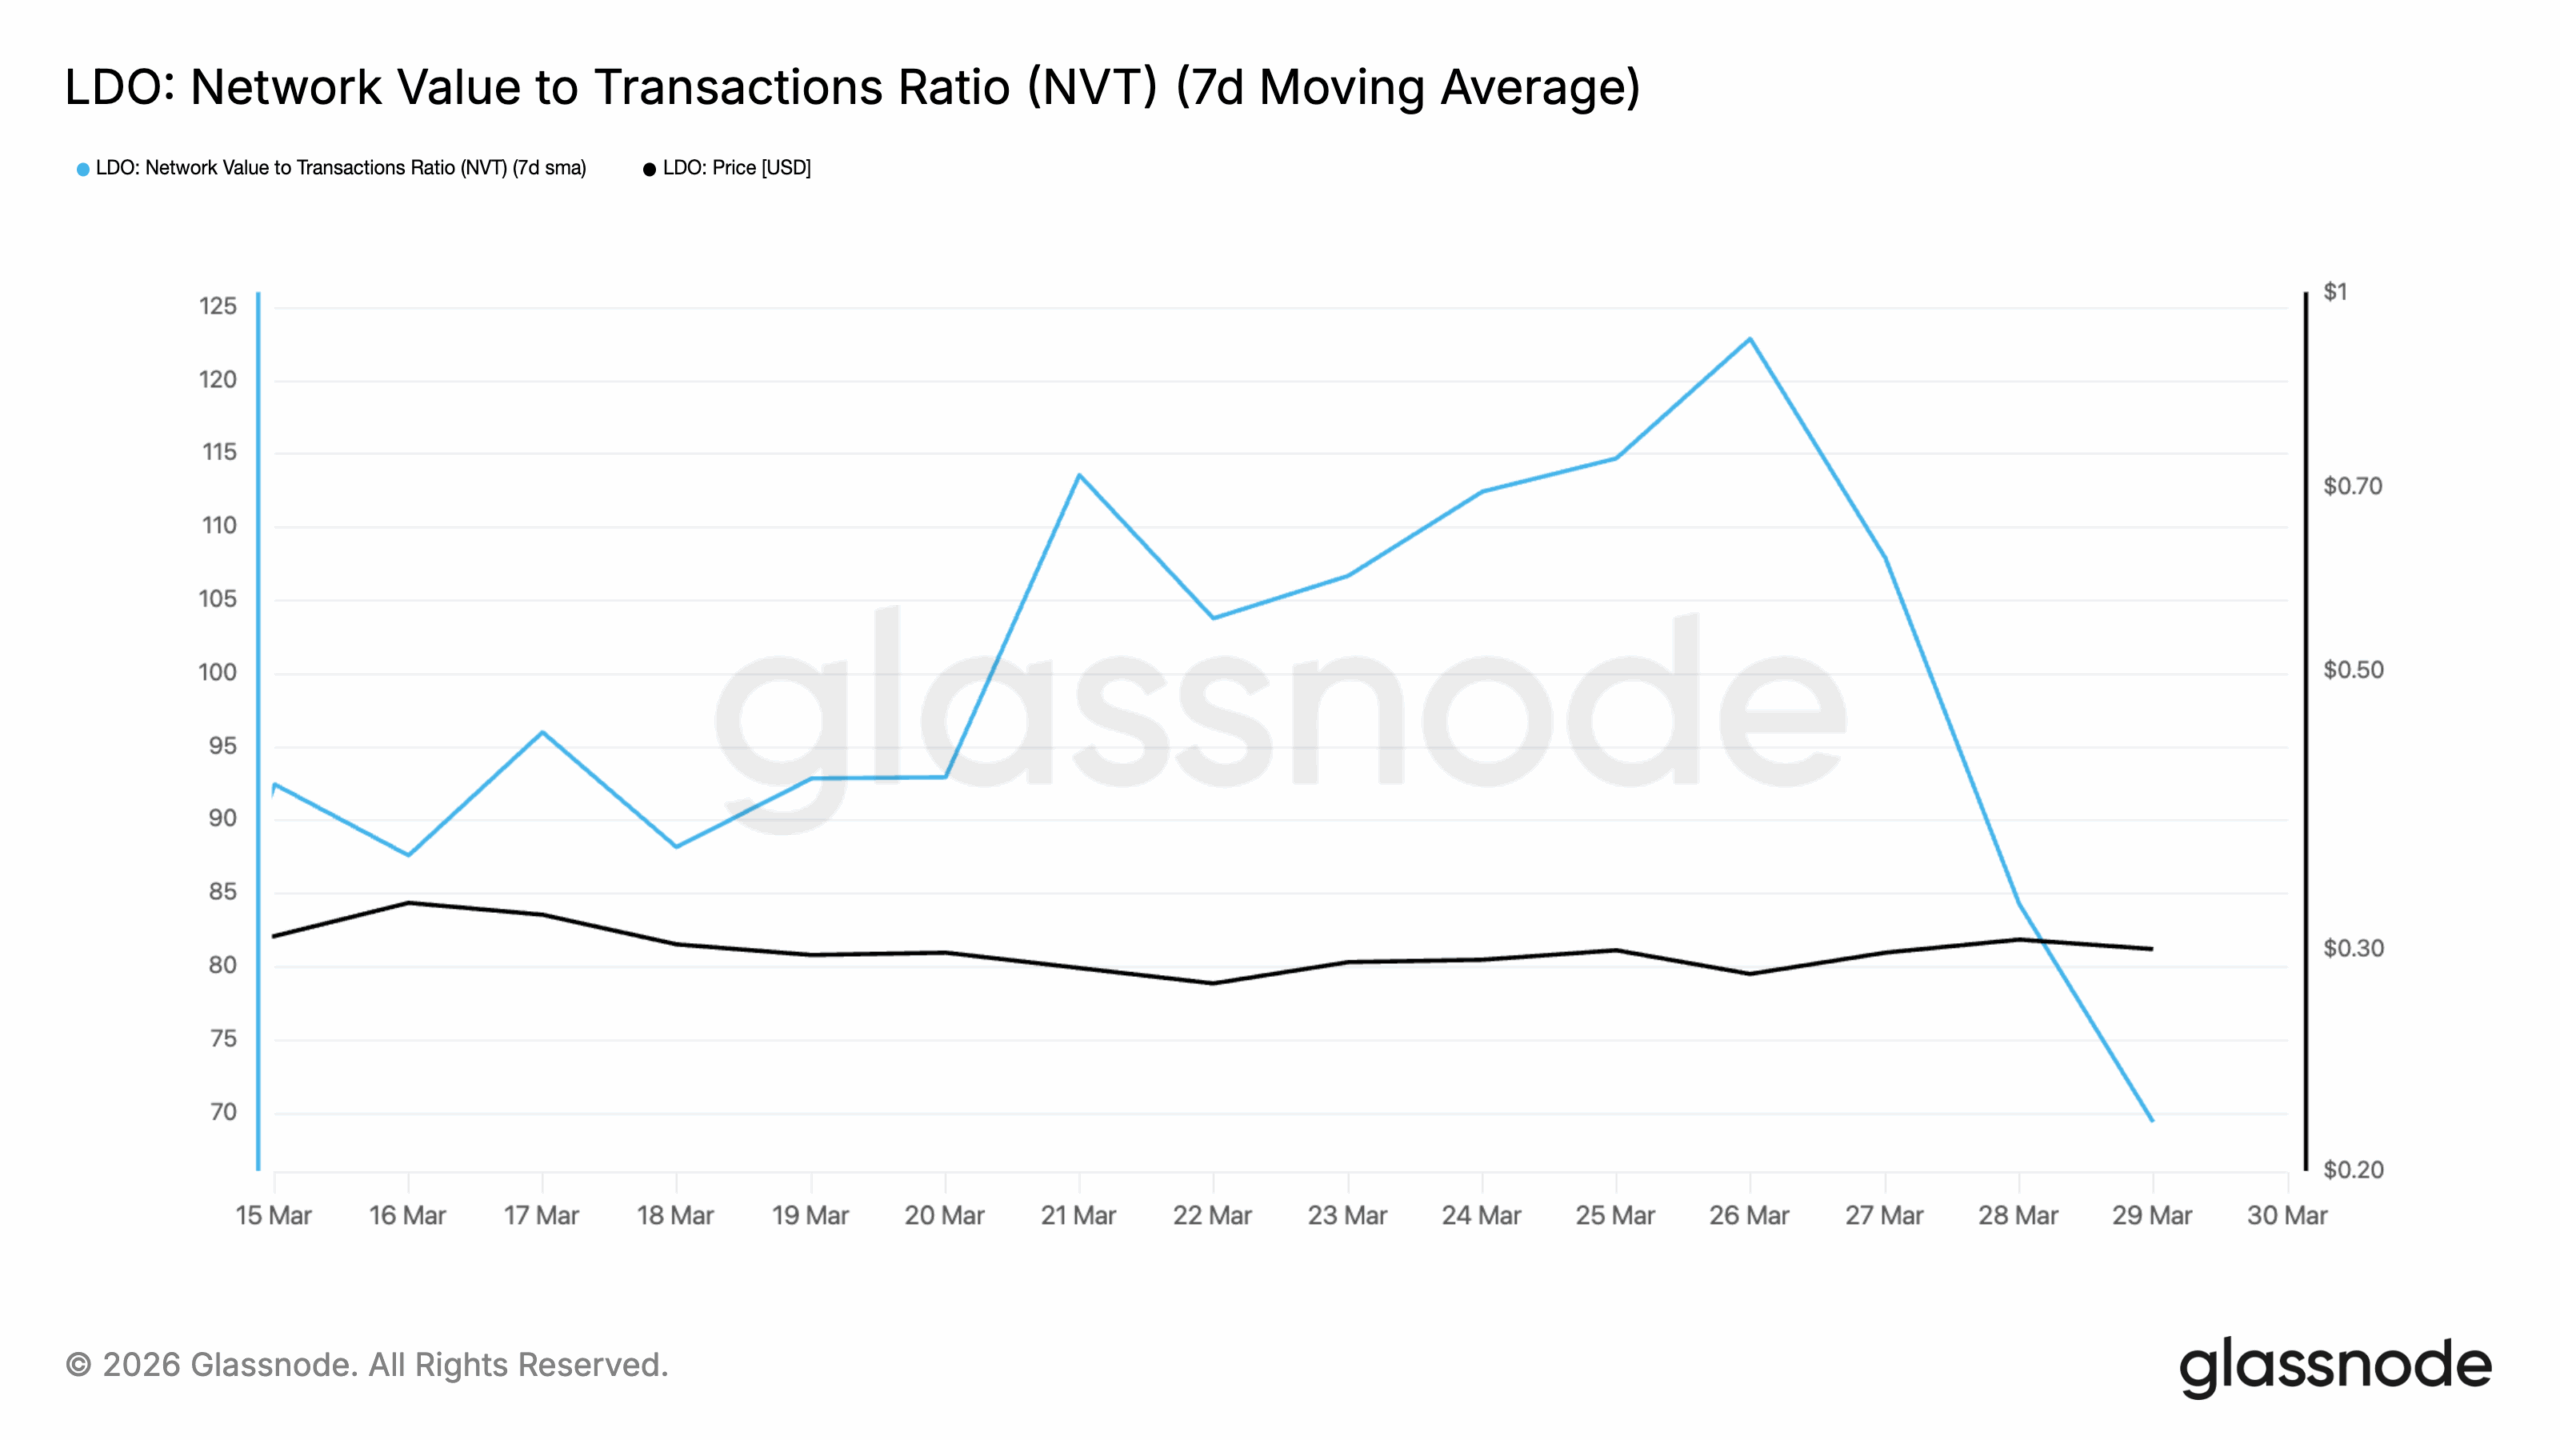
On the on-chain side, broader signs of seller exhaustion are emerging. According to Glassnode, LDO’s Network Value to Transactions (NVT) Ratio (using a 7-day small moving average) has trended downward since March 26, a signal that LDO’s transaction volume is outpacing the token’s current market capitalization.
The NVT ratio gauges whether an asset is overvalued or undervalued by comparing its market capitalization to transaction volume.
When the ratio spikes, it signals that an asset’s market capitalization is growing faster than the volume of value being transacted on its network.
This trend normally precedes downward price corrections.
On the other hand, when it falls like this, network transaction volume outpaces market capitalization growth.
In situations like this, traders interpret a declining NVT as a sign that the asset is undervalued, creating an attractive entry point for those willing to buy low.
Trends like this increase the likelihood of a price recovery as the market catches up to network activity.
Derivatives Traders Are Turning Bullish
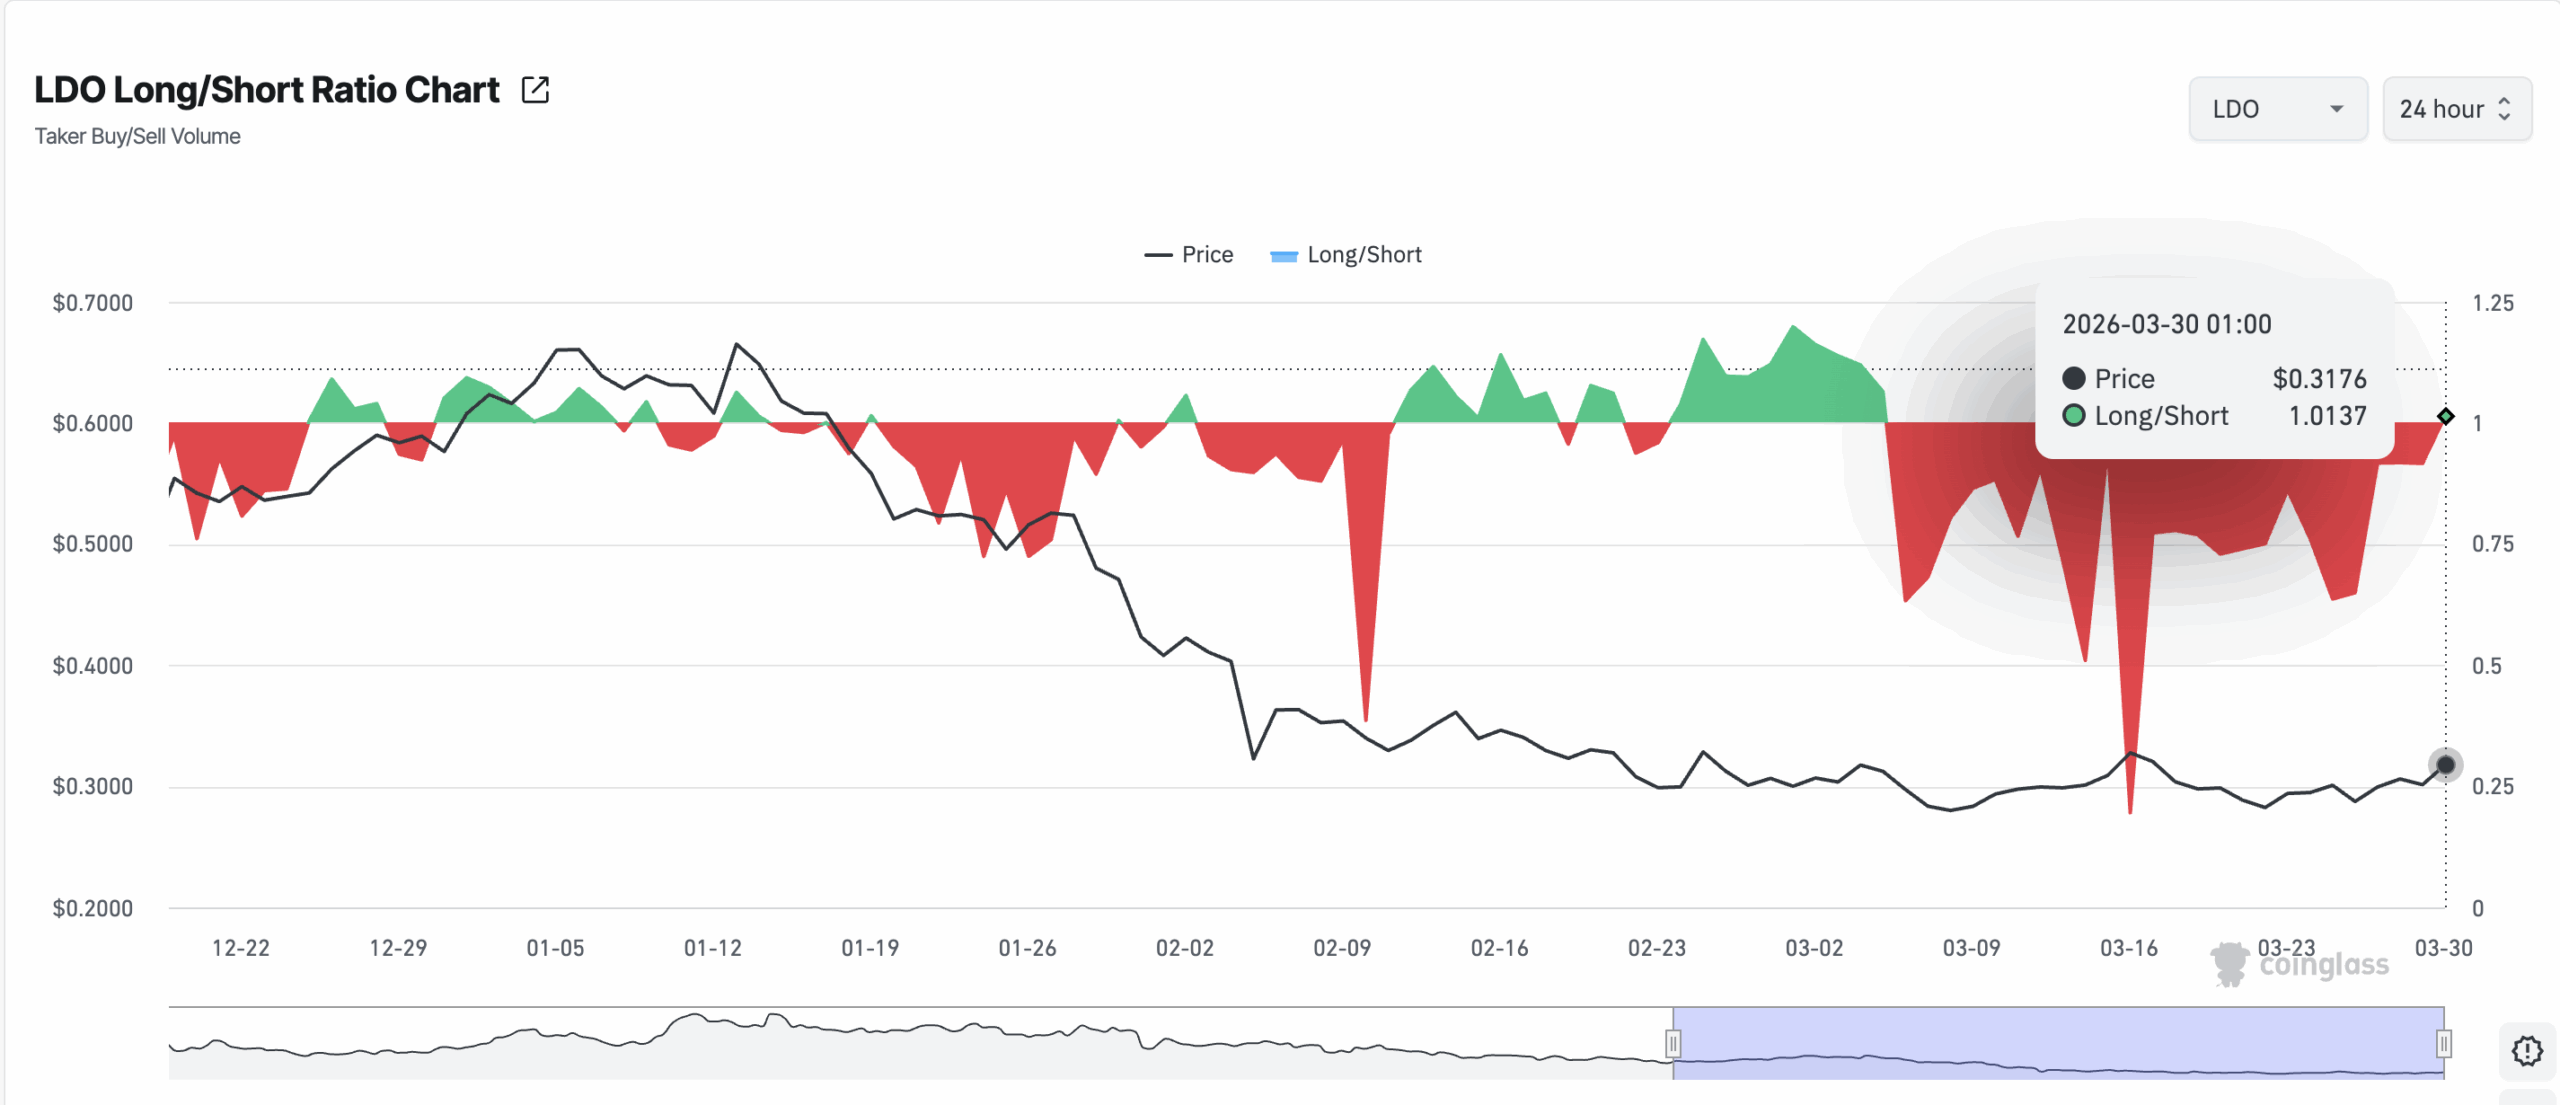
Furthermore, among LDO futures traders, demand for longs currently outpaces shorts — with the long/short ratio flipping above 1.0 to 1.013 on Monday.
This marks a shift in derivatives market sentiment, breaking an extended streak of short-side dominance that had persisted through most of March.
The long/short ratio tracks the balance between traders betting on an asset’s price increases (longs) versus those betting on declines (shorts). When the ratio is below 1, short positions are more prevalent, suggesting bearish expectations.
Conversely, a ratio above 1, like LDO, indicates that long positions dominate, signaling bullish sentiment.
A Break Could Send LDO to $0.43
LDO trades below the upper line of the horizontal channel, which forms a resistance ceiling at $0.32. If new demand soars, a daily close above this zone could push the token’s price toward $0.36.
If bullish momentum extends further, a move toward $0.43 becomes possible, representing a potential 37% gain from current levels.
On the downside, failure to reclaim $0.32 could see LDO retreat toward the $0.27 support floor that has held through the token’s recent lows.
A breach of this price floor could result in a decline toward LDO’s all-time low of $0.23.
Disclaimer:
The information provided in this article is for informational purposes only. It is not intended to be, nor should it be construed as, financial advice. We do not make any warranties regarding the completeness, reliability, or accuracy of this information. All investments involve risk, and past performance does not guarantee future results. We recommend consulting a financial advisor before making any investment decisions.
Abiodun Oladokun is a Research Analyst at CCN, where he covers cryptocurrency markets with a focus on on-chain analysis, technical assessments, and emerging trends across decentralized finance (DeFi), real-world assets (RWA), artificial intelligence (AI), decentralized physical infrastructure networks (DePIN), Layer 2s, and meme coins.
Prior to CCN, he served as a Senior On-Chain Analyst at BeInCrypto, producing market reports spanning diverse crypto sectors.
Before that, he conducted technical analysis and market assessments of various altcoins at AMBCrypto, where he also contributed long-form quarterly research papers on DeFi, NFTs, DAOs, and scaling architectures, leveraging on-chain platforms including Messari, Santiment, DefiLlama, and Dune Analytics.
He began his crypto career as a research analyst at SixthSense DAO, developing blockchain forensic tools to trace the history of stolen assets.
Abiodun is a lawyer called to the Nigerian Bar and the founder of Ilé Ijó, a Lagos-based electronic dance music collective.