Lido’s share of total ETH staked has fallen to a year-to-date low of 22.82%.
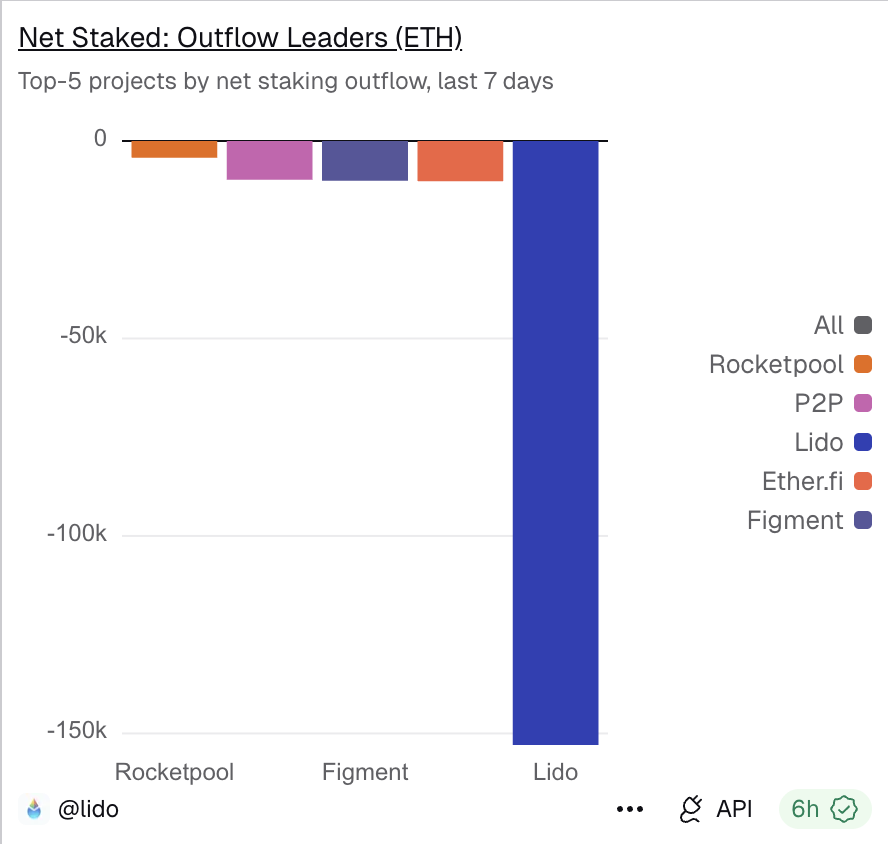
Lido recorded net outflows of approximately 150,000 ETH in the past seven days.
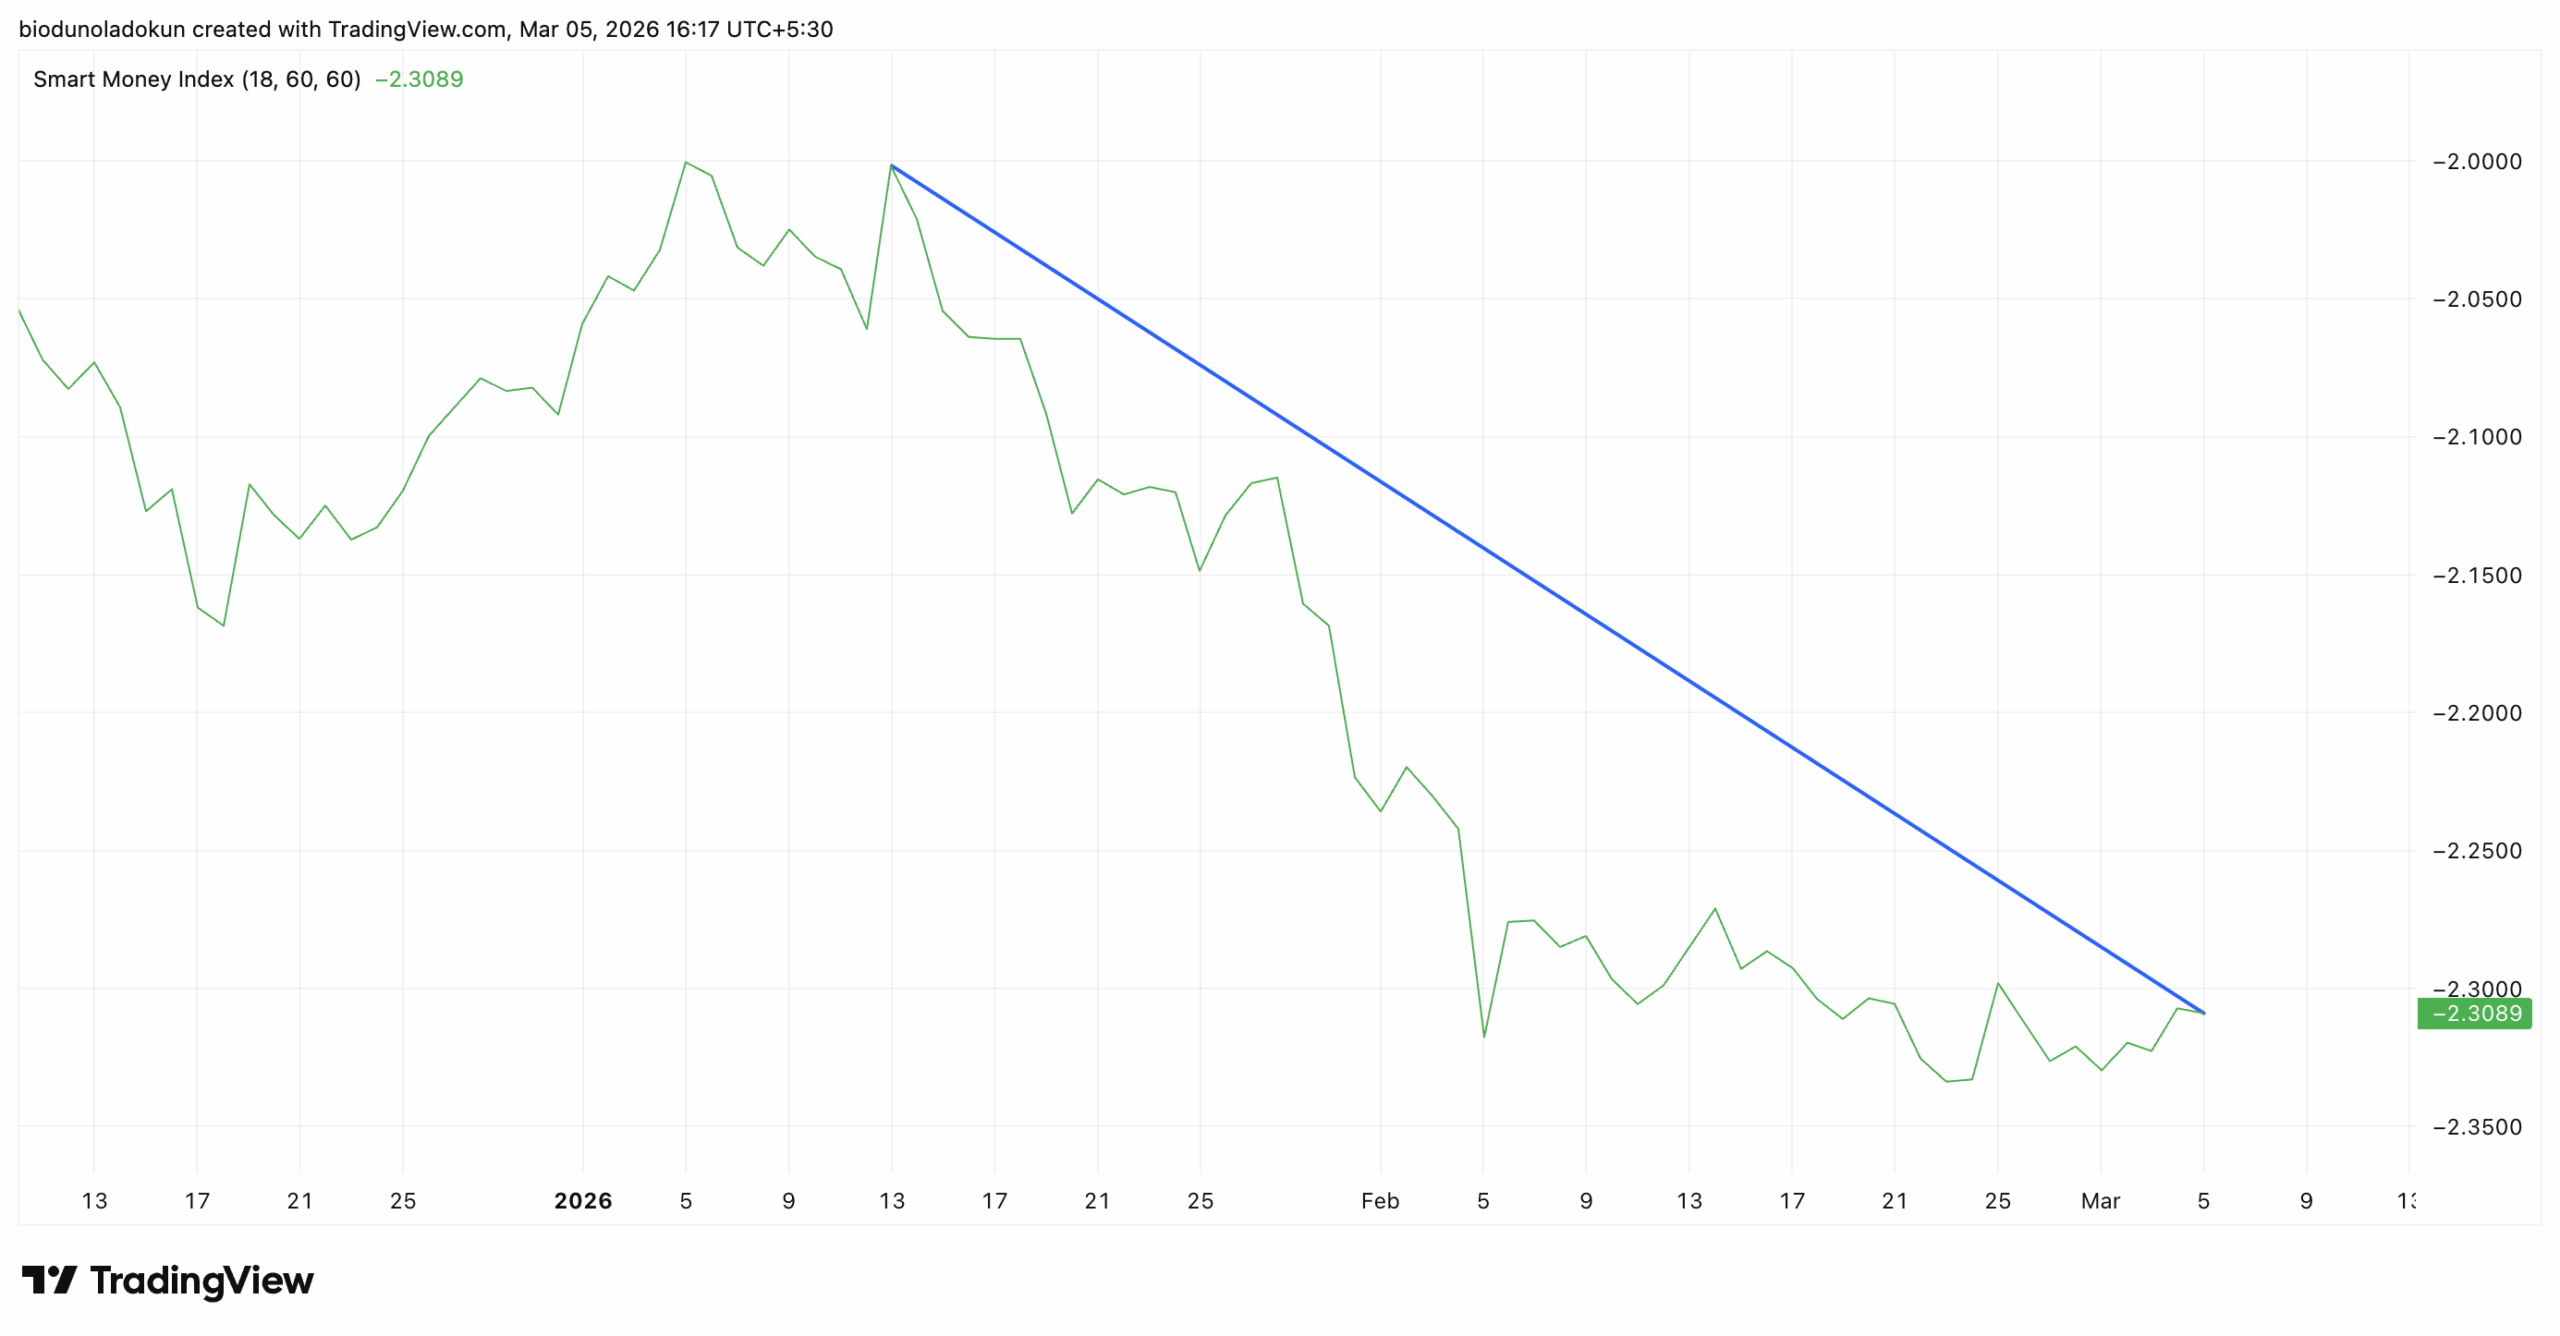
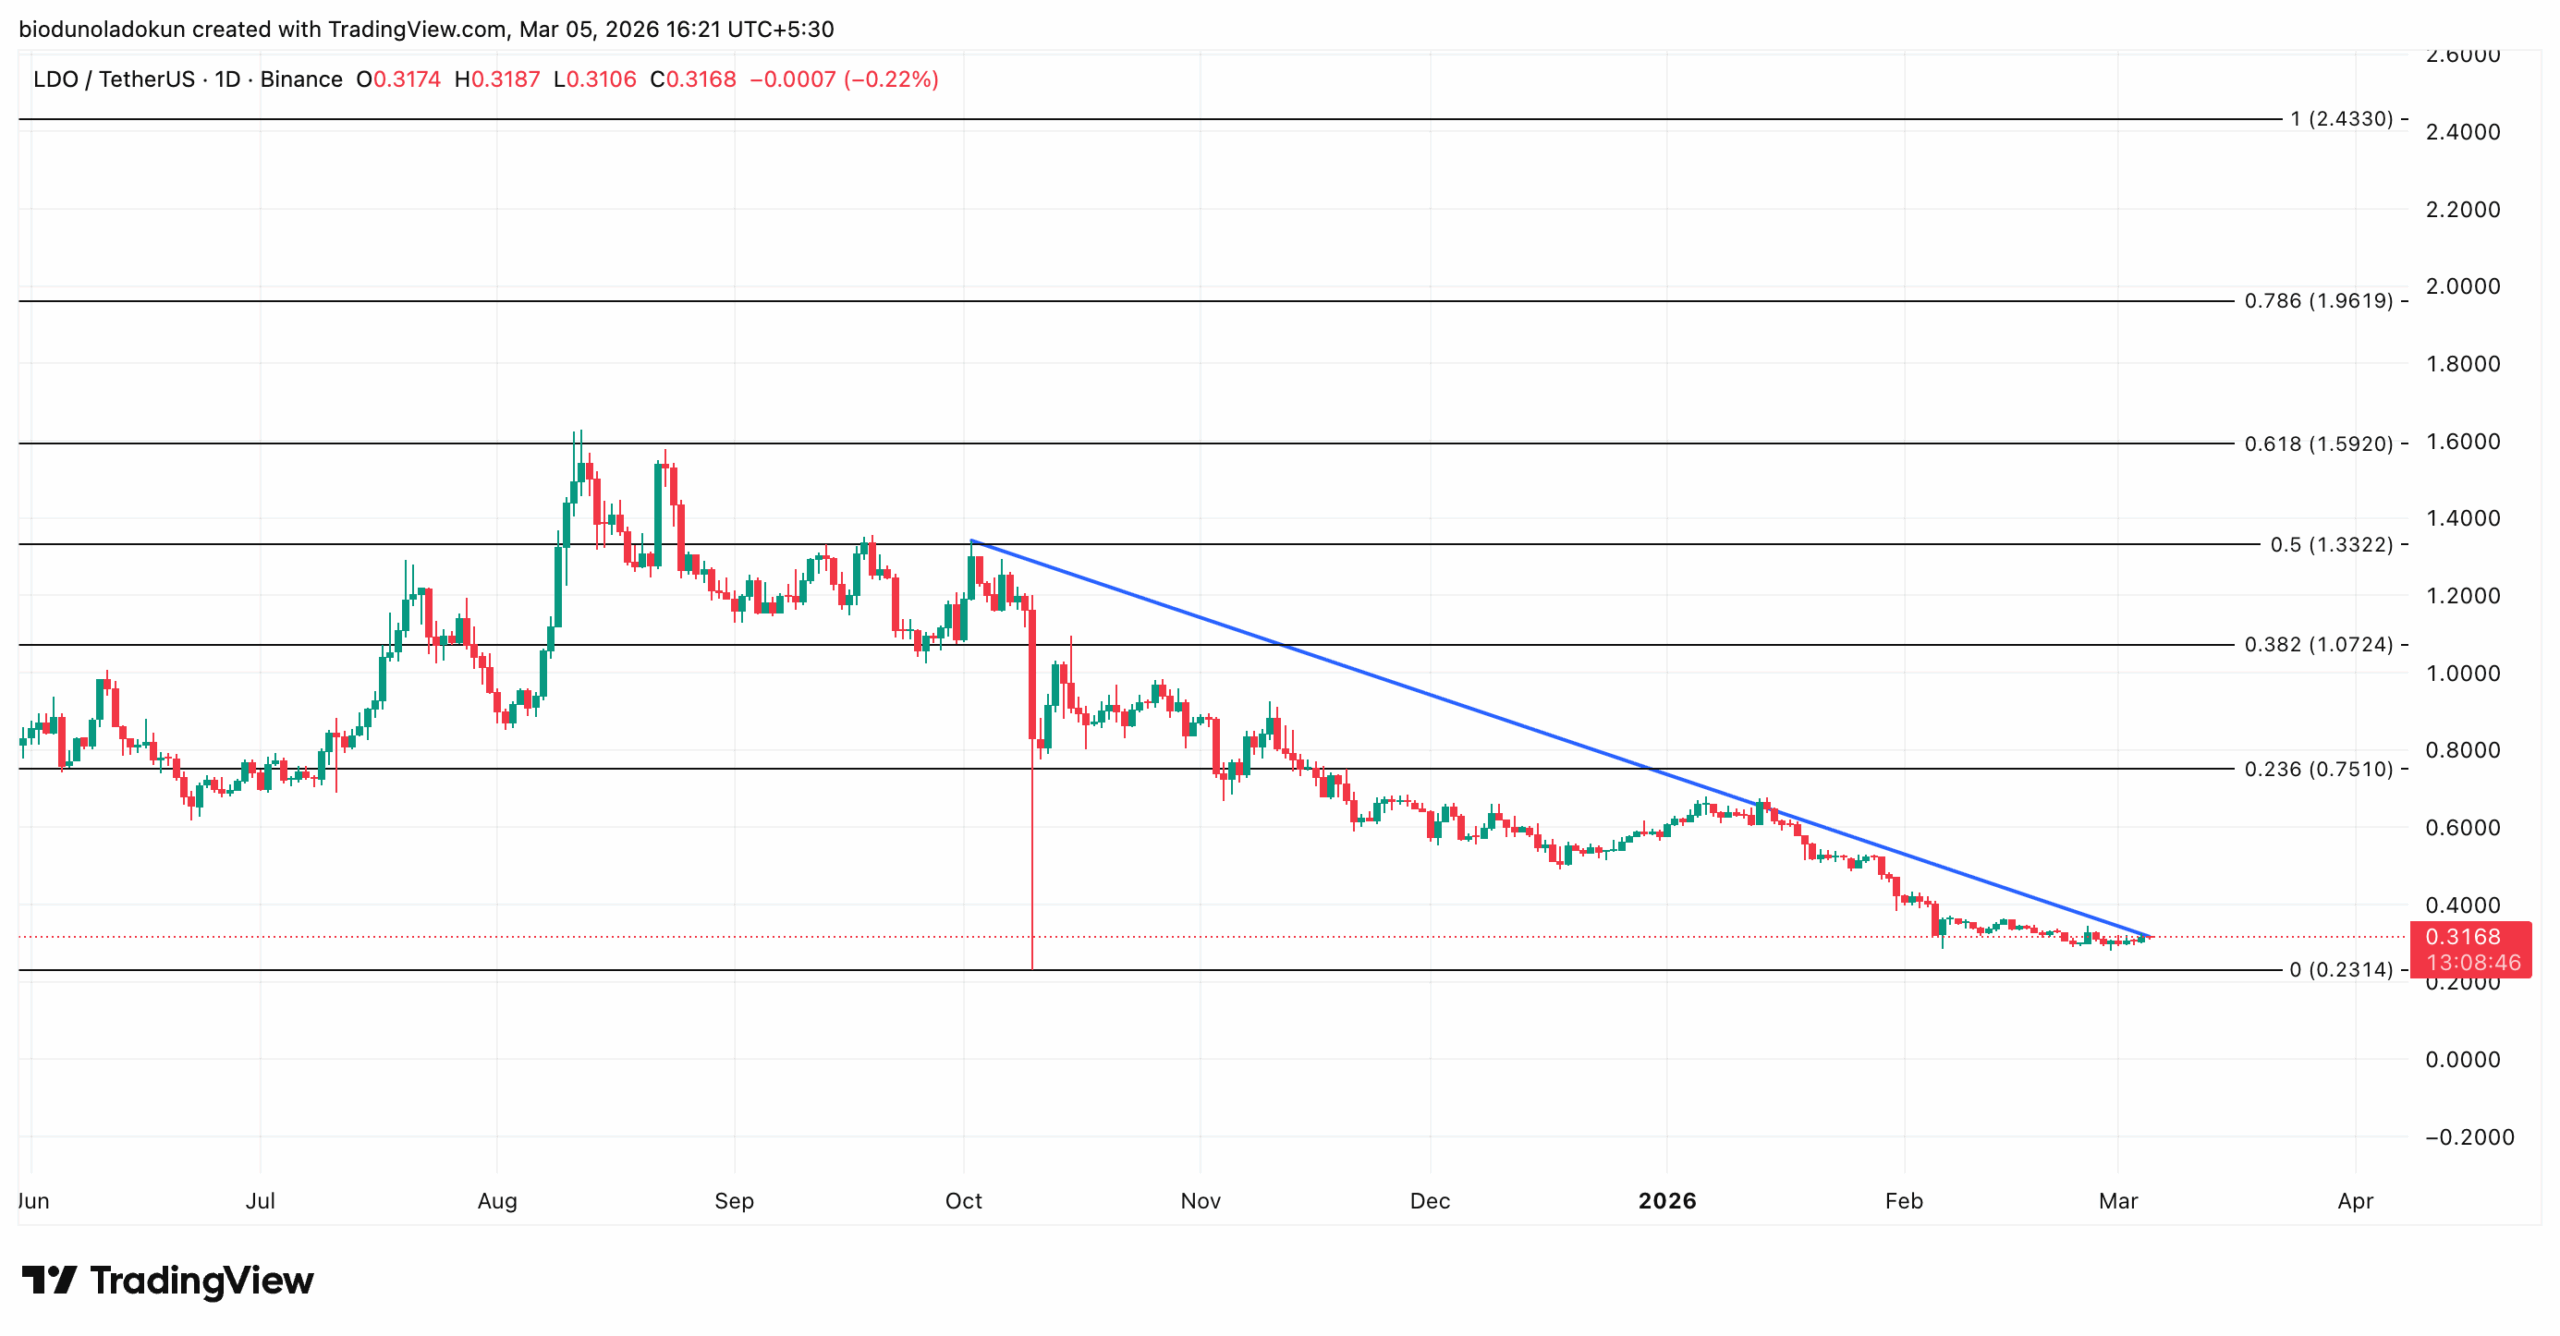
LDO has lost nearly 80% of its value since October, with a declining Smart Money Index signalling institutional distribution and further downside risk.
Leading Ethereum-based decentralized liquid staking protocol Lido Finance is steadily losing market share in the staking ecosystem.
The protocol’s share of total ETH staked on the BeaconChain has fallen to a year-to-date low of 22.82%. This marks a 10% dip from the 32% peak it commanded in 2023.
Since that peak, competing staking providers have multiplied and captured a growing share of Ethereum’s validator ecosystem, chipping away at Lido’s dominance.
Lido’s Collapsing APR Is Driving Stakers to Competitors
An assessment of recent net staking inflows and outflows across protocols reveals Lido’s gradual loss of market share.
According to a Dune Analytics dashboard, Lido recorded net outflows of approximately 150,000 ETH over the past seven days, surpassing the combined net outflows of every other protocol tracked in the chart.
Top-5 Projects by Net Staking Outflow | Credit: Dune Analytics
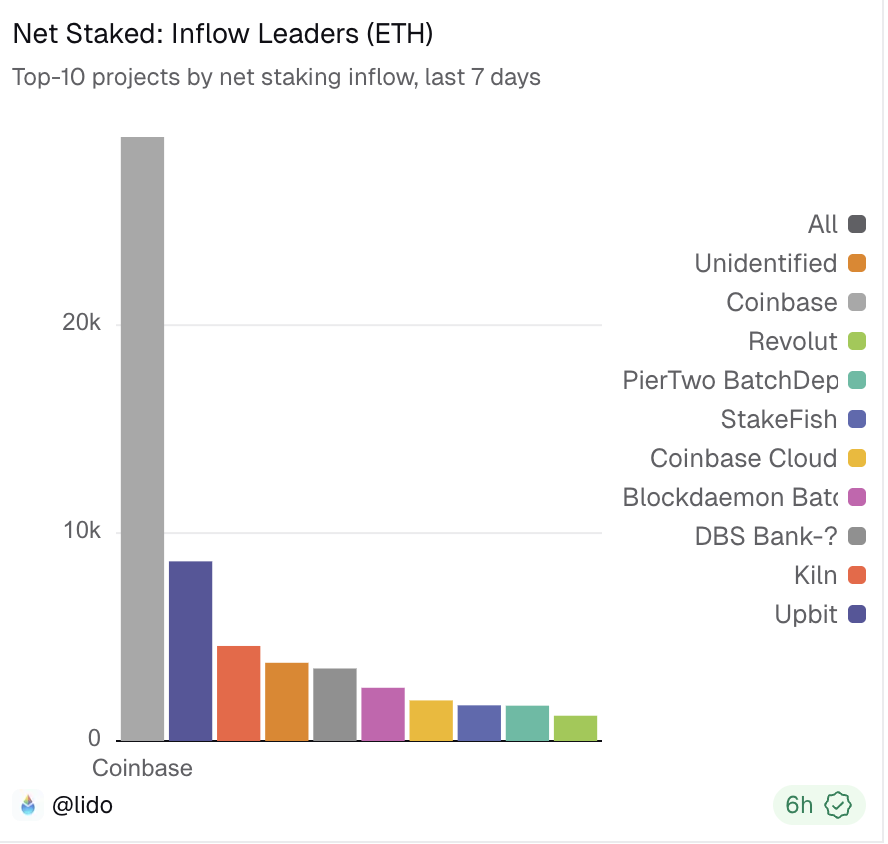
On the other side sits Coinbase. The exchange topped the inflow leaderboard over the same period, recording 29,050 ETH in net staking deposits.
Top-10 Projects by Net Staking Inflow | Credit: Dune Analytics
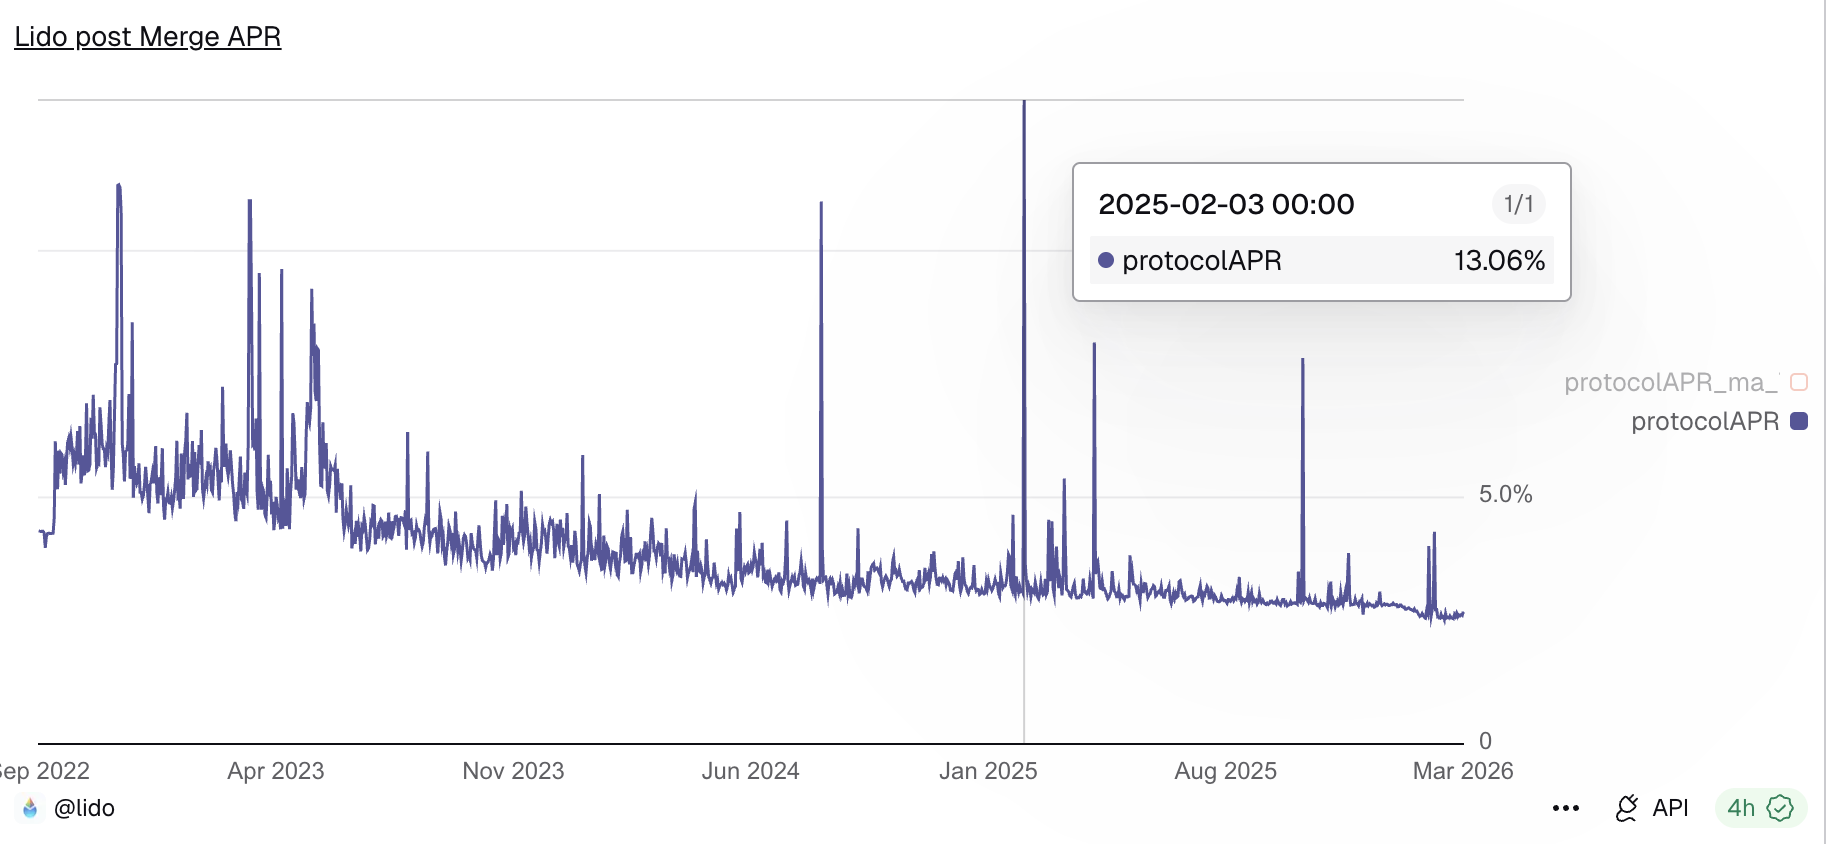
The underlying driver of this shift is clear. Lido’s total protocol Annual Percentage Rate (APR) now stands at 2.62, falling steadily over the years. For context, this stood at 13.06% on February 3, 2025.
With compressed returns on Lido and the number of competing protocols climbing, capital is actively rotating out of its ecosystem and into competitors, a trend that has also impacted the performance of its LDO token over the past few months.
LDO Bears Are in Control
The steady erosion of Lido’s market share has shaken confidence in its native token. LDO has been trending downward since October last year, losing nearly 80% of its value, and may continue to decline.
Technical chart readings show a dip in the token’s Smart Money Index (SMI) since the year began. As of this writing, this key momentum indicator rests at -2.208.
Smart money refers to capital controlled by institutional investors or experienced traders who understand market trends and timing more deeply.
The SMI tracks the behavior of these investors by analyzing intraday price movements. Specifically, it measures selling in the morning (when retail traders dominate) versus buying in the afternoon (when institutions are more active).
A rising SMI signals that smart money is accumulating an asset, often ahead of major price moves.
Conversely, as with LDO, when this momentum indicator records an extended decline, it means these sophisticated investors are quietly distributing their holdings.
This pattern of sustained smart money outflow is often a precursor to prolonged price weakness, putting LDO at risk of further downside.
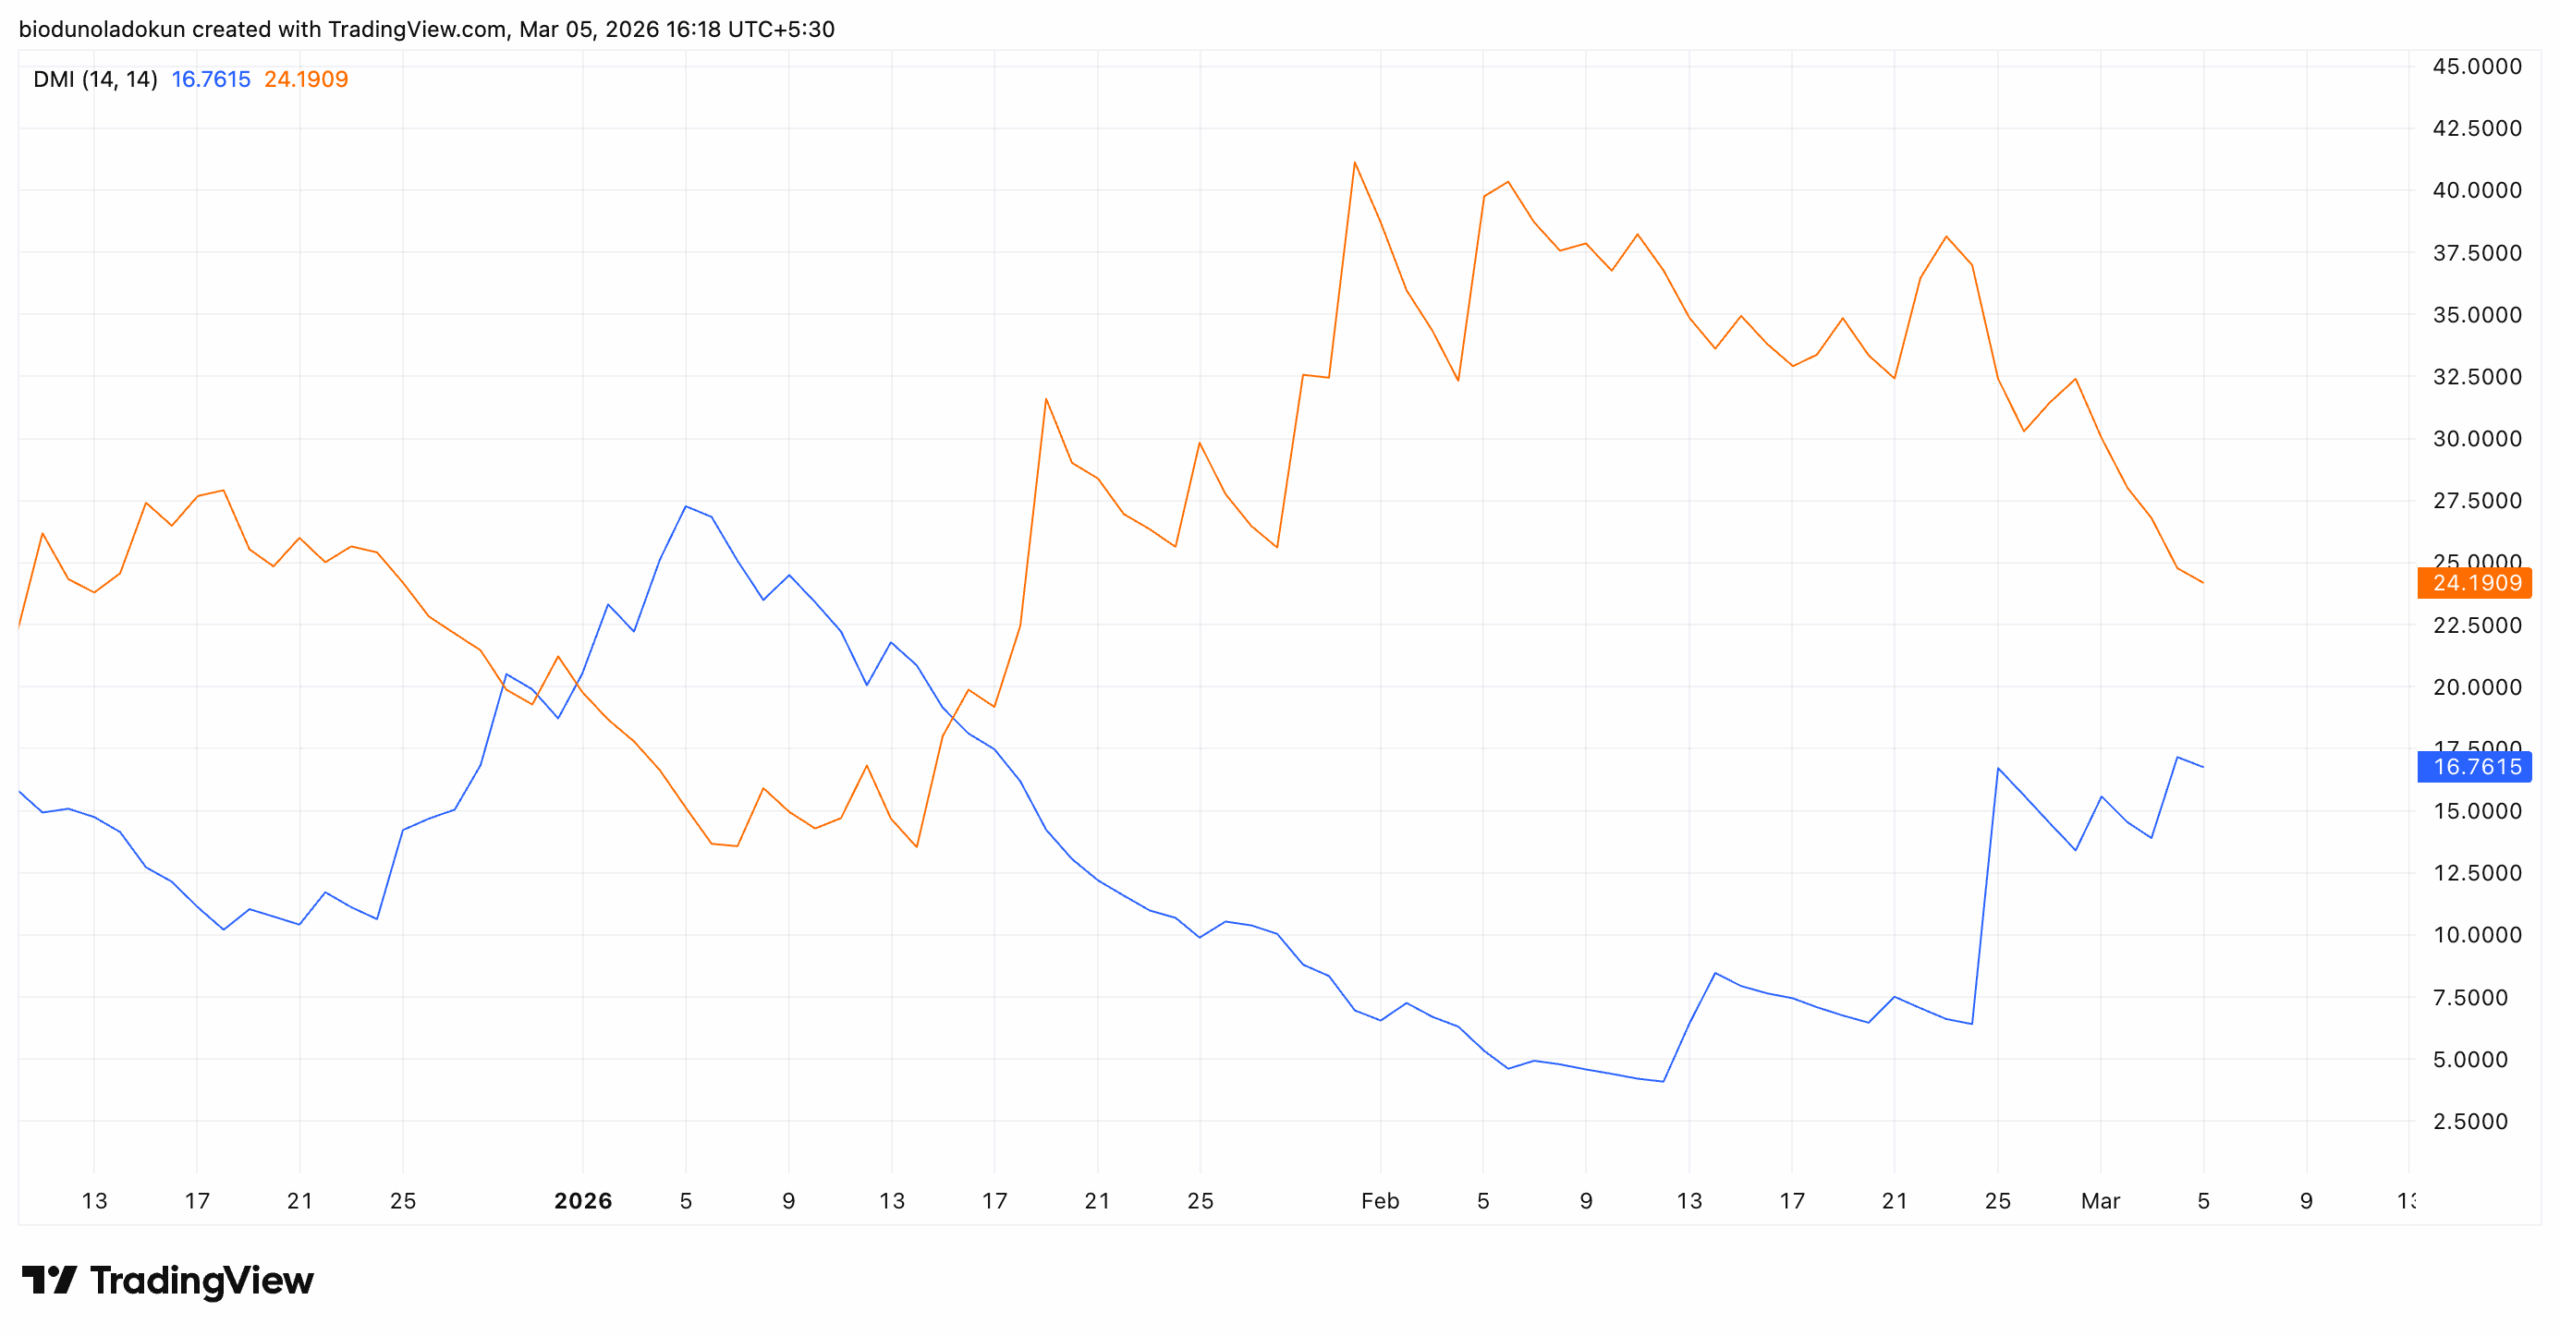
Furthermore, the setup of LDO’s Directional Movement Index (DMI) supports this negative outlook.
At press time, the token’s positive directional index (+DI) (blue) is above the negative directional index (-DI) (orange), highlighting bearish market strength.
The DMI indicator measures the strength of an asset’s price trend. It consists of two lines: the +DI, which represents upward price movement, and the -DI, which means downward price movement.
The market trend is bullish when the +DI rests above the -DI. On the other hand, when the -DI lies atop the +DI, selling pressure is high.
If this persists for LDO, it risks extending its decline below $0.30 and falling to $0.23.
However, if sentiment shifts and LDO demand rockets, it could break above the descending trendline and climb toward $0.75.
[You-may-like]
Disclaimer:
The information provided in this article is for informational purposes only. It is not intended to be, nor should it be construed as, financial advice. We do not make any warranties regarding the completeness, reliability, or accuracy of this information. All investments involve risk, and past performance does not guarantee future results. We recommend consulting a financial advisor before making any investment decisions.
Abiodun Oladokun is a Research Analyst at CCN, where he covers cryptocurrency markets with a focus on on-chain analysis, technical assessments, and emerging trends across decentralized finance (DeFi), real-world assets (RWA), artificial intelligence (AI), decentralized physical infrastructure networks (DePIN), Layer 2s, and meme coins.
Prior to CCN, he served as a Senior On-Chain Analyst at BeInCrypto, producing market reports spanning diverse crypto sectors.
Before that, he conducted technical analysis and market assessments of various altcoins at AMBCrypto, where he also contributed long-form quarterly research papers on DeFi, NFTs, DAOs, and scaling architectures, leveraging on-chain platforms including Messari, Santiment, DefiLlama, and Dune Analytics.
He began his crypto career as a research analyst at SixthSense DAO, developing blockchain forensic tools to trace the history of stolen assets.
Abiodun is a lawyer called to the Nigerian Bar and the founder of Ilé Ijó, a Lagos-based electronic dance music collective.