After reaching its new yearly high, the price of HBAR entered a corrective phase. Descending triangle formed and a breakout is now awaited.
Share
Key Takeaways
HBAR peaked at $0.38 on Dec. 3, marking strong bullish momentum.
The price is retracing toward $0.26, aligning with key Fibonacci support.
If support holds, HBAR could target $0.40 and $0.50 next.
Hedera (HBAR) recently completed a strong rally, with wave 3 peaking at $0.38 on December 3 after breaking out from a prolonged consolidation near $0.15.
It sits 27% lower as a correction developed after reaching its yearly high.
The price is retracing toward key Fibonacci support levels, setting the stage for a potential wave 5 breakout toward new highs.
HBAR recently completed a significant rally, with wave 3 of the Elliott Wave sequence peaking at $0.38 on Dec. 3, demonstrating robust bullish momentum.
This rally followed a 10-day accumulation phase, where the price consolidated near $0.15 before breaking out decisively in late November.
HBARUSD entered overbought conditions at its recent peak | Credit: Nikola Lazic/TradingView
The impulsive nature of wave 3 is evident, supported by strong volume and momentum indicators like the Relative Strength Index (RSI) entering overbought levels.
Currently, HBAR is retracing from its wave 3 high, signaling the start of wave 4 correction. The price has dipped to $0.23, approaching the 0.382 Fibonacci retracement level at $0.26, a key support zone.
This correction phase aligns with Elliott Wave principles, where wave 4 typically retraces part of wave 3’s gains but avoids entering wave 1 territory. RSI has cooled off, supporting a potential stabilization.
For the next move, wave 5 is anticipated to follow once the wave 4 correction is completed. If HBAR holds above $0.26, it could aim for higher Fibonacci extensions, with potential targets around $0.40 and $0.50.
Key Observations
Wave 3 Completion: HBAR peaked at $0.38, signaling the end of wave 3.
Wave 4 Correction: The price is retracing toward $0.26, aligning with the 0.382 Fibonacci level.
Support Zone: Critical support lies at $0.26 and $0.22 for wave 4 stabilization.
Resistance Levels: The key resistance is $0.36, with potential wave 5 targets at $0.40 and $0.50.
RSI Cooling: RSI has declined from overbought levels, indicating a healthy correction phase.
HBAR Price Prediction
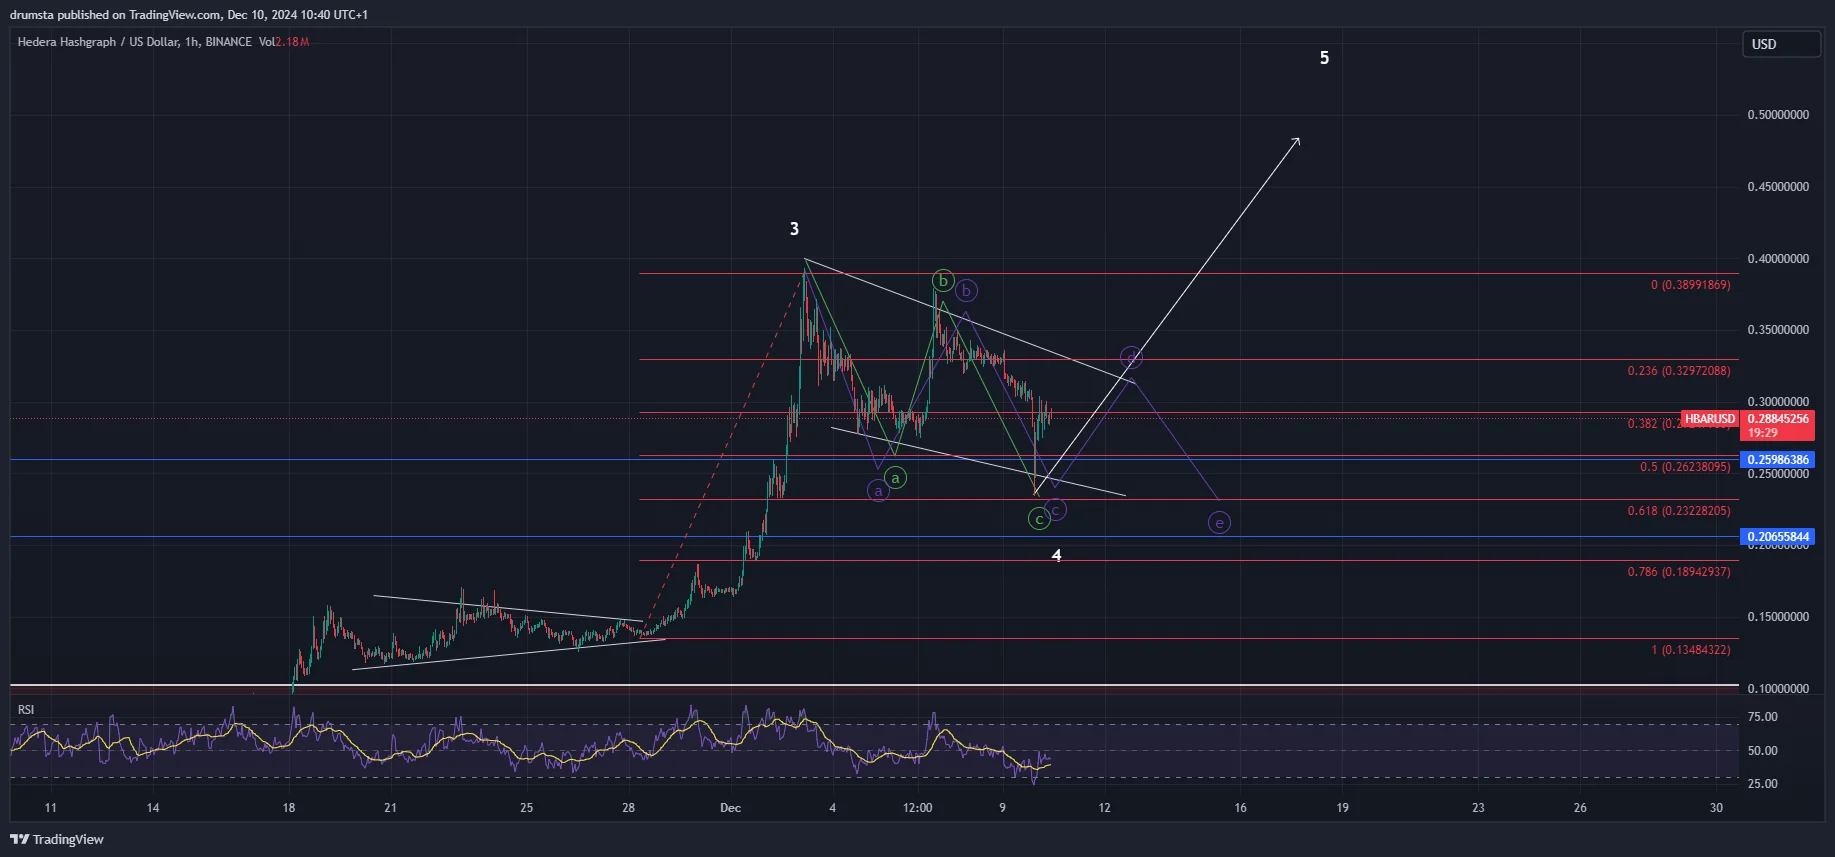
The hourly chart confirms that HBAR is in a corrective phase since its recent high. The price is now forming wave 4 within a descending triangle pattern, a typical corrective structure.
This phase is characterized by lower highs and stable support zones, which align with the Fibonacci retracement levels. Conversely, RSI has cooled significantly from overbought levels, reflecting a balanced market sentiment.
HBARUSD descending triangle forming | Credit: Nikola Lazic/TradingView
Its Dec. 9 low led to an interaction with the 0.618 Fib retracement, which could have marked the completion of the ABC correction. However, the price quickly snapped back above $0.28 and is now attempting to proceed further to the upside.
This leaves us with two scenarios ahead. Either the current move is the start of wave 5 and will result in an upward breakout, or this is the wave D with one more low for wave E to develop before completion.
Wave 5 could target the previous high at $0.36 and extend toward higher Fibonacci levels, such as $0.40 or beyond, depending on market momentum.
However, a breakdown below $0.23 would invalidate the bullish wave count and signal a deeper correction. The breakout direction from the descending triangle’s boundaries and key Fibonacci levels will determine the next major move.
Key Levels to Watch
Support Levels:
$0.26 (0.382 Fibonacci): Immediate and strong support zone for wave 4.
$0.23 (0.5 Fibonacci): Critical structural support sustains the bullish outlook.
$0.20: Deeper support, marking a potential invalidation of the bullish wave count.
Resistance Levels:
$0.30: Immediate resistance near the triangle’s upper boundary.
$0.36: Key resistance and the previous high of wave 3.
$0.40: Extended wave 5 target, aligning with higher Fibonacci projections.
Disclaimer:
The information provided in this article is for informational purposes only. It is not intended to be, nor should it be construed as, financial advice. We do not make any warranties regarding the completeness, reliability, or accuracy of this information. All investments involve risk, and past performance does not guarantee future results. We recommend consulting a financial advisor before making any investment decisions.
Nikola Lazic is a cryptocurrency analyst and investor working in the industry since 2017. He holds a bachelor's degree in Sociology, which enables him to better understand the psychology behind the crowd´s positioning. Consequently his preferred analytical tool is Elliott Wave Theory in combination with price action analysis.
Combining his experience in trading and investing with knowledge in content writing he strives to bring the most accurate and actionable information.