GOAT signaling two potential outcomes. Which one will get confirmed?
Share
Key Takeaways
A descending wedge breakout suggests bullish momentum.
The price is testing resistance at the 0.618 Fibonacci level.
RSI indicates rising momentum but is nearing overbought levels.
A break above 0.618 could lead to higher targets; rejection may result in a pullback.
The price of Goatseus Maximus (GOAT) is navigating a corrective pattern within a descending channel, following a prior impulsive wave.
Currently, the price is testing key Fibonacci levels, with a breakout above resistance, signaling bullish potential, while a breakdown below support could lead to further declines.
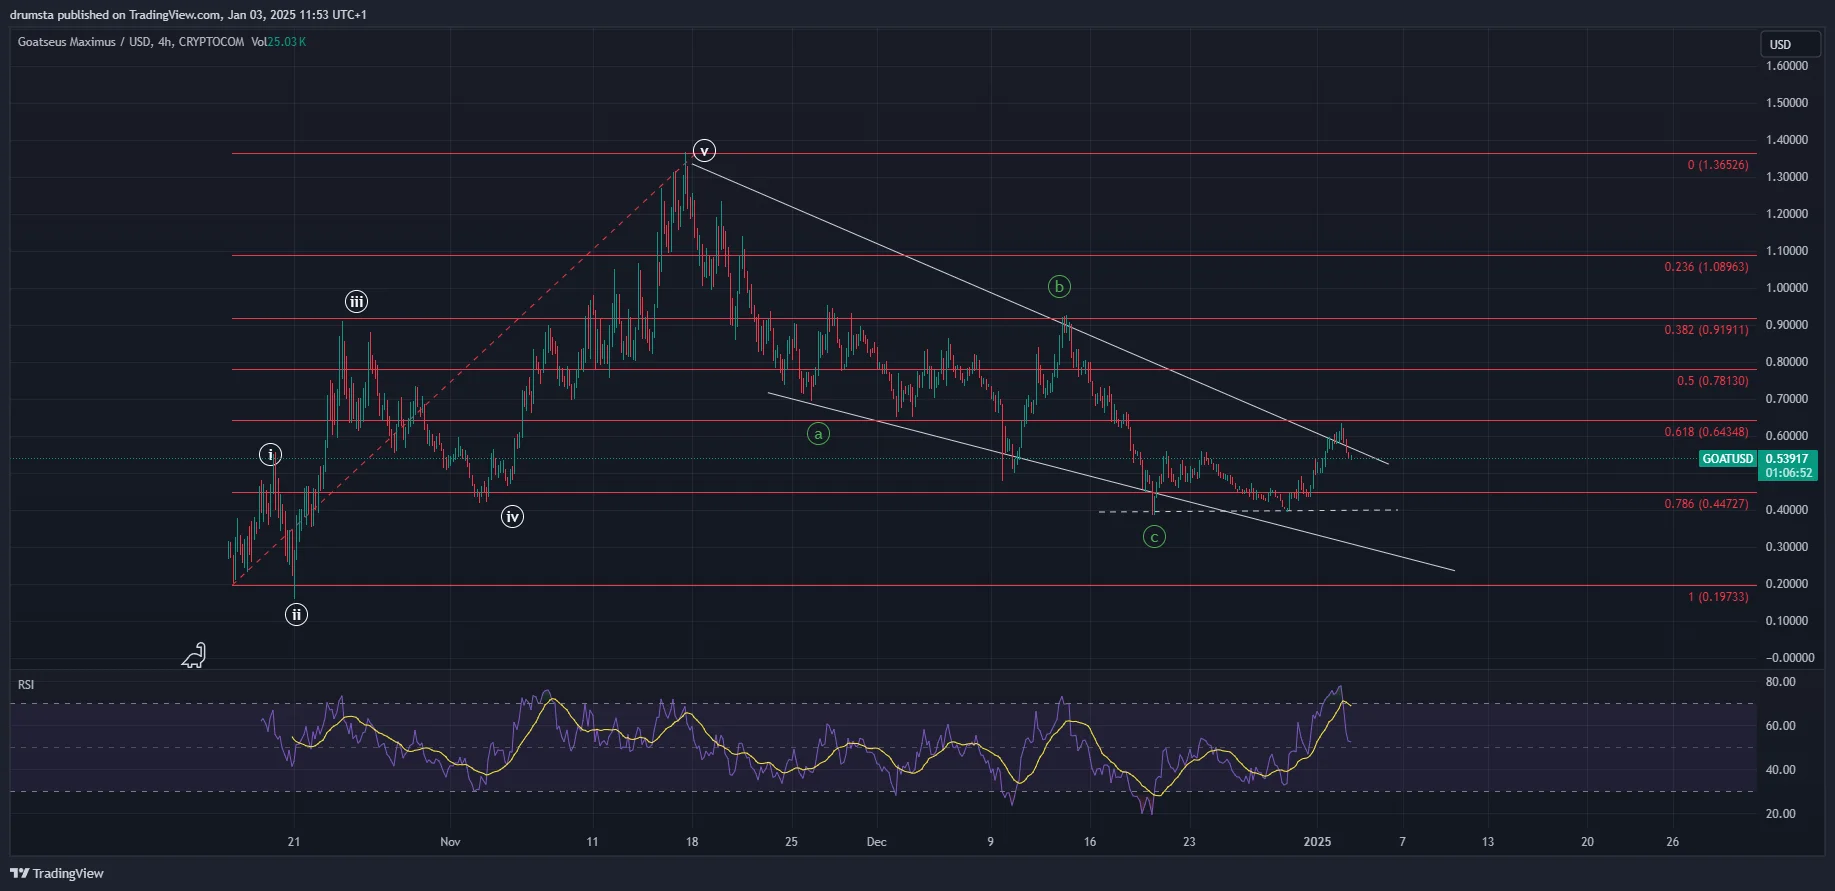
The 4-hour chart shows GOAT completing a five-wave Elliott Wave pattern and reaching an all-time high at $1.38, on Nov. 17, 2024. Right after the price peaked, an impulsive downward trend began, as an ABC correction formed a descending channel.
GOATUSD price breakout attempt failed | Credit: Nikola Lazic/TradingView
The first price spike occurred on Dec. 10, 2024, on wave B, when the price rose from $0.5 to $0.92, or around 85%. The price then went down, completing wave C on Dec. 20 at $0.39.
Following the ABC correction, the price broke out of a descending channel pattern and rose to $0.63, with The Relative Strength Index (RSI) showing overbought conditions.
This breakout indicated potential bullish momentum. However, the price found resistance at the descending trendline and 0.618 Fibonacci retracement, resulting in a pullback. The Relative Strength Index (RSI) showed overbought conditions and dropped to around 50%.
The RSI indicator suggests rising momentum but is nearing oversold territory, signaling caution for buyers. A confirmed breakout above the 0.618 Fibonacci level would likely drive the price higher toward the next resistance, while rejection here could see a retest of lower levels near 0.5 or 0.382 Fibonacci levels.
GOAT Price Prediction
The 1-hour chart illustrates two likely outcomes. As the price of GOAT has been rejected and is currently declining, we will receive a confirmation of either outlook. In the first scenario, the consolidation followed by the recent rise is the starting of a new bull phase.
GOATUSD two likely outcomes | Credit: Nikola Lazic/TradingView
If this is true, the price should establish a higher low, preferably above the 0.786 Fib at $0.44, and increase again, finally making a decisive breakout above the descending resistance.
But primarily, we expect the correction to be prolonged by two more waves—D and E—out of which the D wave was completed at its recent high. That means the E wave is now likely in development and could target values lower than $0.40 on Dec. 20.
The descending channel suggests bearish potential, if the price breaks below the local horizontal support of $0.40, which kept the price. RSI momentum shows a decline, suggesting weakening bullish strength, but it has not yet reached oversold territory.
Key Fibonacci retracement levels provide essential zones for potential reactions. The 0.618 ($0.643) and 0.5 ($0.781) levels are immediate resistance, while support levels lie near the 0.786 ($0.447) Fibonacci level and $0.20, marking critical lower bounds.
Invalidation Zone: Below $0.30, signaling further downside potential.
Disclaimer:
The information provided in this article is for informational purposes only. It is not intended to be, nor should it be construed as, financial advice. We do not make any warranties regarding the completeness, reliability, or accuracy of this information. All investments involve risk, and past performance does not guarantee future results. We recommend consulting a financial advisor before making any investment decisions.
Nikola Lazic is a cryptocurrency analyst and investor working in the industry since 2017. He holds a bachelor's degree in Sociology, which enables him to better understand the psychology behind the crowd´s positioning. Consequently his preferred analytical tool is Elliott Wave Theory in combination with price action analysis.
Combining his experience in trading and investing with knowledge in content writing he strives to bring the most accurate and actionable information.