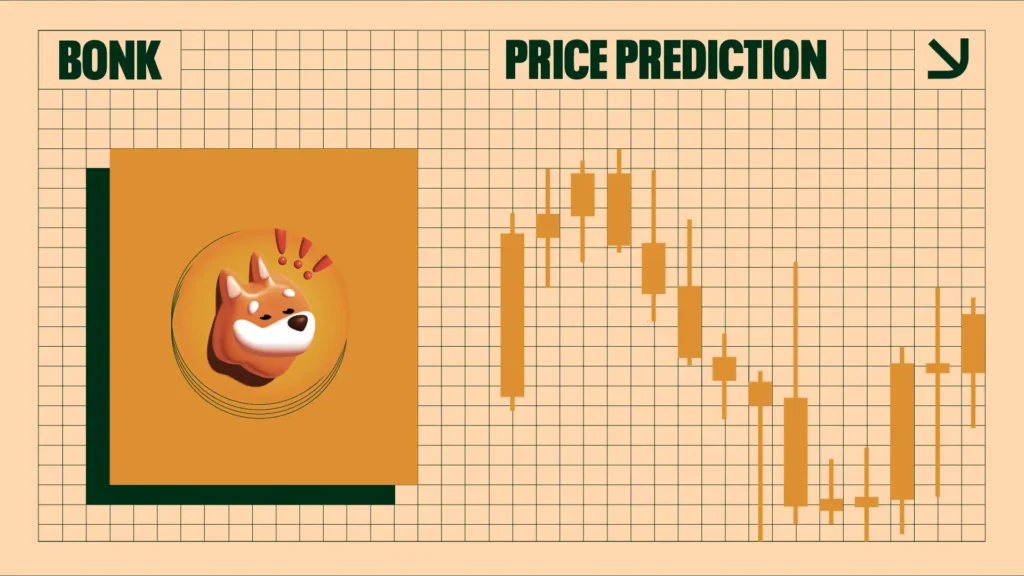
BONK rises 30% since recent low but now encountered descending resistance. Can it make a breakout?
Share
Key Takeaways
BONK saw a 400% rally followed by a 75% drop.
A descending triangle suggests a possible bullish breakout.
Key resistance levels at $0.000026 and $0.000033.
The BONK price has experienced significant price swings in 2024, ranging from massive gains to sharp corrections.
After consolidating for several months, the token shows signs of a potential bullish breakout. It started gaining traction on Oct. 10 but is now at its most significant descending resistance, dating from March.
A breakout above would be considered highly significant.
BONK Price Analysis
On March 5, 2024, the BONK price reached an all-time high of $0.00003771, marking a nearly 400% increase from its February low.
However, this rally was followed by a steep 75% drop, with the price declining to $0.000012 by April 13.
The price rebounded to $0.000044 on May 29 but fell again to $0.000020 by June 24. Another lower high of $0.000034 was reached on July 21, followed by a new low of $0.000015 on Aug. 5.
The price then entered a consolidation phase, retesting its August low on Sept. 6 and 18. A subsequent rally pushed the price to $0.000026 on Oct. 1.
However, the Relative Strength Index (RSI) signaled overbought conditions, hinting at a rejection near the descending channel resistance that began in March.
BONKUSD at descending resistance | Credit: Nikola Lazic/TradingView
Following this, BONK faced resistance, dropping to $0.000019 by Oct. 3 and retesting this level on 10 before breaking out to the upside.
However, after gaining 30%, it made a lower high of $0.000025 at the descending channel resistance.
BONK likely completed its WXY correction, with the rise since Sept. 6 signaling the start of a new bullish phase.
A breakout above the descending resistance would strongly confirm this uptrend.
BONK Price Prediction
A closer look at the hourly chart reveals a potential five-wave impulse pattern that began on Sept. 6, with the final wave completing on Oct. 1.
The failure to break past the $0.000026 resistance resulted in a pullback to the 0.618 Fibonacci retracement level.
While this retracement occurred sharply, it suggests the potential for a typical corrective phase.
Following the five-wave sequence, a three-wave retracement was expected, targeting the 0.618 Fibonacci level at $0.000019. The price found support at this level, hinting at the possibility of a new uptrend.
The descending flat triangle formed as the price held at the 0.618 Fib level during the latest decline, likely completing a three-wave correction. A breakout occurred, with two scenarios ahead.
BONKUSD breakout anticipated | Credit: Nikola Lazic/TradingView
Either BONK started a new uptrend after its recent low on Oct. 10. this new advancement could bring BONK to a higher high of $0.000033 or $0.000037, reaching some of the Fib extension levels.
Alternatively, its previous high was only wave three, making the current rise its final one in a five-wave sequence.
But even in that case, BONK should overcome its current descending resistance and surpass its prior high of $0.000026.
Disclaimer:
The information provided in this article is for informational purposes only. It is not intended to be, nor should it be construed as, financial advice. We do not make any warranties regarding the completeness, reliability, or accuracy of this information. All investments involve risk, and past performance does not guarantee future results. We recommend consulting a financial advisor before making any investment decisions.
Nikola Lazic is a cryptocurrency analyst and investor working in the industry since 2017. He holds a bachelor's degree in Sociology, which enables him to better understand the psychology behind the crowd´s positioning. Consequently his preferred analytical tool is Elliott Wave Theory in combination with price action analysis.
Combining his experience in trading and investing with knowledge in content writing he strives to bring the most accurate and actionable information.