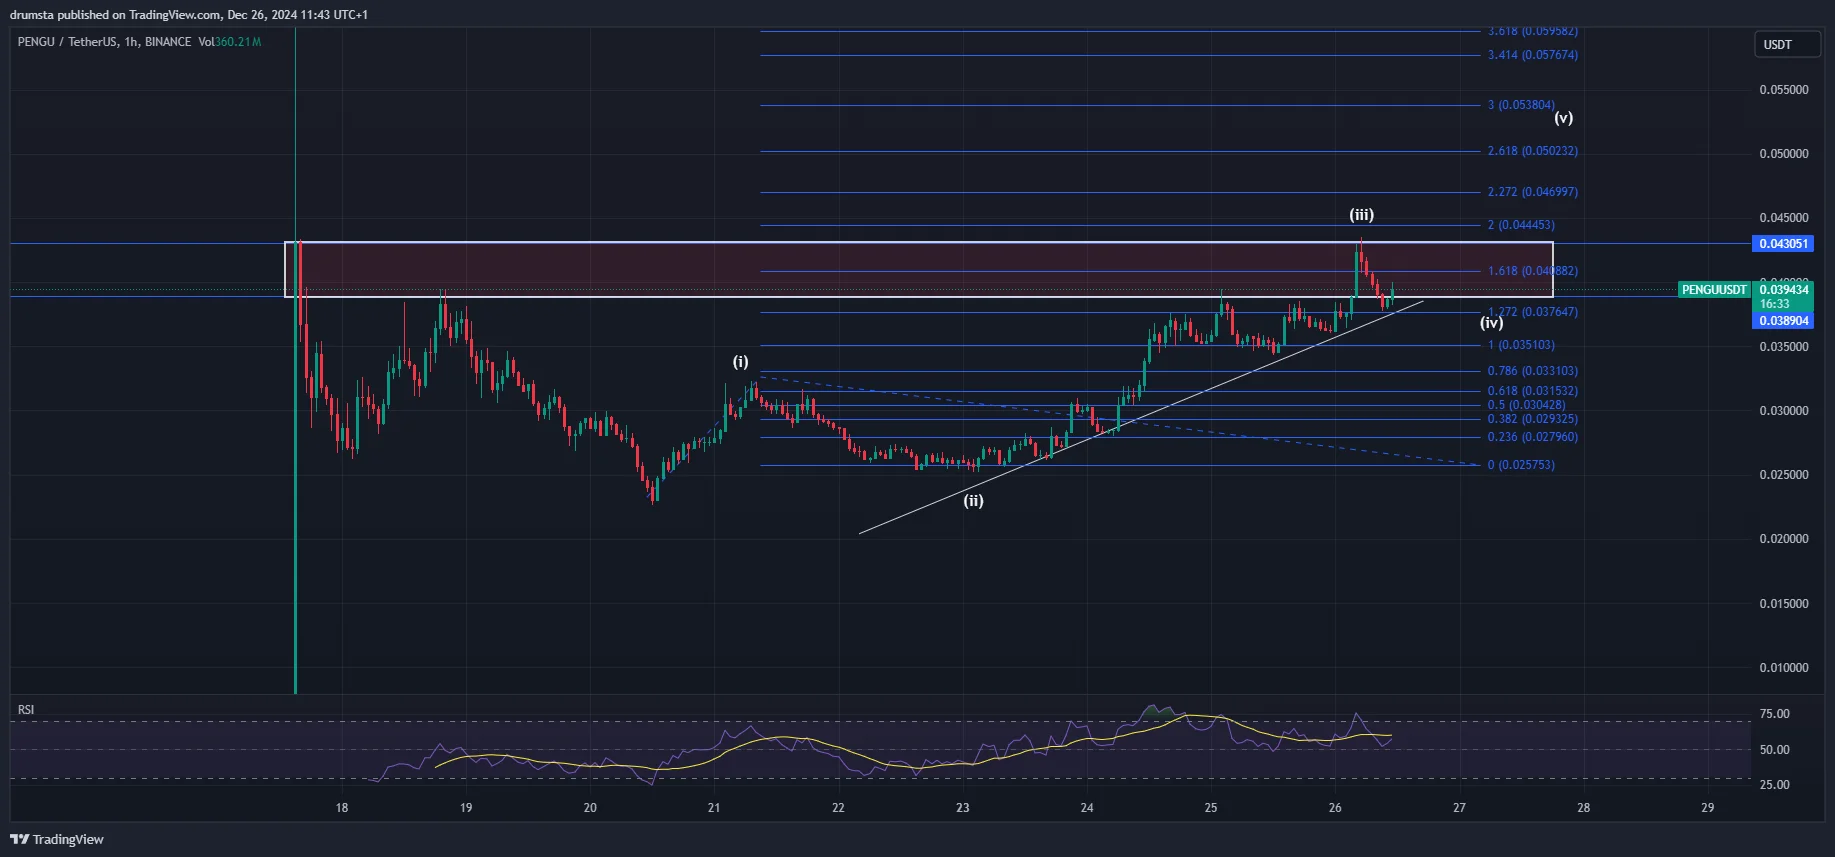
The 1-hour PENGU chart highlights a breakout from Wave ii into Wave iii, which crossed the 1.618 Fibonacci extension and retested the upper boundary of the horizontal resistance zone at $0.043.
The price then retraced slightly, consolidating near the ascending trendline support to a low of $0.37. A clear rejection occurred at a resistance zone around $0.043, signaling the potential for further consolidation before continuation.
PENGUUSD rejection at horizontal resistance zone | Credit: Nikola Lazic/TradingView
Wave iv holds above key support levels, particularly at the 1.272 Fibonacci extension of $0.0376 and the ascending trendline.
A breakout above the resistance zone could propel Wave v toward higher extensions, with targets at $0.0503 (2.618 extension) and $0.0538 (3.618 extension). Failure to hold the trendline could trigger a deeper pullback toward the $0.035 area.
Hourly Relative Strength Index (RSI) has cooled off from overbought levels after Wave iii, indicating reduced bullish momentum but still supportive of potential upside. The ascending structure remains intact, with the price poised to either break the resistance or consolidate further.
Key Observations
PENGU broke out from Wave ii into Wave iii, reaching $0.048.
Rejection occurred at a resistance zone at $0.043.
Wave iv is holding above the ascending trendline and $0.0376 support.
PENGU Price Prediction
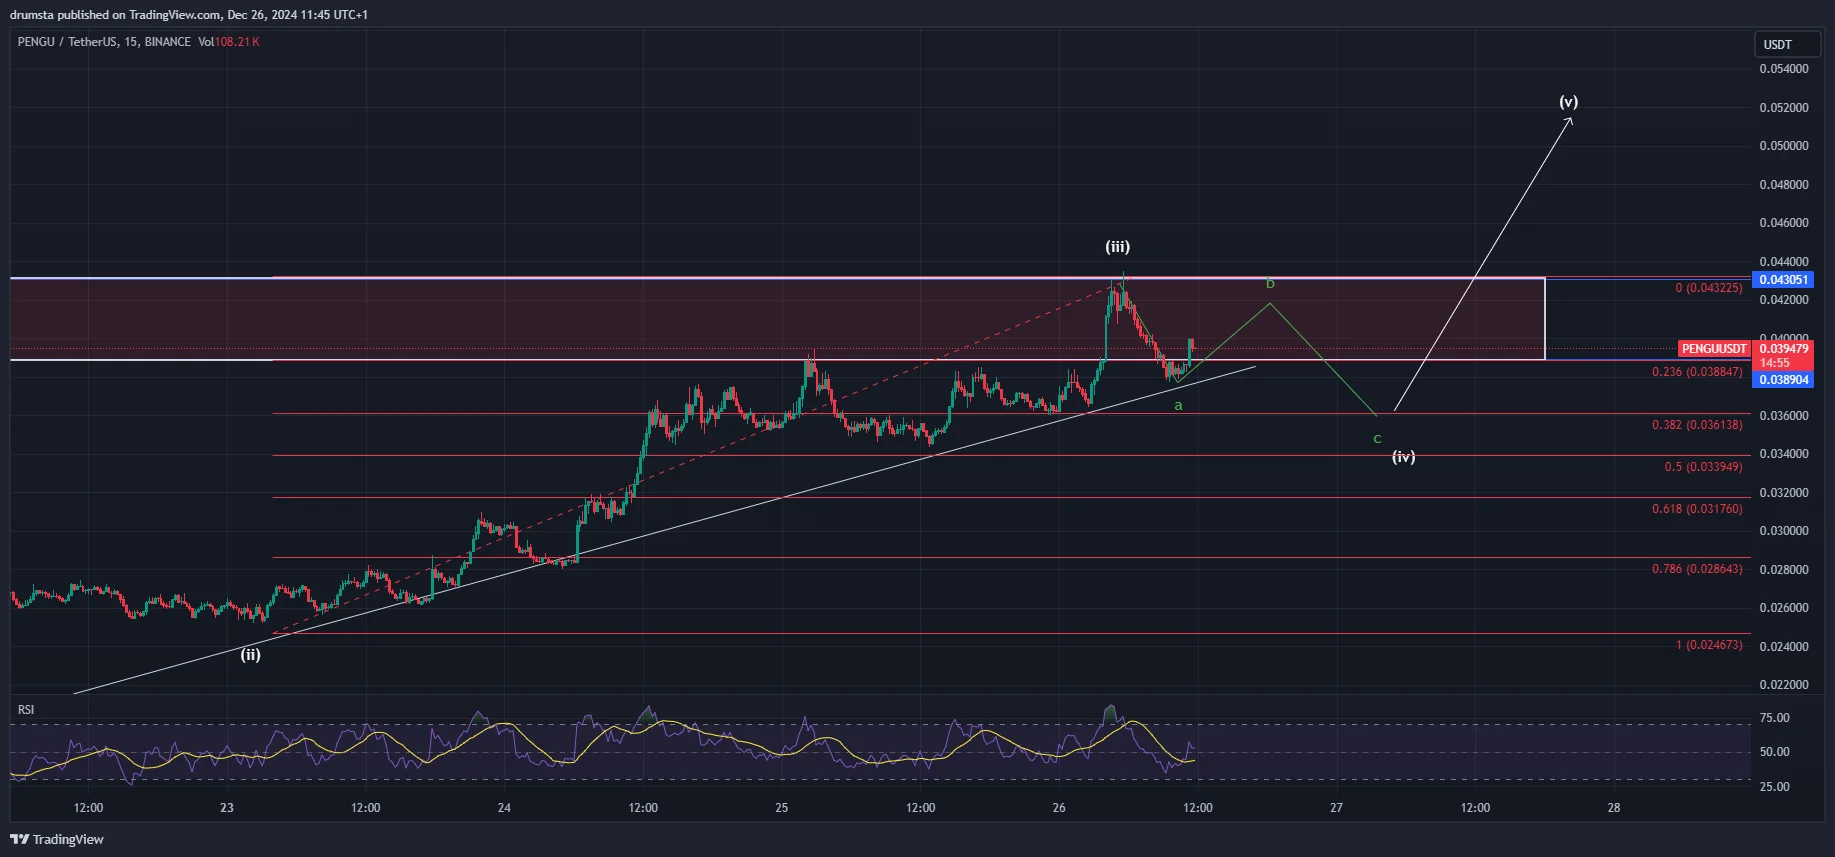
The 15-minute chart illustrates that the price is now entering a consolidation in corrective Wave (iv) following a strong Wave (iii) rally.
The price briefly tested a resistance zone near $0.043 before returning to $0.0388 (0.236 Fibonacci retracement). The ascending trendline from Wave (ii) continues to provide support, while the RSI shows neutral momentum after retracing from overbought conditions.
PENGUUSD consolidation likely before a breakout | Credit: Nikola Lazic/TradingView
Wave (iv) forms a potential ABC corrective structure, with current resistance at $0.043 and support at $0.0388.
Further consolidation is expected before a breakout into Wave (v). Wave (v) projections point to targets at $0.0503 (2.618 extensions) and $0.0538 (3.618 extensions), while failure to hold $0.0361 (0.382 retracements) could invalidate the bullish structure.
The RSI indicates room for further upward movement as it approaches mid-levels.
A breakout above $0.043 would confirm the start of Wave (v), targeting higher Fibonacci extensions. However, continued consolidation between $0.0361 and $0.043 is likely in the short term.
Key Levels to Watch
Immediate support: $0.0388 (0.236 Fibonacci retracement) and $0.0361 (0.382 retracement).
Immediate resistance: $0.043 (resistance zone from Wave (iii) top).
Major resistance: $0.0503 (2.618 Fibonacci extension) and $0.0538 (3.618 extension).
Disclaimer:
The information provided in this article is for informational purposes only. It is not intended to be, nor should it be construed as, financial advice. We do not make any warranties regarding the completeness, reliability, or accuracy of this information. All investments involve risk, and past performance does not guarantee future results. We recommend consulting a financial advisor before making any investment decisions.
Nikola Lazic is a cryptocurrency analyst and investor working in the industry since 2017. He holds a bachelor's degree in Sociology, which enables him to better understand the psychology behind the crowd´s positioning. Consequently his preferred analytical tool is Elliott Wave Theory in combination with price action analysis.
Combining his experience in trading and investing with knowledge in content writing he strives to bring the most accurate and actionable information.