ETH reached $4,000 and made a slight pullback as it encountered resistance. Overbought conditions could be hinting at the coming correction.
Share
Key Takeaways
ETH is advancing in the final wave (v) phase.
Signs of rejection are seen at $4,000 resistance.
Overbought signs hint at a potential corrective pullback.
Ethereum (ETH) is currently experiencing a minor pullback after reaching the $4,000 area. The price action unfolds within a classic Elliott Wave structure, signaling its ending wave’s potential completion and a corrective pullback’s potential onset.
Key support and resistance levels are in focus as ETH navigates through overbought conditions.
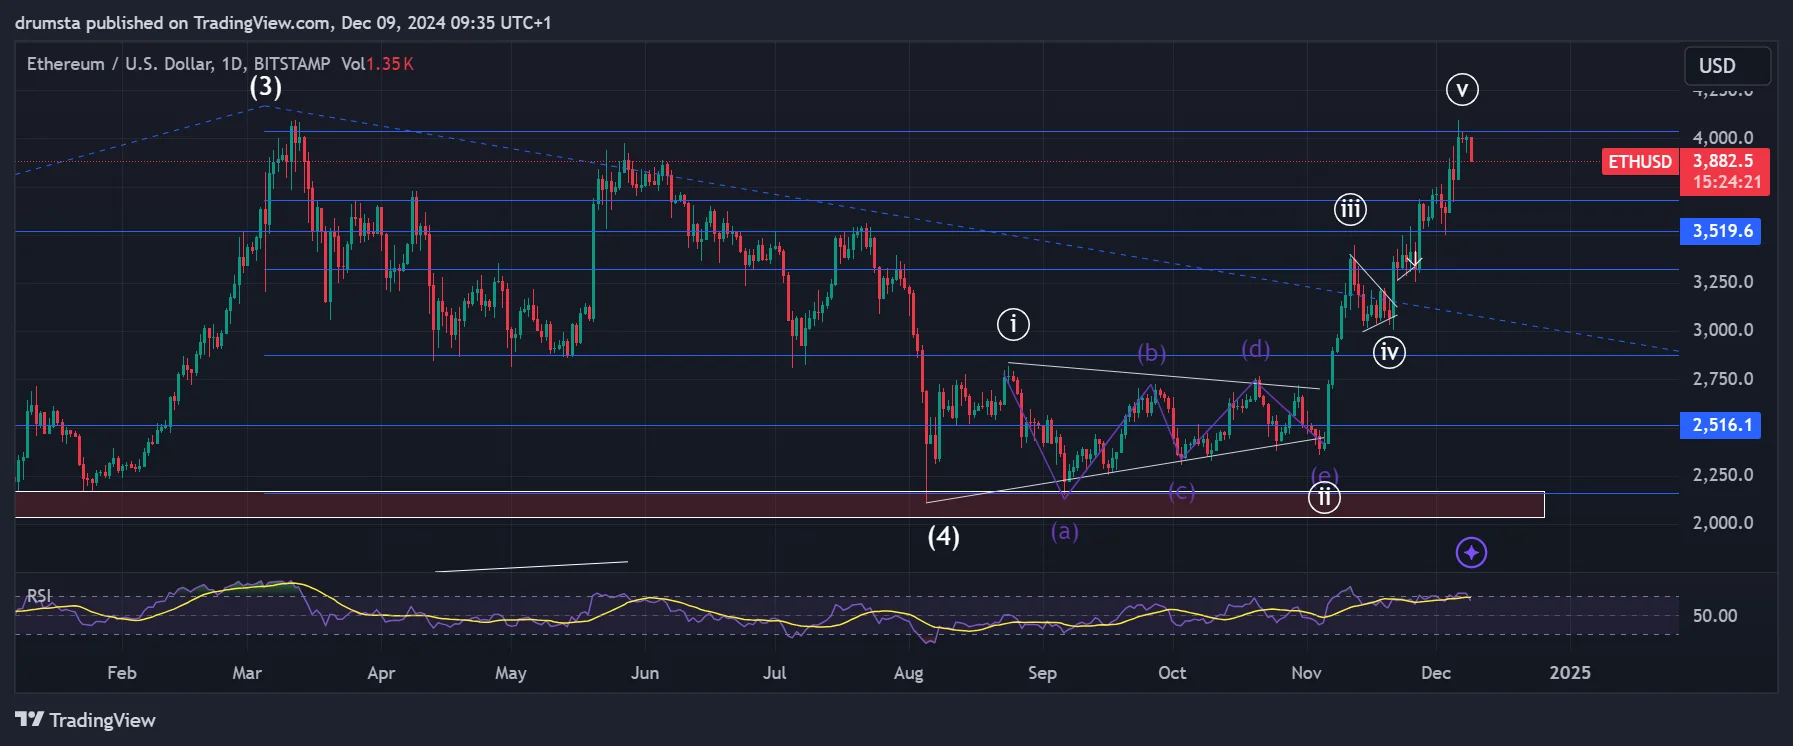
The Ethereum (ETH) daily chart highlights a strong bullish continuation after breaking out of a prolonged corrective phase. Following wave (ii) completion as a triangle correction, ETH has embarked on an impulsive five-wave structure extending into wave (v).
ETHUSD signs of resistance at $4,000 | Credit: Nikola Lazic/TradingView
ETH is currently trading near $3,900, as it was rejected at the prior macro high and the psychological resistance level of $4,000, which is likely a significant hurdle.
While the broader trend remains firmly bullish, the Relative Strength Index (RSI) signals overbought conditions, which could lead to a temporary consolidation or a corrective pullback before the uptrend resumes. This correction would allow the market to gather momentum for another leg higher, potentially targeting new highs above $4,000.
Key Observations
In a Wave (v): ETH is advancing within wave (v) of the Elliott Wave structure, with the potential of it being completed.
Key Support Levels: Immediate support lies at $3,519, which aligns with wave (iii)’s peak. If the uptrend falters, a deeper retracement could target $2,516.
RSI Overbought: The RSI is in overbought territory, suggesting a potential consolidation or correction phase may be on the horizon.
ETH’s strong uptrend reflects growing market confidence, but elevated RSI levels warn of a possible short-term pause or pullback. A breakout above $4,000 would confirm continued bullish momentum.
While failure to hold support at $3,519 could lead to deeper corrections.
ETH Price Prediction
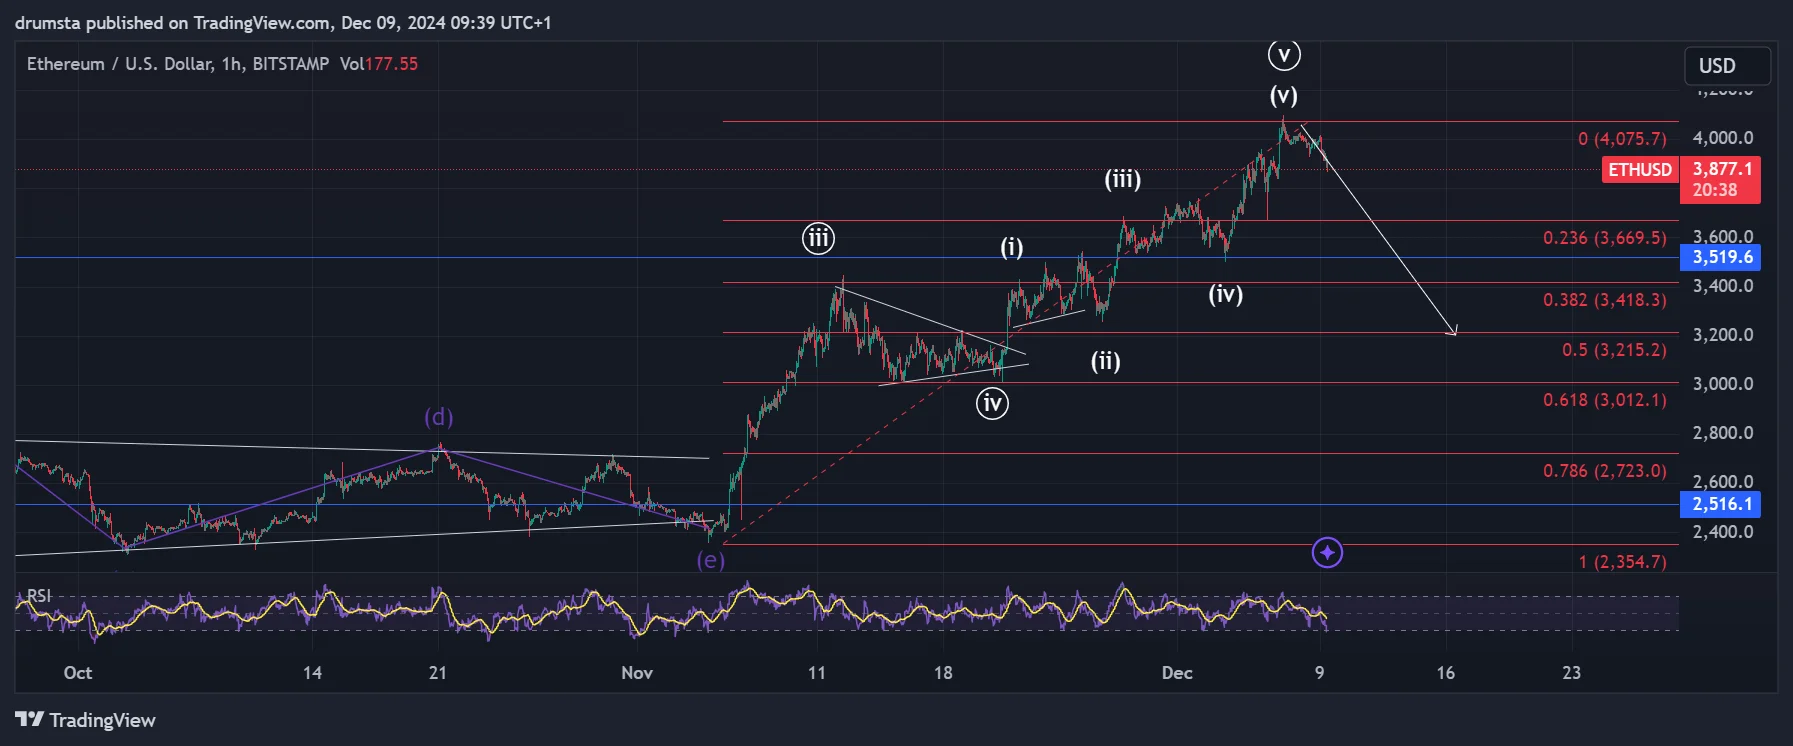
The hourly chart showcases a textbook impulsive wave structure, with the price reaching the final leg of wave (v) around $4,080.
This marks the culmination of a strong rally that followed the breakout from the triangle pattern in early November.
ETHUSD uptrend may have ended | Credit: Nikola Lazic/TradingView
Currently, ETH is retracing from its recent high, indicating that wave (v) may have concluded, and a corrective ABC structure could be underway.
The price action highlights a potential pullback to key Fibonacci retracement levels. Immediate support lies at $3,669 (0.236 Fib), while a deeper correction could extend toward $3,418 (0.382 Fib) or $3,215 (0.5 Fib). RSI shows a decline from overbought territory, signaling a short-term cooling phase, although the broader trend remains bullish.
If the price finds support at these levels, ETH could resume its uptrend with a new attempt at breaking the $4,075 resistance.
Key Levels to Watch
Support Levels
$3,669 (0.236 Fib): Immediate support to watch during the initial pullback.
$3,418 (0.382 Fib): Critical mid-level support aligned with prior consolidation.
$3,215 (0.5 Fib): A deeper retracement target, marking the likely end of wave A.
$3,012 (0.618 Fib): Key structural support in case of an extended correction.
Resistance Levels
$4,075: Major resistance and the peak of the current rally.
If the uptrend resumes, $4,200+ would be the next target zone.
Ethereum’s price action suggests the rally might pause as corrective patterns emerge. Holding above $3,418 would keep the bullish structure intact, signaling the potential for a bounce toward $4,075 or higher.
However, failure to hold key support levels could lead to deeper consolidation, with $3,012 providing a solid base for another bullish attempt. The broader trend remains positive, and any correction will likely set the stage for renewed upside momentum.
Disclaimer:
The information provided in this article is for informational purposes only. It is not intended to be, nor should it be construed as, financial advice. We do not make any warranties regarding the completeness, reliability, or accuracy of this information. All investments involve risk, and past performance does not guarantee future results. We recommend consulting a financial advisor before making any investment decisions.
Nikola Lazic is a cryptocurrency analyst and investor working in the industry since 2017. He holds a bachelor's degree in Sociology, which enables him to better understand the psychology behind the crowd´s positioning. Consequently his preferred analytical tool is Elliott Wave Theory in combination with price action analysis.
Combining his experience in trading and investing with knowledge in content writing he strives to bring the most accurate and actionable information.