Contrary to the signs shown on Jan. 1, AAVE has failed to build on its previous bullish momentum.
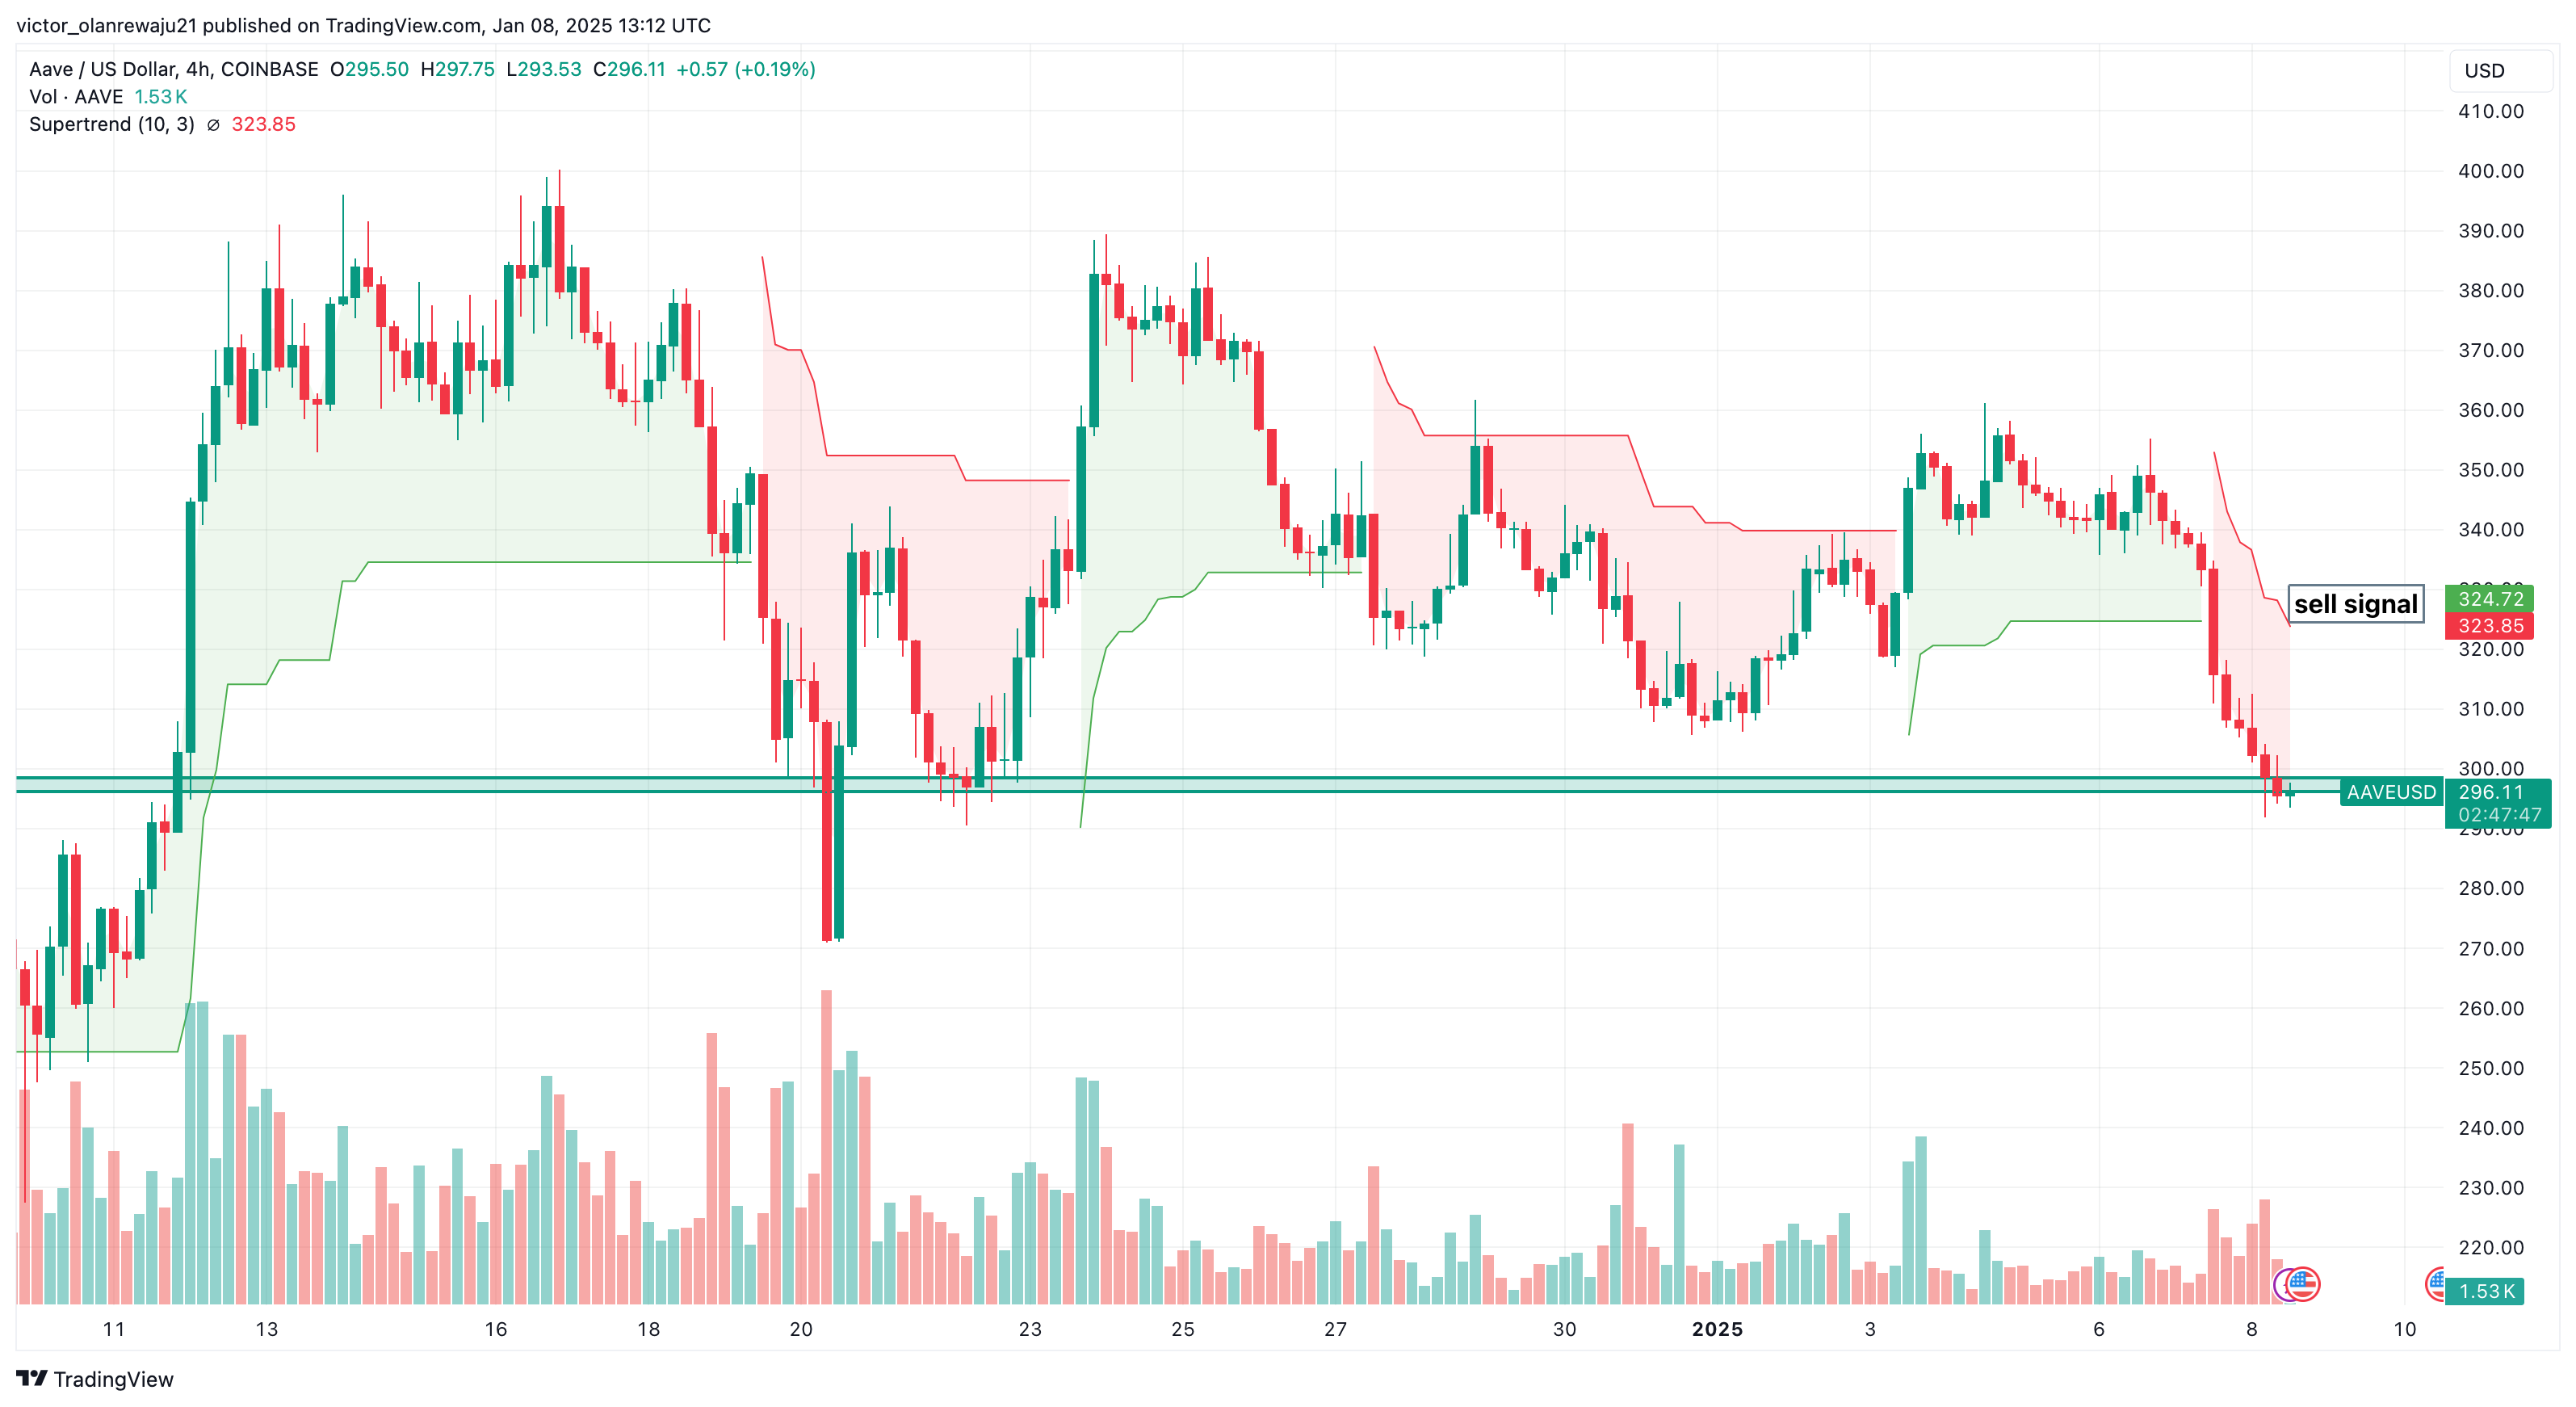
Indicators, like the Supertrend, climbed above the price, signaling resistance around the DeFi token.
Due to this bearish momentum, AAVE price might struggle to retest $300 or higher in the near term
AAVE, the governance token of the decentralized finance (DeFi) lending platform, has dropped below $300. This is the first time the cryptocurrency has declined below the region since Dec. 12, 2024.
A thorough assessment of AAVE’s price action shows that the recent decline represents an 11.25% decrease, in the last 24 hours. For some, this double-digit decline may present a “buy the dip” opportunity. However, this analysis reveals that this might not be the case.
AAVE price started trading around $340 on Monday, Jan. 6. This was after the price jumped from $319 on New Year’s Day.
Despite last week’s upswing, the recent correction ensured that the altcoin’s value has dropped below the crucial support at $307. Dropping below this region suggests the AAVE risks an extended price decrease.
Apart from this, the red segment of the Supertrend indicator on the 4-hour has risen above AAVE’s price. The Supertrend indicator evaluates whether an asset is in an uptrend or downtrend. It does so by evaluating the price movement trends over specific timeframes.
When the green part of the indicator is below the price, it is a buy signal. On the other hand, if the red part of the Supertrend is above the price, it means the value might keep falling, which is the case with AAVE.
AAVE/USD 4-Hour Chart. Source: TradingView
If sustained, AAVE’s price could fall to $271 as it did in December.
AAVE Price Prediction: Token Target $230
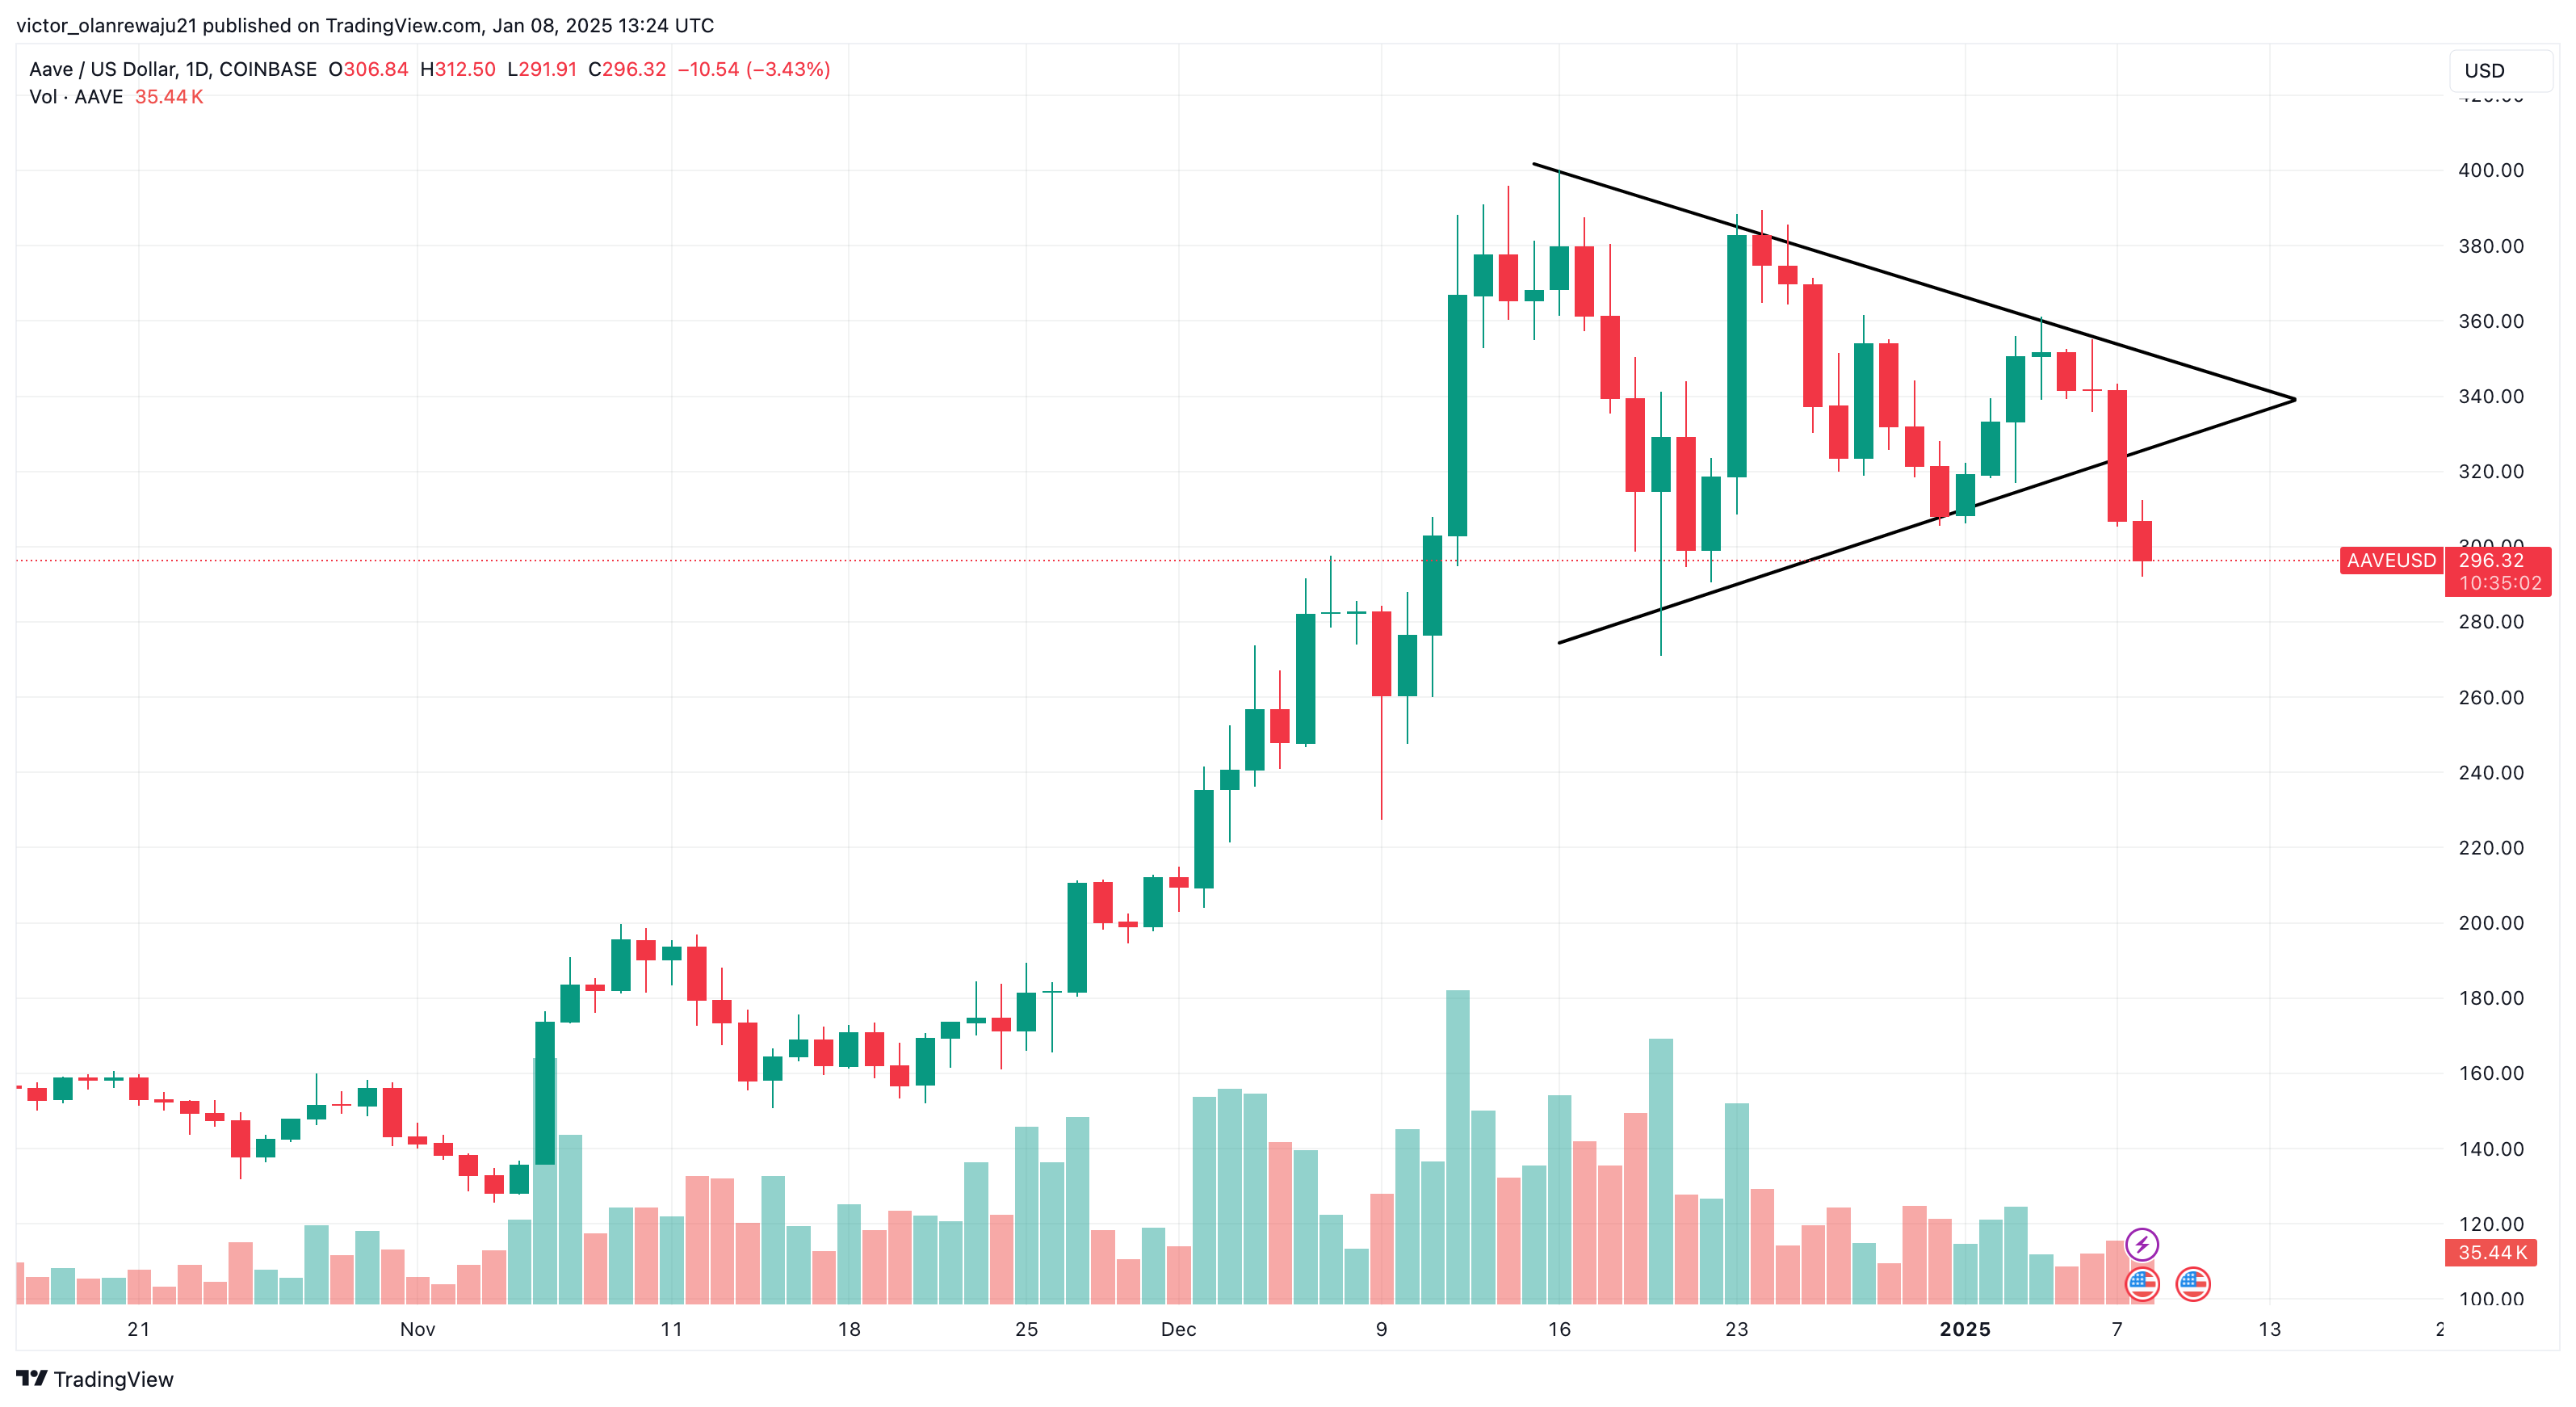
Evaluating the daily chart, it was observed that the token traded within a symmetrical triangle between Dec. 16 and Tuesday, Jan. 7.
The symmetrical triangle chart pattern represents a consolidation phase where the price compresses between converging trendlines.
Typically, a breakdown below the lower trendline indicates the start of a bearish trend. However, if the price breaks out above the upper trendline, it indicates the beginning of a bullish trend.
In AAVE’s case, it is the latter, as this has caused invalidation of the lower highs.
AAVE Daily Chart | Credit: Source: TradingView
Further assessment of the daily chart shows that Moving Average Convergence Divergence has dropped to the negative region.
The MACD is a powerful indicator, used to identify changes in trends and measuring momentum. If the MACD’s reading is negative, momentum is bearish.
A positive reading, on the other hand, indicates bullish momentum. Therefore, the reading as of this writing, implies that AAVE’s momentum is bearish.
Should this trend remain the same, AAVE’s price might drop to $230.41. However, in a highly bearish situation, the altcoin’s value could drop below $200.
AAVE Daily Chart | Credit: TradingView
Still, if bulls can defend the price from falling below the 0.618 Fibonacci level, the trend might reverse. In that case, AAVE could reclaim $340.97.
Disclaimer:
The information provided in this article is for informational purposes only. It is not intended to be, nor should it be construed as, financial advice. We do not make any warranties regarding the completeness, reliability, or accuracy of this information. All investments involve risk, and past performance does not guarantee future results. We recommend consulting a financial advisor before making any investment decisions.
Victor Olanrewaju is a crypto analyst and reporter at CCN with deep roots in on-chain research and technical analysis. His crypto journey began in 2017, but it was the 2020 Uniswap airdrop that sparked a full-time pivot into the space.
With a foundation in copywriting, Victor honed his craft creating high-converting content for leading crypto brokers — most notably an XRP price prediction that ranked #1 on Google during the 2021 bull run.
He later joined AMBCrypto in 2022, where he combined storytelling with technical and on-chain analysis to cover key market narratives.
In 2024, he expanded his expertise at BeInCrypto, collaborating with analysts and using tools like Glassnode, Santiment, and IntoTheBlock to break down Bitcoin and altcoin trends.
At CCN, Victor covers the top cryptocurrencies, memecoins, macro shifts, blending real-time insights with deep-dive metrics.
He holds a Bachelor’s degree in Physics from the University of Ibadan, equipping him to simplify complex data for a wide audience. Follow his work or connect on LinkedIn or X.