AAVE Increases After Trump Market Activity | Credit: Hameem Sarwar
Share
Key Takeaways
The AAVE price reached a new yearly high of $359.79 on Dec. 12.
Donald Trump’s World Liberty has purchased $1 million worth of AAVE.
What’s the next target if AAVE continues to increase at this rate?
The AAVE price increased by 50% in November. While that was a substantial gain, it has already surpassed that with a 66% price increase in December.
The AAVE price accelerated its upward movement today, on Dec. 20, after Donald Trump reportedly bought $1 million worth of AAVE at $297.8. AAVE has surged nearly 20% since the purchase.
How long will AAVE continue increasing, and what are the next targets for this movement? Let’s take a deeper look and determine where AAVE will go next.
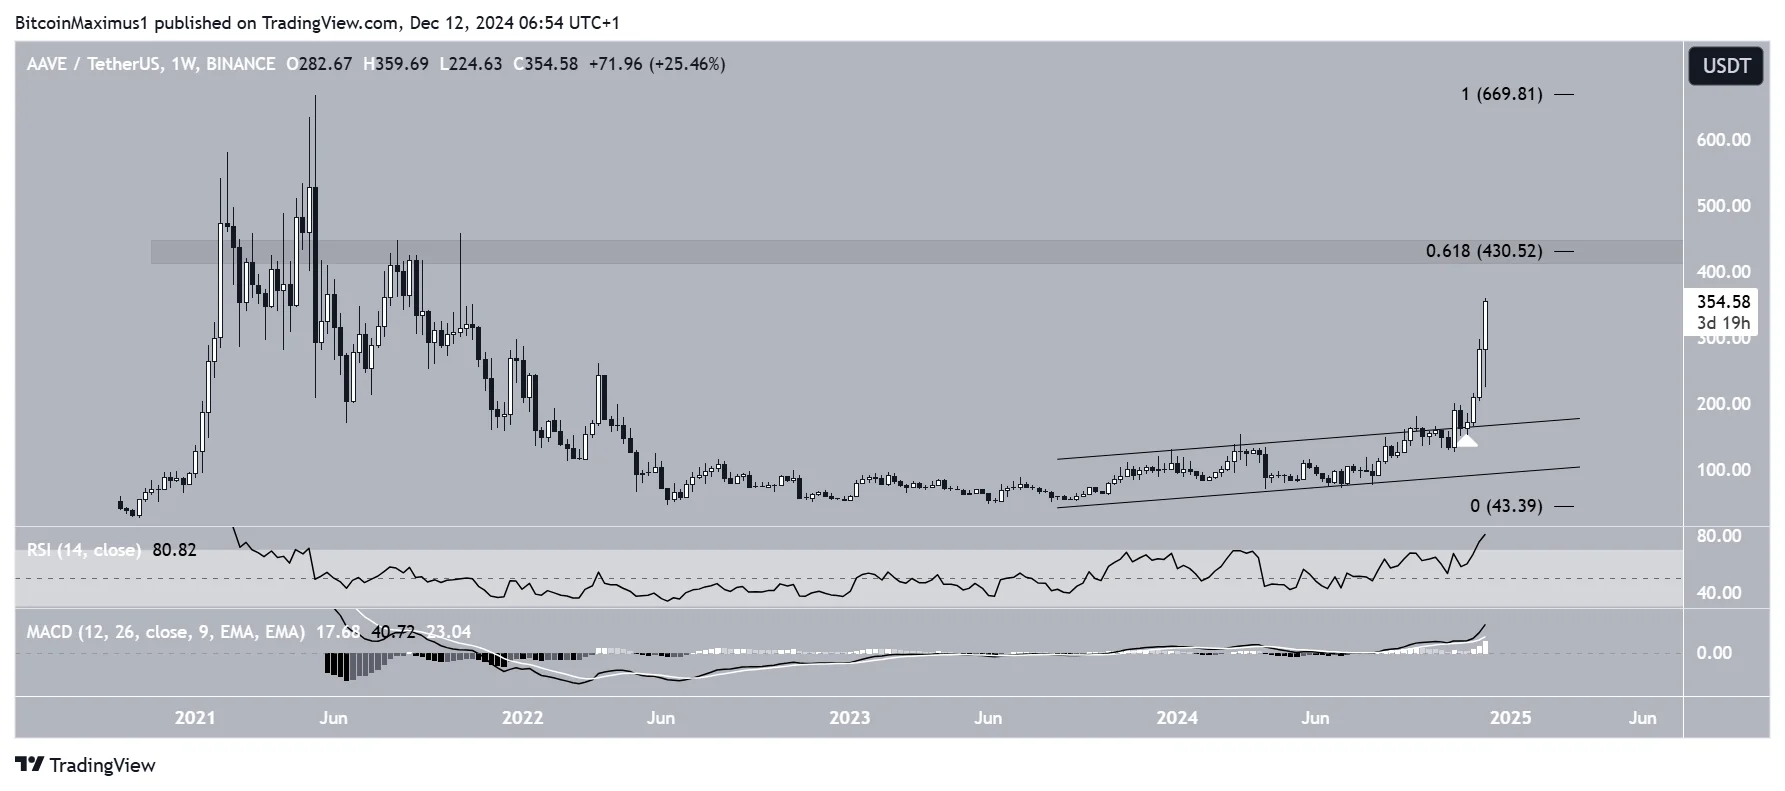
The weekly time frame chart shows that AAVE has increased parabolically since the start of November. It is currently creating the fourth successive bullish weekly candlestick, the largest of the four.
AAVE’s upward movement accelerated after the price broke out from an ascending parallel channel and validated it as support (white icon), a sign of impulsive movements. The price is rapidly approaching the main horizontal resistance area at $430.
This is a long-term horizontal resistance and the 0.618 Fibonacci retracement resistance when measuring the entire downward movement.
On top of the positive price action, technical indicators are bullish. The Relative Strength Index (RSI) and Moving Average Convergence/Divergence (MACD) are increasing and have crossed their bullish thresholds.
So, the weekly time frame readings suggest that AAVE will continue moving upward.
What Analysts are Saying
AAVE is trending in the news today since U.S. President Donald Trump’s World Liberty spent $1 million to purchase 3,357 AAVE for $297.8.
On-chain metrics are also booming: Arthur noted that the Ethereum lending Total Value Locked (TVL) has crossed $40 billion, and nearly 70% of that comes from AAVE. sUSDe growth on the protocol is also steady, noting a nearly 100% increase since last week, crossing $1.1 billion.
Finally, the team announced a co-incentive campaign with PYUSD, aiming to hasten the PYUSD adoption on Aave.
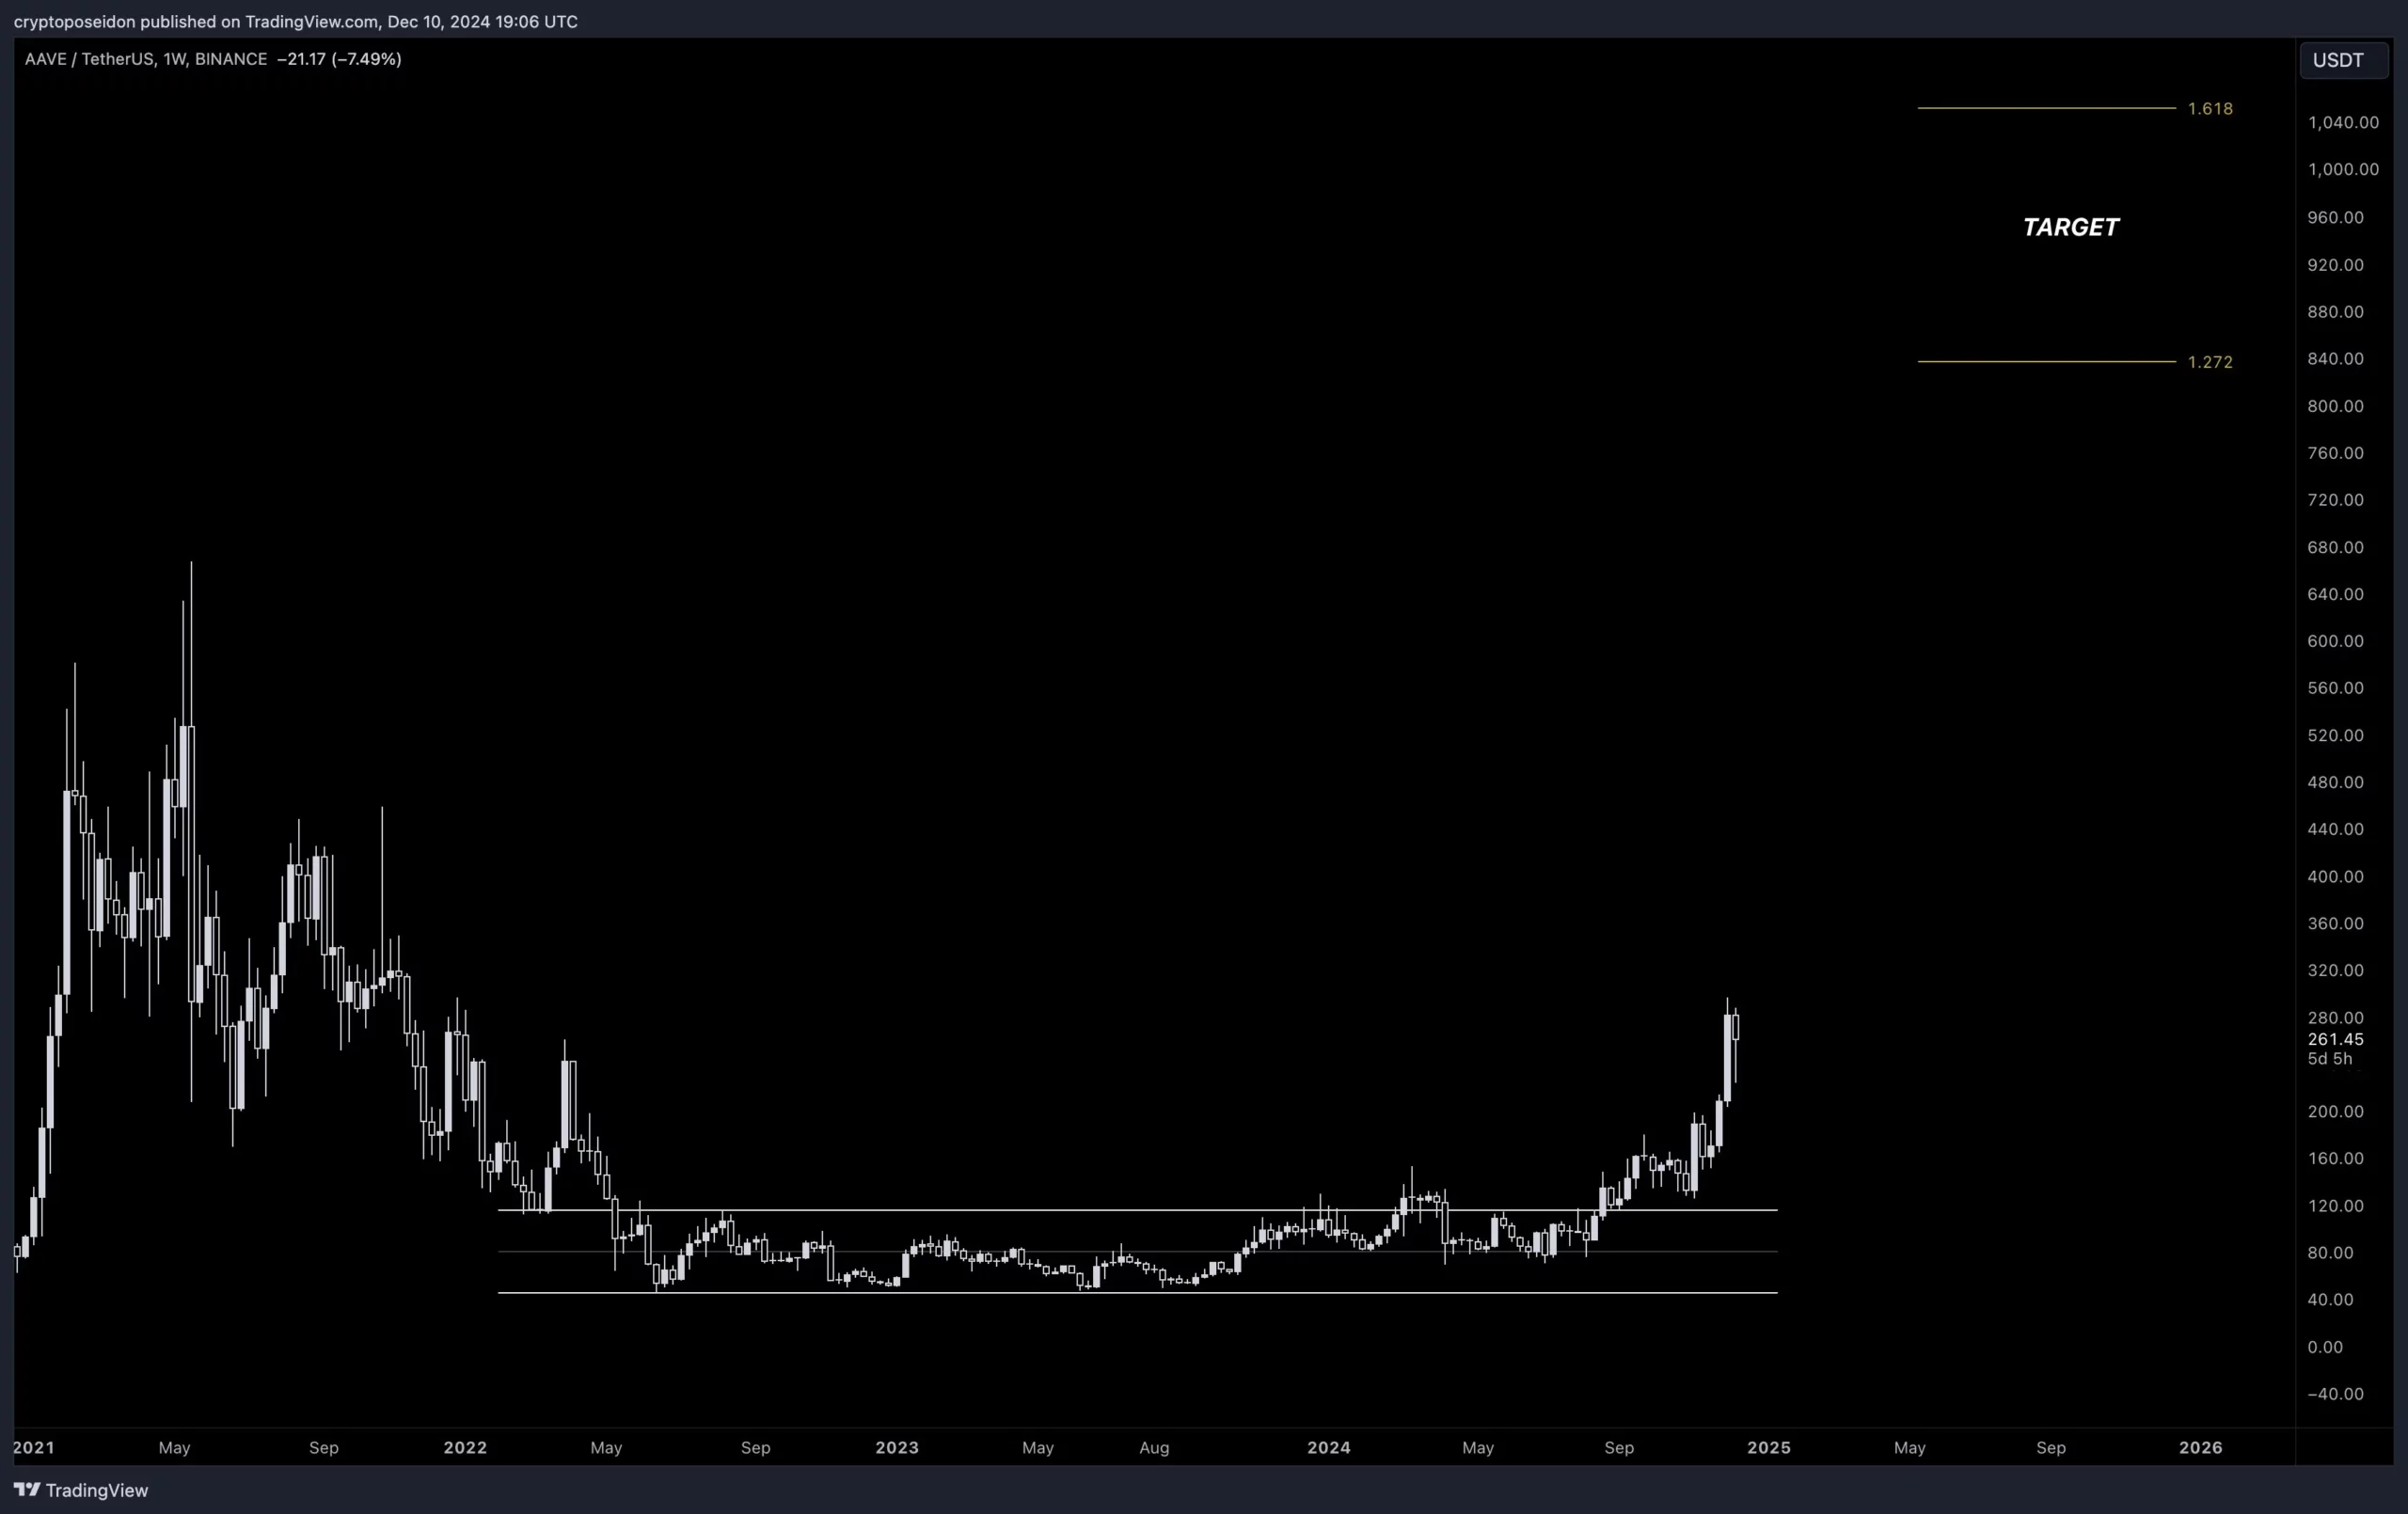
Technical analysts also have a bullish AAVE outlook. Poseidon targets $1,000 to reach the top of the current market cycle. The Dude is bullish because of the breakout from the long-term accumulation range.
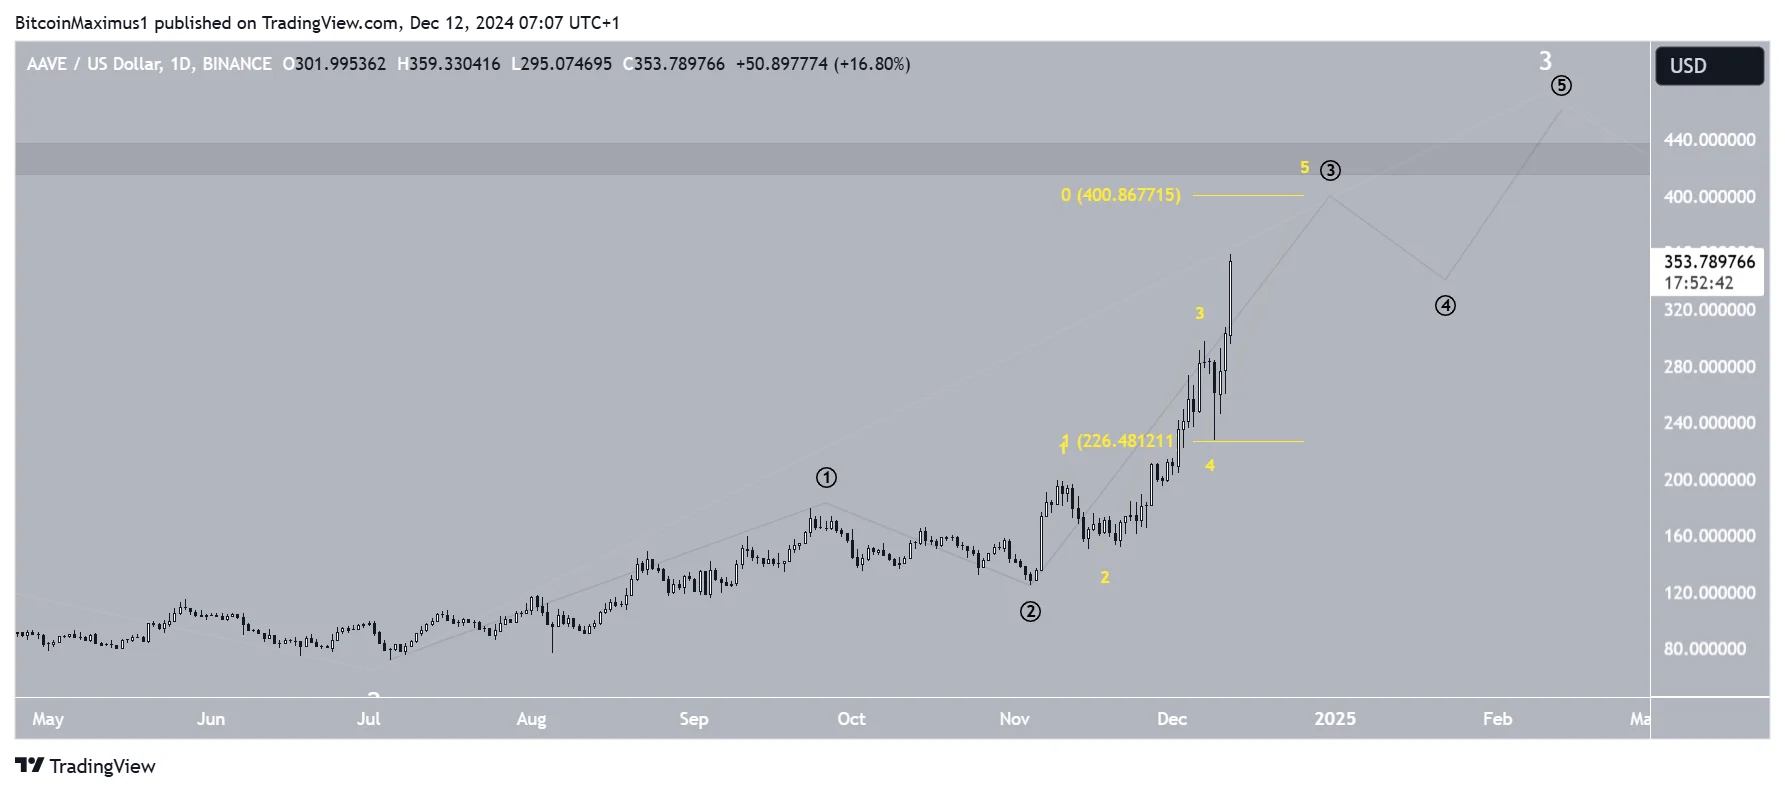
Considering that, let’s look at the wave count and determine where AAVE will head next.
Wave three already has 2.61 times the length of wave one, so the local top may be in. However, in case of an extension, wave three can hit 3.61 times the length of wave one and reach $456, approaching the long-term resistance at $430.
The sub-wave count extension (black) suggests this will be the case since another increase is needed to complete wave three. Afterward, wave five could take the AAVE price to a new all-time high.
So, the weekly time frame readings and wave count all suggest the AAVE trend is bullish, and new highs are likely.
Bullish Trend Ahead
The AAVE price performed admirably in November but accelerated its increase further in December, fueled by Trump’s AAVE purchases.
The wave count suggests that the price can increase until it reaches at least $456 before reaching a local top.
Disclaimer:
The information provided in this article is for informational purposes only. It is not intended to be, nor should it be construed as, financial advice. We do not make any warranties regarding the completeness, reliability, or accuracy of this information. All investments involve risk, and past performance does not guarantee future results. We recommend consulting a financial advisor before making any investment decisions.
Valdrin Tahiri is a cryptocurrency analyst and reporter at CCN, specializing in technical analysis with a focus on Elliott Wave theory, on-chain metrics, and fundamental research. He brings over seven years of experience in the crypto space as both a trader and writer.
He discovered cryptocurrencies in 2017 while earning his MSc in Financial Markets at the Barcelona School of Economics, which sparked a deep interest in blockchain and market dynamics. Since then, he’s contributed to top crypto outlets like BeInCrypto and CoinGape.
Valdrin also served as Community Manager of BeInCrypto’s Telegram group for three years, helping grow it into one of the largest crypto communities worldwide. His expertise in market structure and price patterns allows him to break down complex trends into clear, actionable insights.
He’s published thousands of articles covering altcoins, Bitcoin cycles, and macro trends.