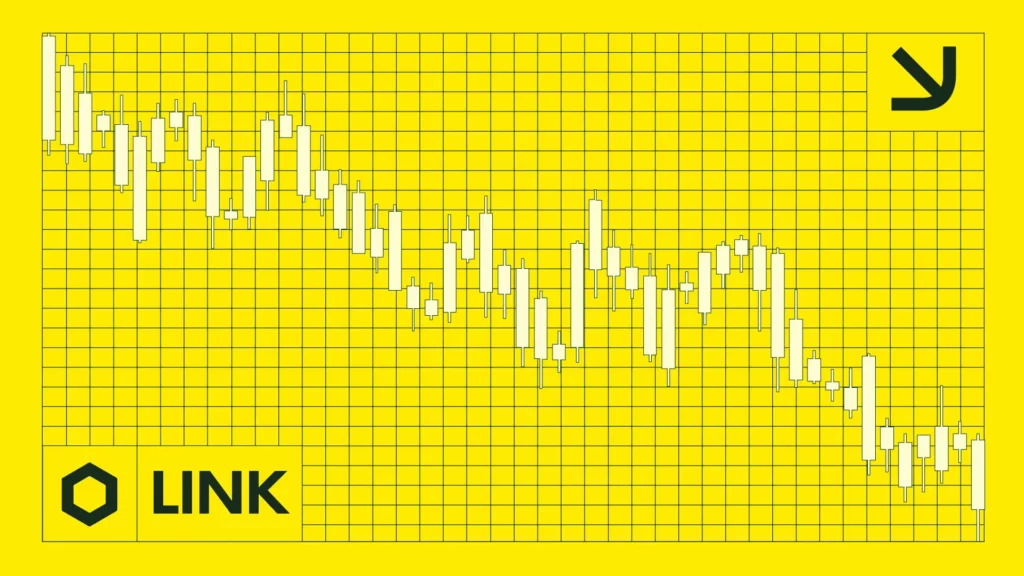
LINK falls around 40% over the weekend but shows signs of a recovery today. Will it make a reversal?
Share
Key Takeaways
LINK Falls nearly 40% over the weekend
RSI recovery signaling momentum shift
Elliott Wave structure forming impulsive waves
Chainlink (LINK) has recently shown notable price action, with significant developments across higher and lower time frames.
This analysis delves into current market dynamics and future price projections using Elliott Wave theory, Fibonacci retracement levels, and RSI momentum indicators.
On the 4-hour chart, Chainlink appears to have completed a corrective WXY pattern, culminating near the $18 mark, which aligns with the 0.618 Fibonacci retracement.
This region served as a strong support, prompting a sharp rebound. Although not as significant at this point, today’s low was an interaction with the descending triangle’s resistance, likely getting retested for support.
LINKUSD correction within descending triangle | Credit: Nikola Lazic/TradingView
The corrective phase unfolded within a descending triangle, a pattern typically indicating a bullish reversal. Previously in bearish territory, the Relative Strength Index (RSI) in the 4-hour time frame has started to recover, signaling a shift in momentum.
Despite the bullish breakout previously seen in mid-January, the momentum wained at a lower high of around $26, with the price of LINK entering a sideways trading range.
Historical price action suggests that LINK has respected Fibonacci levels, particularly the 0.5 ($20.45) and 0.382 ($22.89) retracements, marking them as critical resistance zones.
The wave count suggests the completion of wave Y, positioning the price for a potential new impulsive wave sequence.
The initial breakout above the descending trendline further supports the bullish case. Confirmation is needed through sustained volume and a decisive close above the $20.45 level.
LINK Price Prediction
The 1-hour chart offers a closer look at the developing impulsive wave structure. LINK has initiated wave (i) of a potential five-wave sequence that reached $19.5, followed by a corrective wave (ii), which appears to be finding support near the $18 region (0.618 Fib).
LINKUSD developing impulsive wave | Credit: Nikola Lazic/TradingView
Assuming the bullish scenario unfolds, wave (iii) could extend towards the $20.45 level, coinciding with the 0.5 Fibonacci retracement.
This wave typically exhibits the strongest momentum in an impulsive sequence. A brief consolidation for wave (iv) may occur before the final push in wave (v) targets the $22.89 region, aligning with the 0.382 Fibonacci retracement.
RSI readings show increasing bullish momentum, although a temporary pullback to reset overbought conditions is plausible. Failure to hold above $18 would invalidate the bullish wave count, potentially leading to a retest of the $16 zone.
Disclaimer:
The information provided in this article is for informational purposes only. It is not intended to be, nor should it be construed as, financial advice. We do not make any warranties regarding the completeness, reliability, or accuracy of this information. All investments involve risk, and past performance does not guarantee future results. We recommend consulting a financial advisor before making any investment decisions.
Nikola Lazic is a cryptocurrency analyst and investor working in the industry since 2017. He holds a bachelor's degree in Sociology, which enables him to better understand the psychology behind the crowd´s positioning. Consequently his preferred analytical tool is Elliott Wave Theory in combination with price action analysis.
Combining his experience in trading and investing with knowledge in content writing he strives to bring the most accurate and actionable information.