BRETT consolidates around $0.20 which is indicating indecision after a 17% decrease from the all-time high. One more push higher could be seen.
Share
Key Takeaways
The rally peaked at $0.23, which could be the end of the bull cycle
The price consolidates at nearly $0.20, signaling indecision
A breakout above $0.236 could lead to $0.25 and $0.267 targets.
BRETT has experienced a significant bullish breakout following a prolonged corrective phase, rallying to an all-time high of $0.23 on Dec. 1.
The current consolidation near $0.20 suggests a retracement within a larger Elliott Wave structure, leaving room for another push higher in wave (v) while maintaining the broader bullish trend.
The daily chart for Brett illustrates a sharp, bullish breakout following an extended corrective phase, marking the completion of a complex WXYXZ correction.
The recent impulsive rally pushed the price beyond critical resistance levels, peaking near $0.23 on Dec. 1, a new all-time high.
The daily candle closed below 2.618 Fibonacci extension at $0.21, which usually signals the exhaustion of wave 5 within a larger Elliott Wave structure and the completion of the cycle, particularly since the wick was around a 10% decline.
Since then, the decline has continued, but BRETT has been moving sideways in recent days around $0.20, which could mean that there will be one more push higher before the cycle ends.
The Relative Strength Index (RSI) shows overbought conditions, suggesting that the current rally might be nearing a temporary pause or retracement. However, the broader bullish structure remains intact, with potential wave (v) targets pointing to higher levels.
Key Observations
Wave (iii) Completion: The price has reached the 2.272 Fibonacci extension at $0.19, marking a likely end to wave (iii) of the current impulsive structure.
Correction Phase Possible: RSI indicates overbought territory, signaling the potential start of wave (iv) retracement.
Support Levels: Critical levels to watch include $0.159 (1.618 Fib) and $0.141 (1.272 Fib) for wave (iv).
BRETT Price Prediction
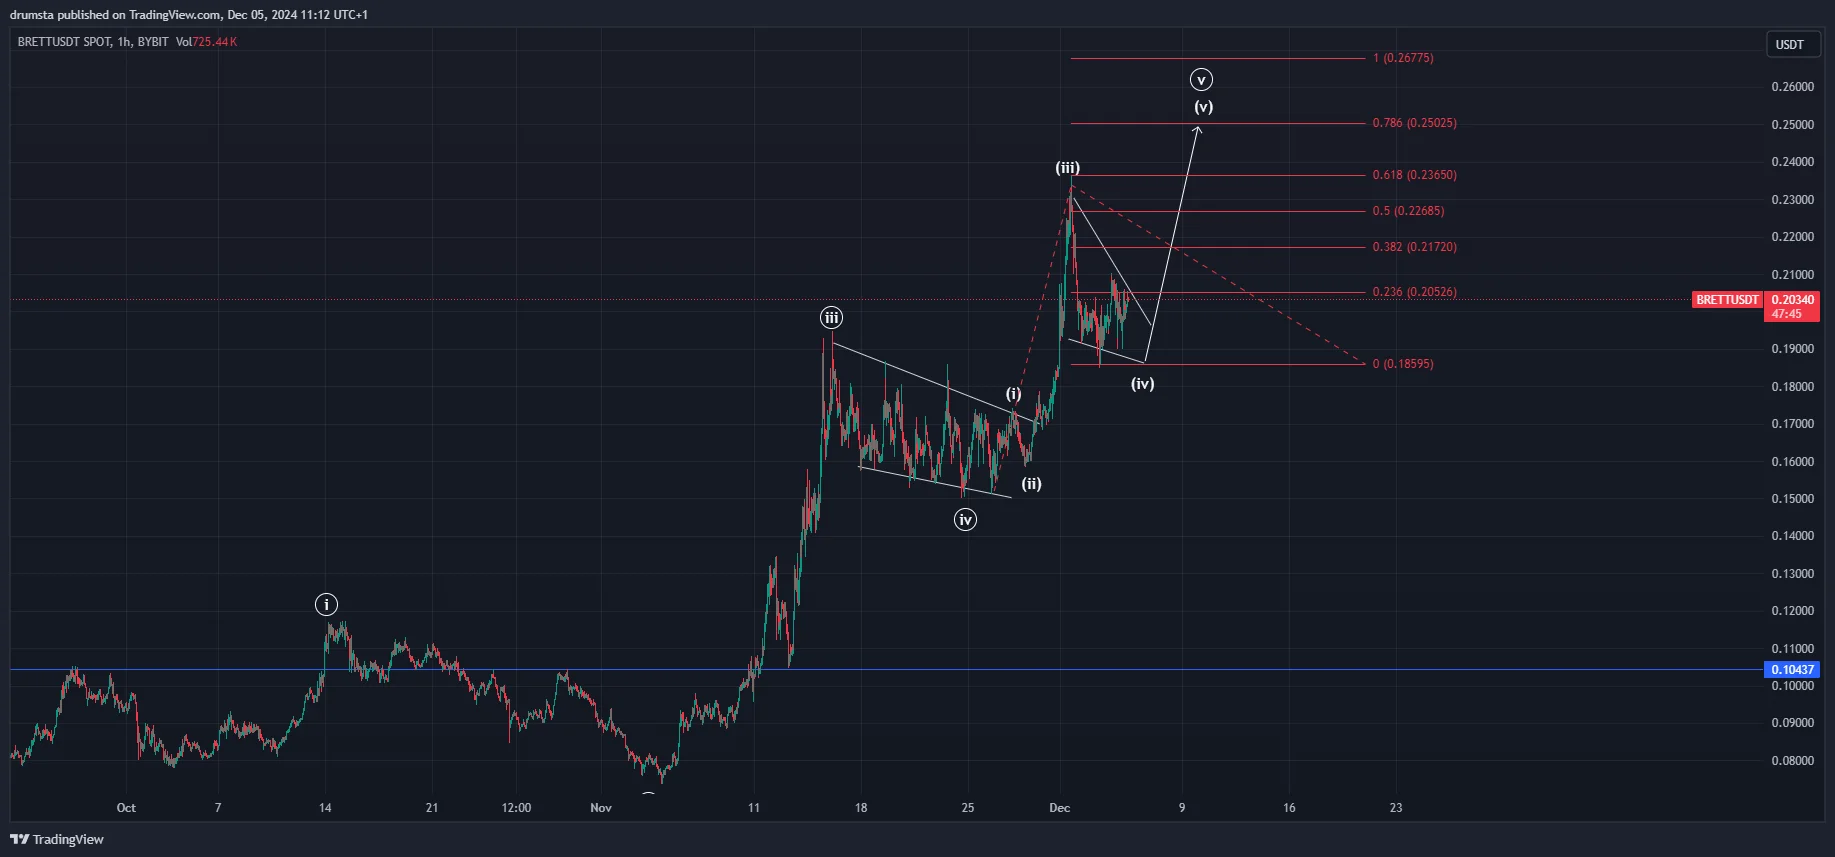
On the hourly chart, we are closely analyzing the last rise since the completion of the higher degree wave 4 in a descending channel on Nov. 26. We can see that a lower degree five-wave impulse already developed three waves, and its wave (iv) correction is underway.
BRETTUSD one more high expected | Credit: Nikola Lazic/TradingView
We expect the final wave (v) to resume the broader uptrend and make a new all-time high. Our target is set at the 0.786 Fib extension at $0.25.
It is also possible that the Dec. 1 peak marked the conclusion of the uptrend, meaning that the descending price action since then signaled the broader market downturn.
The breakout from the currently forming descending triangle will provide further insight into the next likely outlook.
Key Levels to Watch
Support Levels:
$0.205 (0.236 Fib): Immediate support during the wave (iv) correction.
$0.185 (0 Fib): Major support and potential bottom for wave (iv).
$0.172: Key level to maintain the bullish Elliott Wave structure.
Resistance Levels:
$0.236 (0.618 Fib): Resistance to watch for the beginning of wave (v).
$0.250 (0.786 Fib): Immediate target for the next upward move in wave (v).
$0.267 (1.0 Fib): A projected wave (v) target and a potential new high.
Maintaining support above $0.185 will confirm the validity of the wave (iv) correction, while a breakout above $0.236 could signal the resumption of the bullish trend toward $0.267.
A sustained drop below $0.172 would question the broader bullish momentum.
Disclaimer:
The information provided in this article is for informational purposes only. It is not intended to be, nor should it be construed as, financial advice. We do not make any warranties regarding the completeness, reliability, or accuracy of this information. All investments involve risk, and past performance does not guarantee future results. We recommend consulting a financial advisor before making any investment decisions.
Nikola Lazic is a cryptocurrency analyst and investor working in the industry since 2017. He holds a bachelor's degree in Sociology, which enables him to better understand the psychology behind the crowd´s positioning. Consequently his preferred analytical tool is Elliott Wave Theory in combination with price action analysis.
Combining his experience in trading and investing with knowledge in content writing he strives to bring the most accurate and actionable information.