BGB price has dropped from $8.49, with data showing a drop in the accumulation of the token.
A key resistance lies between $6.29 and $6.48, indicating that the BGB could retrace further.
Technical indicators support the bearish thesis, with possible targets at the $0.382 Fib level.
Bitget Token (BGB), the utility token of the Bitget exchange, was one of the standout cryptocurrencies in 2024. During that period, BGB’s price climbed from $0.63 to $8.49.
However, at press time, the price had dropped by 26%. This drop could be linked to profit-taking and the absence of sustained buying pressure in the market.
Can BGB turn the tides this month and display the kind of momentum it had for most of last year or not?
Rising Selling Pressure Sends the Bitget Token Value Down
On Dec. 27, 2024, BGB hit $8.49, representing a nearly 1,000% hike in 2024. However, the price has now dropped to $6.25 following a broader market decline in the first week of January.
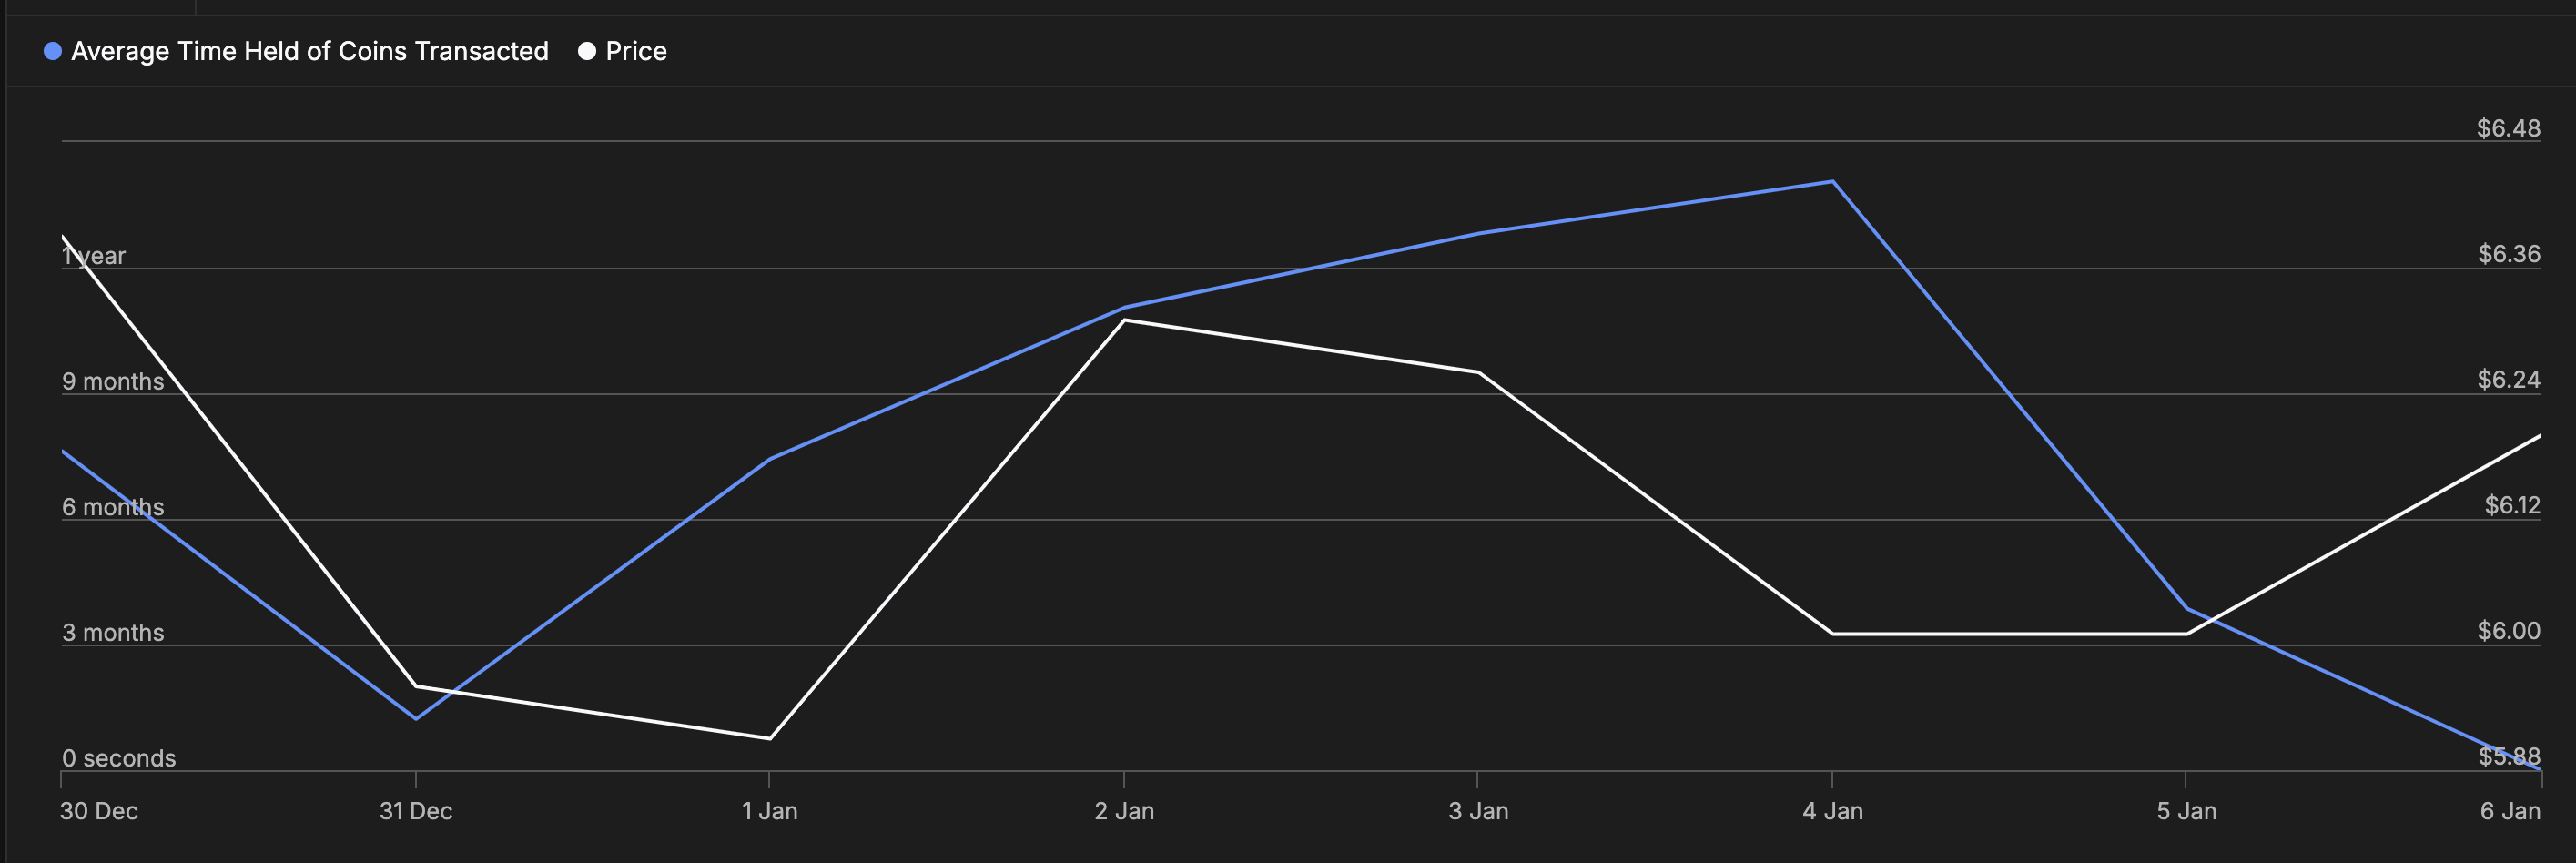
Beyond this wider fall, on-chain data shows that increased selling pressure contributed to BGB’s price decrease. According to IntoTheBlock, the holding time of transacted coins jumped on Jan. 4.
This metric measures the average amount of time a cryptocurrency has been held before being transacted or sold. Typically, the higher the holding time, the higher the chances of a prolonged price increase.
However, BGB’s holding time has decreased at press time. This decline indicates rising selling pressure around the token. If sustained, then the recent price drop could extend lower than $6.24 in the short term.
BGB Coin Holding Time | Source: IntoTheBlock
In addition to this bearish outlook, the In/Out of Money Around Price (IOMAP) also suggests that BGB might face another decline.
The IOMAP spots crucial buying and selling regions that can act as support or resistance. It does this by examining the concentration of tokens in unrealized gains or losses.
When a high volume of tokens is in the money, it implies support. On the other hand, a high concentration of money indicates resistance.
Based on on-chain data, a total of 5,940 BGB tokens accumulated between $6.29 and $6.48 are currently “out of the money,” representing holdings at a loss.
This figure surpasses the volume held between $5.34 and $6.10, highlighting significant resistance around the $6.29 to $6.48 range. If the buying volume fails to increase, BGB’s price might have difficulty hitting $7.
BGB In/Out of Money Around Price. Source: TradingView
BGB Price Prediction: Time to Decrease Below $6
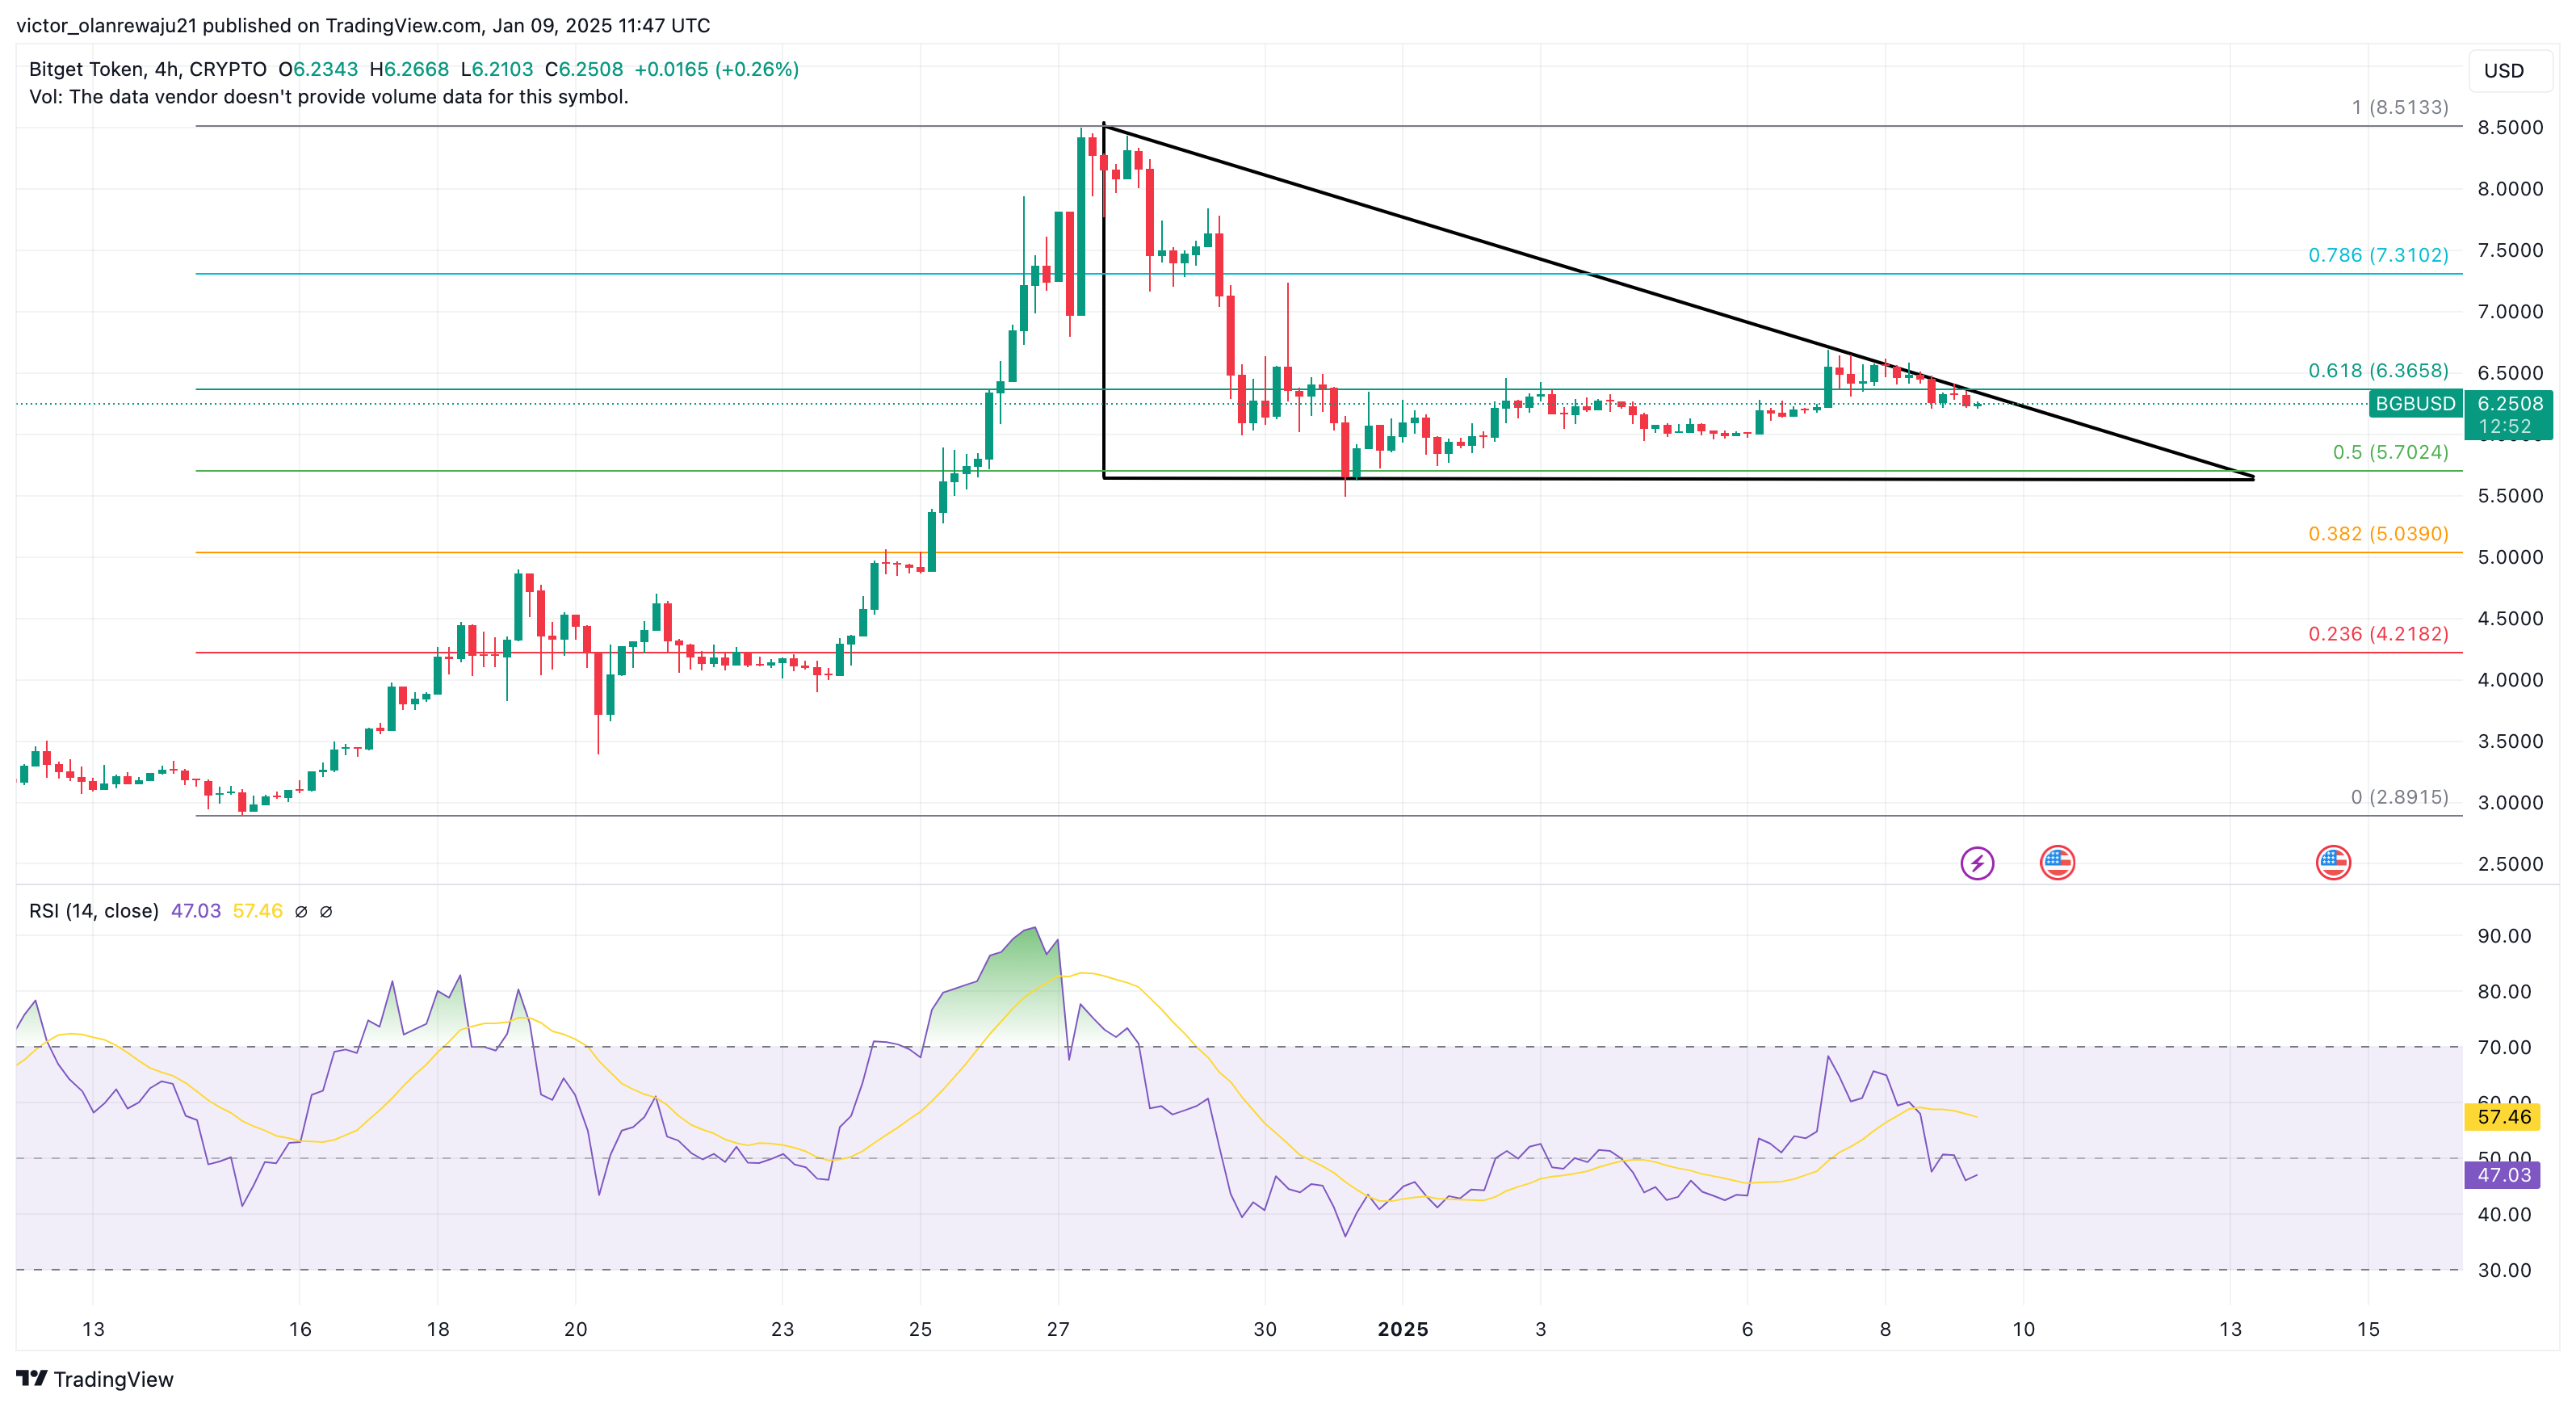
On the 4-hour chart, BGB’s price is stuck in a descending triangle, a bearish pattern formed from a series of lower highs and a flat support level.
This technical pattern indicates increasing selling pressure and the potential for further decline. The Relative Strength Index (RSI) has slipped below the midpoint, indicating that the momentum around BGB has turned bearish.
Should the RSI reading continue to decline, then BGB’s price might decrease to the 0.382 support floor at $5.04. If selling pressure intensifies, it could slide to $4.22
BGB/USD 4-Hour Chart | Source: TradingView
On the other hand, if buying pressure outpaces bearish dominance, this trend might change. If that happens, then BGB could jump toward $7.24.
Disclaimer:
The information provided in this article is for informational purposes only. It is not intended to be, nor should it be construed as, financial advice. We do not make any warranties regarding the completeness, reliability, or accuracy of this information. All investments involve risk, and past performance does not guarantee future results. We recommend consulting a financial advisor before making any investment decisions.
Victor Olanrewaju is a crypto analyst and reporter at CCN with deep roots in on-chain research and technical analysis. His crypto journey began in 2017, but it was the 2020 Uniswap airdrop that sparked a full-time pivot into the space.
With a foundation in copywriting, Victor honed his craft creating high-converting content for leading crypto brokers — most notably an XRP price prediction that ranked #1 on Google during the 2021 bull run.
He later joined AMBCrypto in 2022, where he combined storytelling with technical and on-chain analysis to cover key market narratives.
In 2024, he expanded his expertise at BeInCrypto, collaborating with analysts and using tools like Glassnode, Santiment, and IntoTheBlock to break down Bitcoin and altcoin trends.
At CCN, Victor covers the top cryptocurrencies, memecoins, macro shifts, blending real-time insights with deep-dive metrics.
He holds a Bachelor’s degree in Physics from the University of Ibadan, equipping him to simplify complex data for a wide audience. Follow his work or connect on LinkedIn or X.