BTC price makes a lower low yesterday indicating the continued declining momentum. Will it find support?
Share
Key Takeaways
Bitcoin is in a Wave 4 corrective phase, per Elliott Wave Theory.
A-B-C structure suggests a potential drop to $86,000 before the next move.
RSI indicates neutral momentum, with breakout signals awaited.
Bitcoin is navigating its Wave 4 corrective phase, forming a distinct A-B-C structure as it consolidates near key Fibonacci levels.
With the all-time high of $108,336 marking the peak of Wave 3, the current phase suggests more downside potential before a new upward impulse in Wave 5.
Analysts are eyeing a breakout above the descending trendline, which would confirm the start of the next bullish phase.
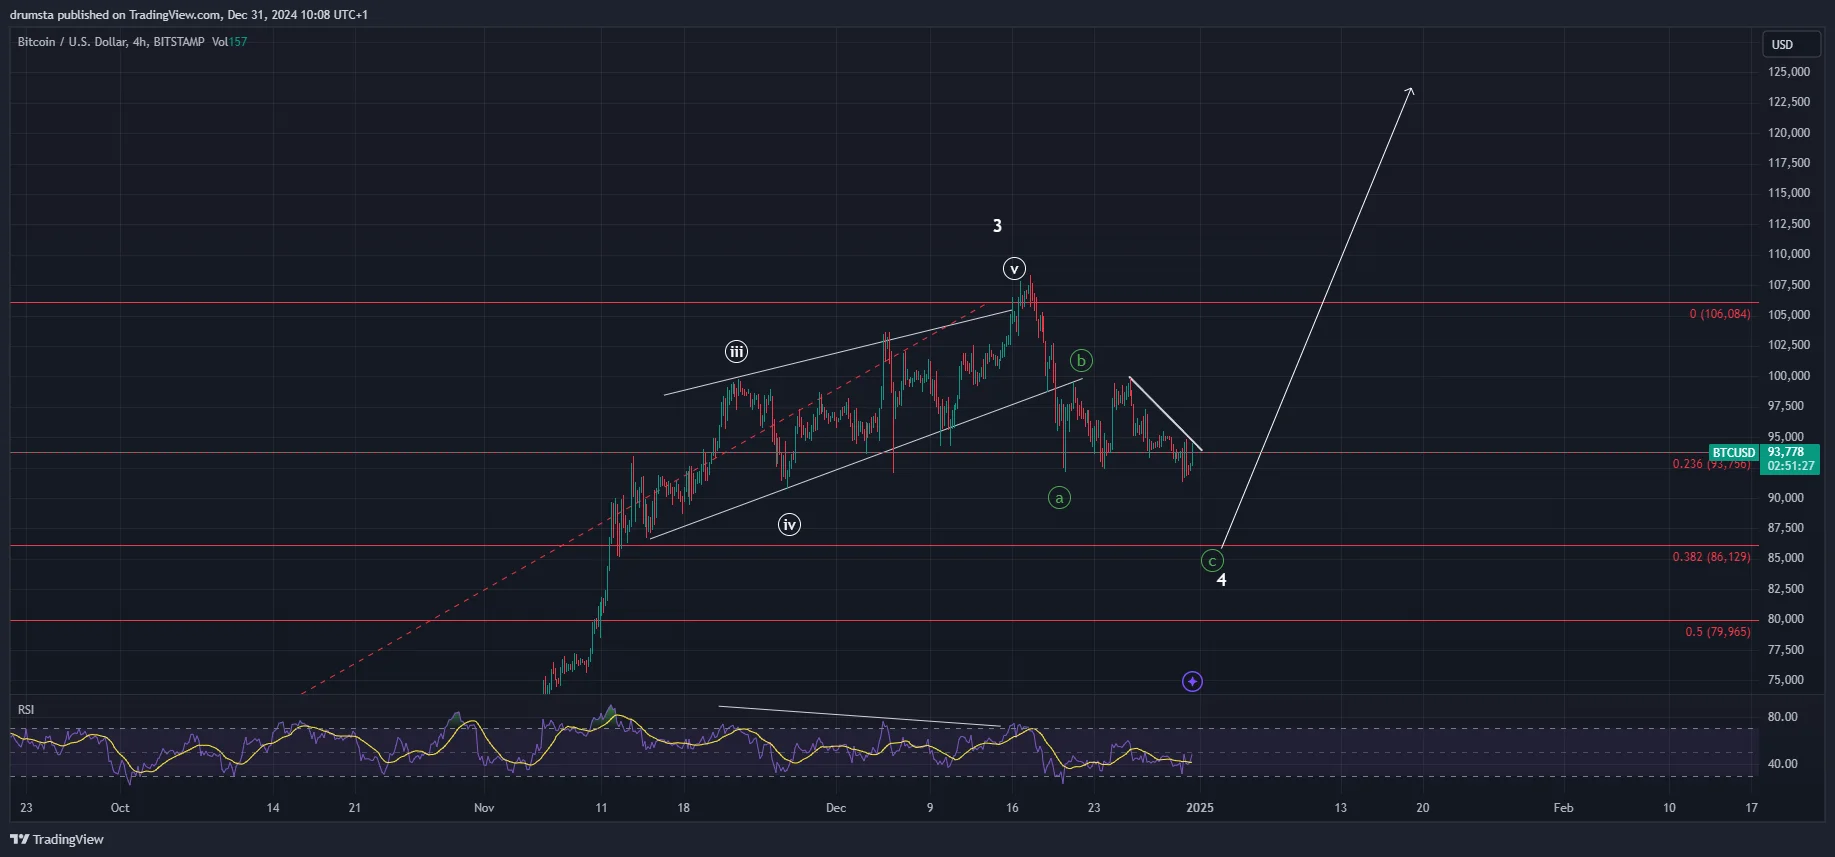
Bitcoin’s 4-hour chart highlights a textbook Elliott Wave pattern, with Wave 4 nearing completion.
Bitcoin is trading near the 0.236 Fibonacci retracement level at $93,736, with potential support levels identified deeper at $86,000 (0.382 retracement).
The descending channel, characteristic of Wave 4, suggests that a breakout—likely to the upside—will confirm the initiation of Wave 5.
BTCUSD price in a descending structure | Credit: Nikola Lazic/TradingView
Momentum indicators, including the Relative Strength Index (RSI), currently signal neutrality, reflecting indecision in the market.
If Wave C of the corrective phase matches Wave A’s magnitude, Bitcoin could see further declines toward $84,172, though analysts anticipate support holding above $86,000 in a bullish scenario.
BTC Price Prediction
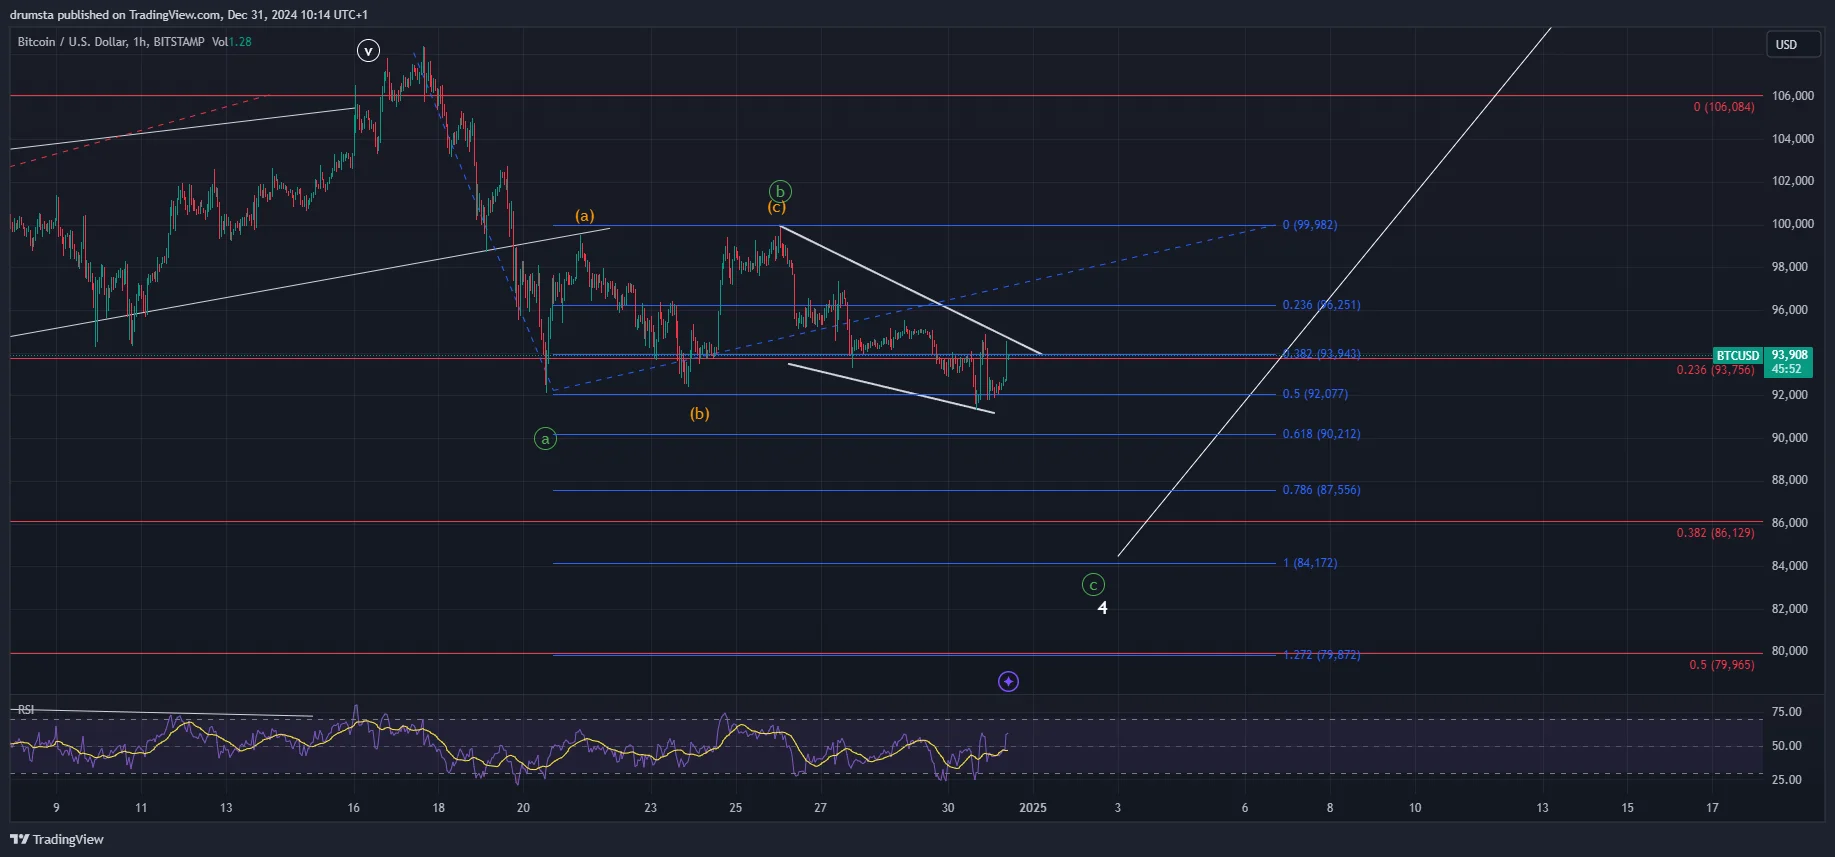
Zooming into the hourly chart, Bitcoin remains within a descending channel that aligns with its corrective structure.
The price has tested the 0.236 Fibonacci level multiple times, but a drop to $86,000 would align with Wave 4’s typical patterns.
A bullish breakout above $93,756 would target $99,982, a key trendline projection signaling the start of Wave 5
BTCUSD descending channel formed, but support is being tested | Credit: Nikola Lazic/TradingView
In the bearish case, failure to hold $92,077 (0.5 Fibonacci extension) could lead to deeper corrections, with potential bottoms at $87,556 or even $84,172.
Conversely, a confirmed breakout from the descending channel would pave the way for new highs in the $125,000 range during Wave 5.
Deeper support: $90,212 (0.618 Fibonacci extension level) and $87,556
Critical support: $86,129 (0.382 retracement of the larger structure) and $84,172 (Wave C potential bottom).
Immediate resistance: $93,756 (0.268 Fibonacci retracement level of the correction).
Breakout target: $99,982 (trendline projection for a bullish breakout).
Invalidation: Below $92,077, with further bearish targets at $86,129 or lower.
Disclaimer:
The information provided in this article is for informational purposes only. It is not intended to be, nor should it be construed as, financial advice. We do not make any warranties regarding the completeness, reliability, or accuracy of this information. All investments involve risk, and past performance does not guarantee future results. We recommend consulting a financial advisor before making any investment decisions.
Nikola Lazic is a cryptocurrency analyst and investor working in the industry since 2017. He holds a bachelor's degree in Sociology, which enables him to better understand the psychology behind the crowd´s positioning. Consequently his preferred analytical tool is Elliott Wave Theory in combination with price action analysis.
Combining his experience in trading and investing with knowledge in content writing he strives to bring the most accurate and actionable information.