Here's What's Going on with Avantis and Aster | Credit: Hameem Sarwar
Share
Key Takeaways
Avantis and Aster reached all-time highs on Sept. 21 and 22.
Avantis trades inside a long-term ascending wedge pattern.
Aster broke down from an ascending parallel channel.
Avantis (AVNT) and Aster (ASTER) both hit fresh all-time highs on Sept. 21 and 22, marking critical points in their short-term market cycles.
While both tokens showed strong initial momentum, technical indicators flashed early warning signs.
Now, bears have taken over, creating corrective patterns that could lead to new lows by the end of the month.
Avantis Price Analysis
AVNT, one of the newest entrants in the perpetual DEX space, has already shown signs of cooling after an explosive debut earlier this month.
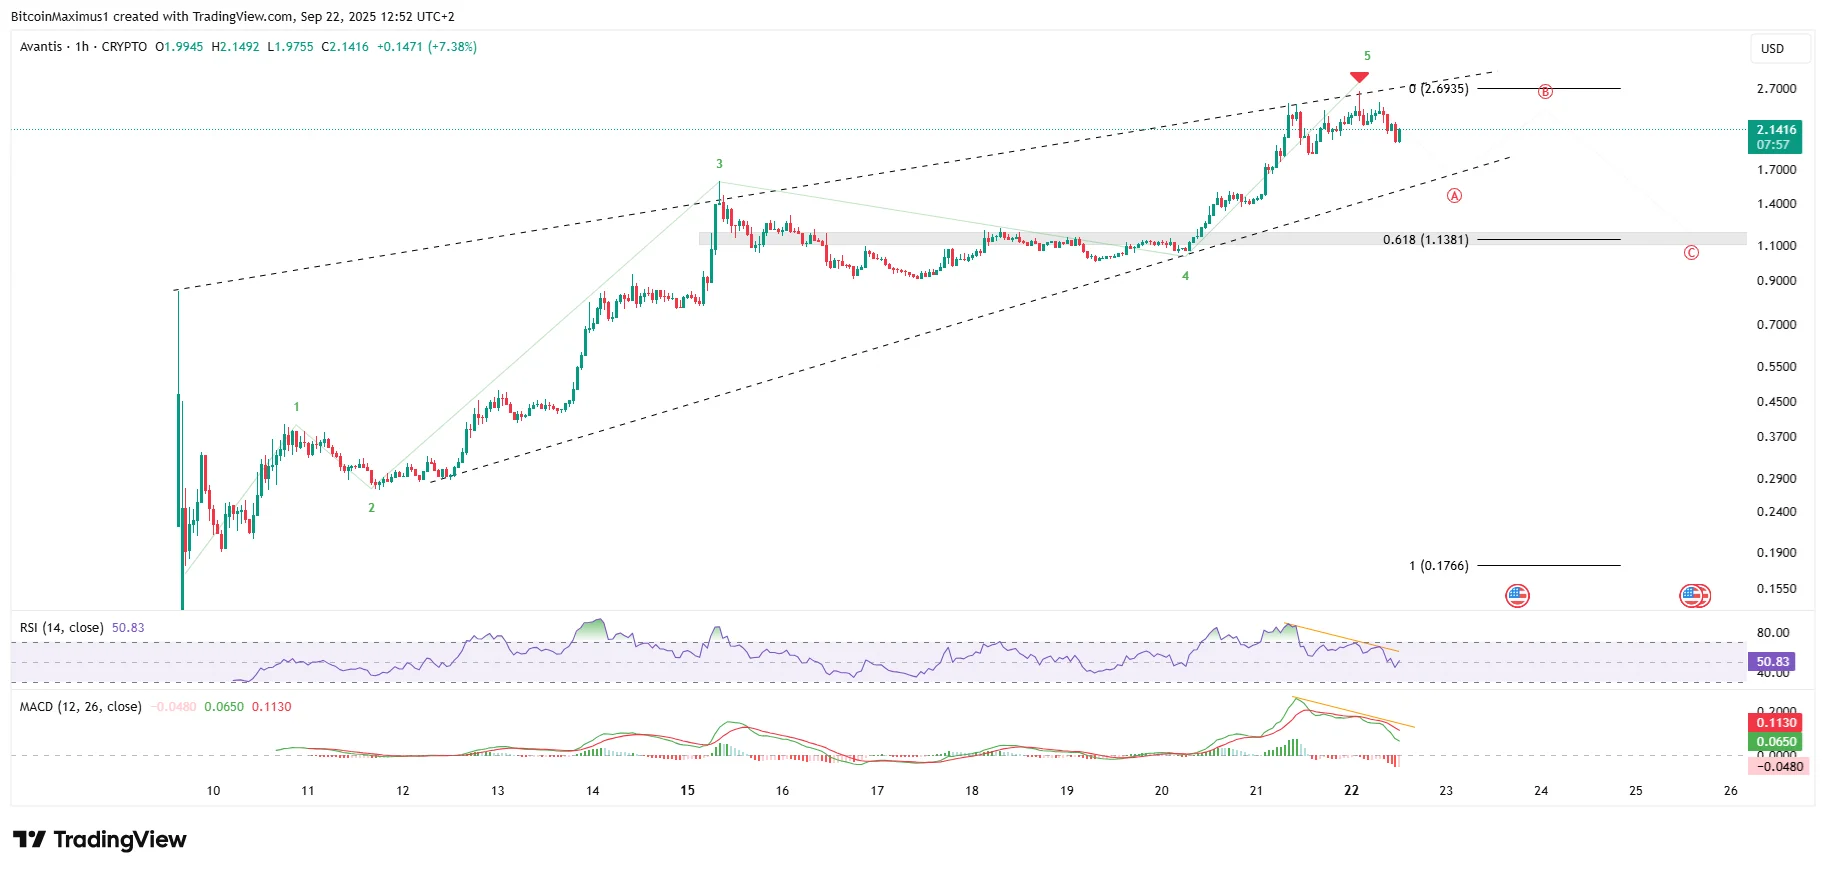
The token, which launched on Sept. 9, surged in a steady climb inside an ascending wedge pattern, peaking at an all-time high of $2.66 on Sept. 22. But momentum faltered almost immediately, with AVNT unable to extend its rally and slipping lower in the days since.
Avantis’ price increase led to an all-time high of $2.66 on Sept. 22. Despite the high, the price failed to reach a new all-time high and has fallen slightly since.
Get These Top Crypto Casino Offers Now!
Sponsored
Disclosure
We sometimes use affiliate links in our content, when clicking on those we might receive a commission at no extra cost to you. By using this website you agree to our terms and conditions and privacy policy.
The Avantis price decrease was preceded by bearish divergences (orange) in the Relative Strength Index (RSI) and the Moving Average Convergence/Divergence (MACD).
AVNT will fall to the wedge’s support trend line near $1.70 if the divergences play out.
The wave count suggests that the Avantis price is completing wave A of an A-B-C correction (red), which could eventually take it down to the 0.618 Fibonacci retracement support level.
Since the five-wave increase that led to the high (green) lasted nearly 20 days, the correction will likely continue for at least the rest of September.
A breakdown from the wedge will confirm that the Avantis price is heading lower to complete the second portion of the correction.
ASTER Price Decrease
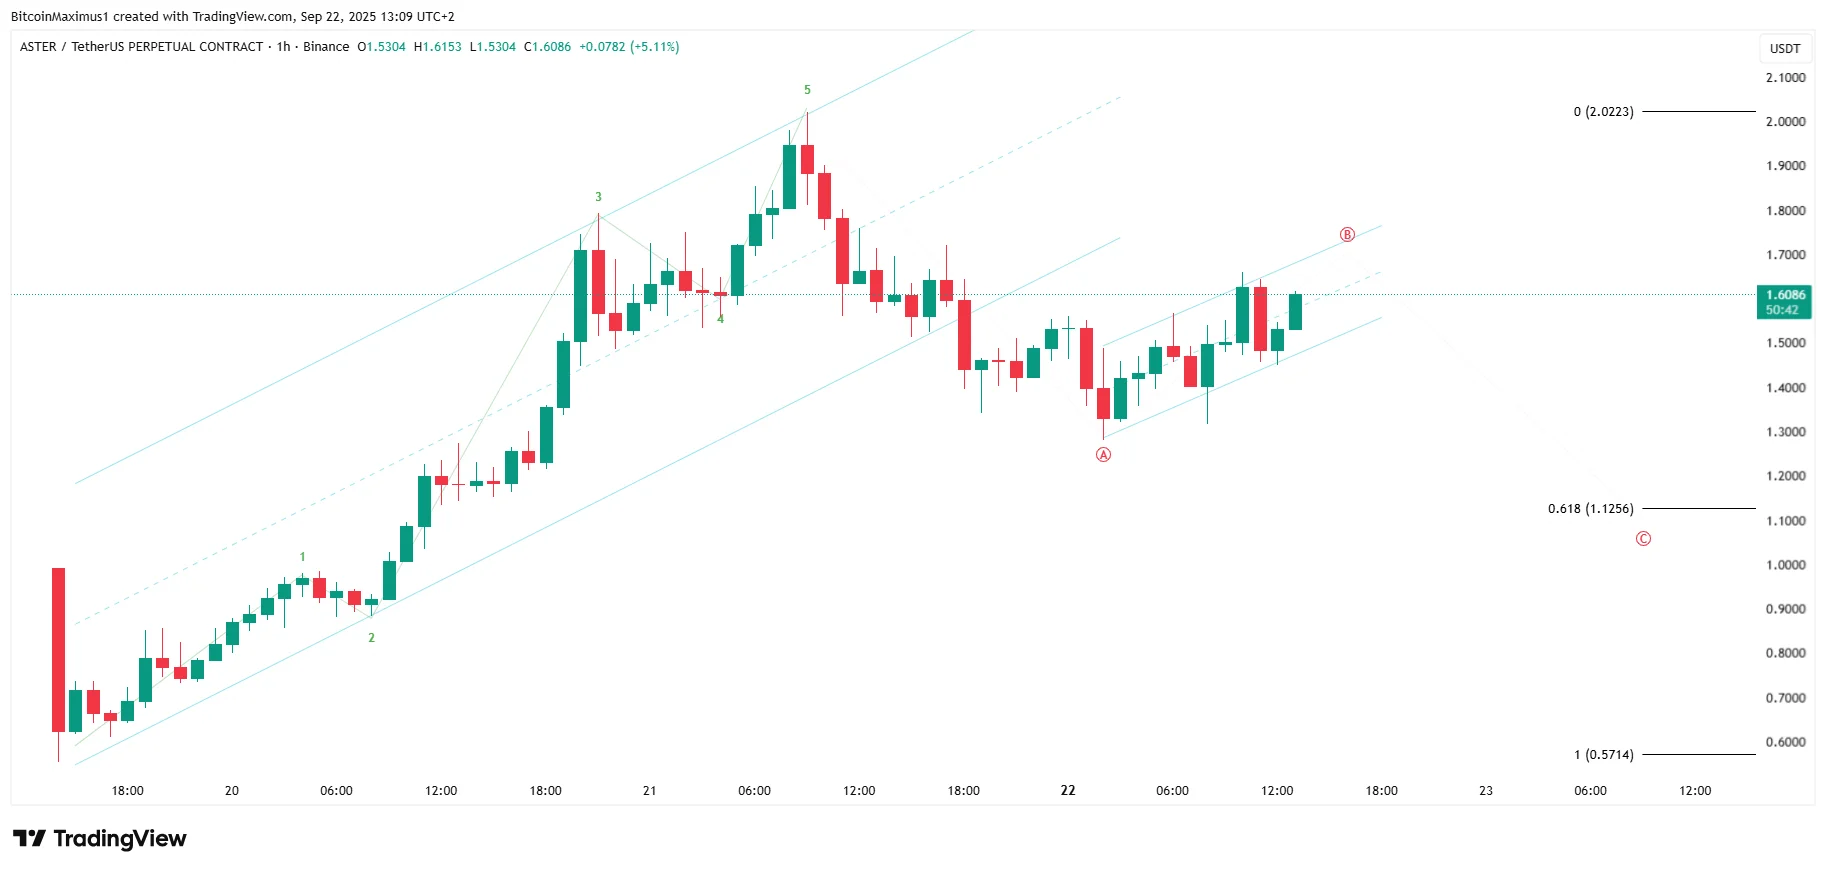
The ASTER price movement has similarities with Avantis, showing a breakdown from an ascending parallel channel.
ASTER bounced after the breakdown, stopping the bleeding on Sept. 22.
The upward movement has also been contained inside a short-term ascending parallel channel, which could also lead to a breakdown.
According to the wave count, ASTER is in wave B of an A-B-C correction (red), which is confirmed by a breakdown from the short-term channel.
Afterward, a potential target for the bottom of wave C is at the 0.618 Fibonacci retracement support level at $1.12.
More Downside Incoming
Overall, Avantis and Aster appear to enter corrective phases after their recent highs.
With bearish divergences, the next moves will be critical in confirming longer-term trends.
Whether these corrections deepen or lead to bottoms will likely set the tone for their performance heading into October.
Disclaimer:
The information provided in this article is for informational purposes only. It is not intended to be, nor should it be construed as, financial advice. We do not make any warranties regarding the completeness, reliability, or accuracy of this information. All investments involve risk, and past performance does not guarantee future results. We recommend consulting a financial advisor before making any investment decisions.
Valdrin Tahiri is a cryptocurrency analyst and reporter at CCN, specializing in technical analysis with a focus on Elliott Wave theory, on-chain metrics, and fundamental research. He brings over seven years of experience in the crypto space as both a trader and writer.
He discovered cryptocurrencies in 2017 while earning his MSc in Financial Markets at the Barcelona School of Economics, which sparked a deep interest in blockchain and market dynamics. Since then, he’s contributed to top crypto outlets like BeInCrypto and CoinGape.
Valdrin also served as Community Manager of BeInCrypto’s Telegram group for three years, helping grow it into one of the largest crypto communities worldwide. His expertise in market structure and price patterns allows him to break down complex trends into clear, actionable insights.
He’s published thousands of articles covering altcoins, Bitcoin cycles, and macro trends.