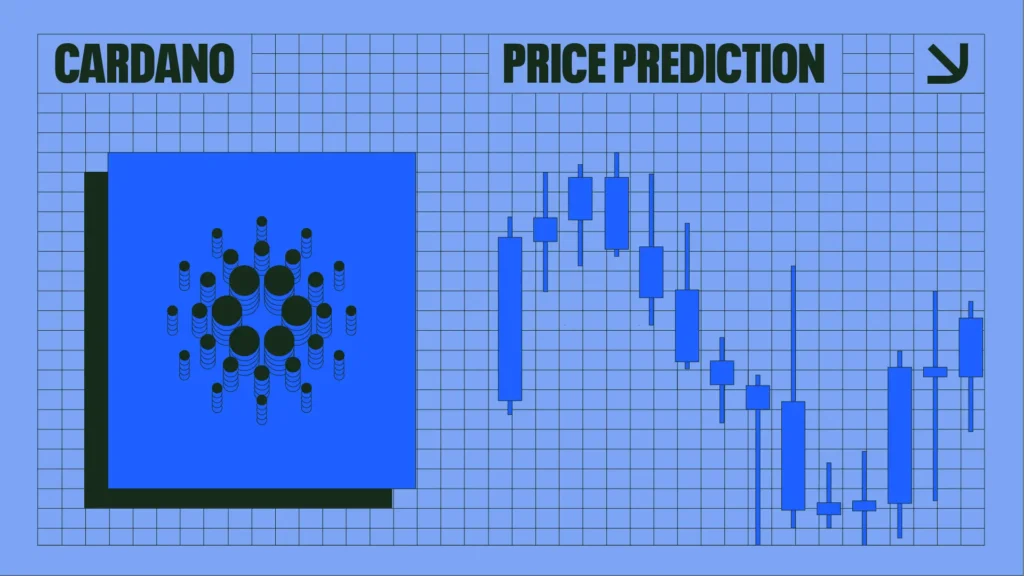
ADA price made a new yearly high today, but this could mark the completion of its uptrend since November.
Share
Key Takeaways
ADA has likely completed wave (3) at $1.20, reaching the 1.618 Fib extension.
Overbought RSI suggests a possible wave (4) correction or consolidation.
Support lies at $0.985, $0.860, and $0.758, maintaining the bullish structure.
Cardano (ADA)) has experienced an extraordinary rally, breaking free from its prolonged corrective phase in 2024 and forming a solid foundation near $0.24.
This surge propelled ADA into wave (3) of its Elliott Wave structure, reaching a new yearly high of $1.20 on Dec. 2. It showcased significant bullish momentum supported by a breakout from a descending triangle.
Cardano’s price has displayed a remarkable rally, breaking out from its prolonged corrective phase throughout 2024.
After forming a solid base of nearly $0.24, the price surged, completing wave (3) of a larger Elliott Wave structure and reaching a high of $1.20 today, Dec. 2.
This sharp upward move reflects significant bullish momentum, marked by a decisive breakout from a descending triangle and strong buying pressure.
However, it reached a key horizontal zone, and with some signs of overextension, the rally might end.
ADAUSD wave 3 reached horizontal resistance | Credit: Nikola Lazic/TradingView
The Relative Strength Index (RSI) is overbought territory, suggesting a possible cooling-off phase or consolidation before the next significant move.
Fibonacci extensions indicate wave (3) has reached a typical 1.618 extension at $1.20, with potential wave (5) targets at $1.57 and $1.76 (2.272 and 2.618 Fibonacci levels).
However, wave (4) retracement to lower Fibonacci levels is anticipated before further upside.
Key Observations
Wave (3) Completion: ADA has likely completed wave (3), reaching a high of $1.13, with the 1.618 Fib extension acting as resistance.
RSI Overbought: The RSI indicates overbought conditions, indicating a potential wave (4) correction.
Support Levels: Key support zones lie at $0.85 (0.786 Fib) and $0.72 (0.618 Fib), critical for maintaining the bullish structure.
ADA Price Prediction
Zooming into the hourly chart and examining the wave structure behind the last uptrend, we can see that ADA completed wave (3) of a larger impulsive.
The rally shows signs of exhaustion, confirmed by rejection at the Fibonacci extension level and wave (v) development within wave (3).
The price action now transitions into a corrective phase, with an anticipated ABC structure to retrace some gains.
ADAUSD correction anticipated | Credit: Nikola Lazic/TradingView
ADA’s price is expected to consolidate or pull back to Fibonacci retracement levels, forming a foundation for the subsequent wave (5) and continuation of the bullish trend.
Depending on the momentum behind this correction, it could be shallow or extended by two more waves, amounting to a deeper ABCDE.
Key Levels to Watch
Support Levels:
$0.985 (0.236 Fibonacci): Immediate support and likely target for wave (4).
$0.860 (0.382 Fibonacci): Strong support zone if correction deepens.
$0.758 (0.5 Fibonacci): A critical level to maintain the broader bullish structure.
Resistance Levels:
$1.130: Current trading zone and critical for confirming any upward recovery.
$1.186: Recent high marking wave (3) completion, key for a breakout to wave (5).
$1.415 (2.0 Fibonacci extension): A projected target for the wave’s next major impulsive move (5).
Finally, a sustained drop below $0.758 would challenge the bullish outlook. A decisive break above $1.186 could confirm the continuation of the uptrend into the wave (5).
Disclaimer:
The information provided in this article is for informational purposes only. It is not intended to be, nor should it be construed as, financial advice. We do not make any warranties regarding the completeness, reliability, or accuracy of this information. All investments involve risk, and past performance does not guarantee future results. We recommend consulting a financial advisor before making any investment decisions.
Nikola Lazic is a cryptocurrency analyst and investor working in the industry since 2017. He holds a bachelor's degree in Sociology, which enables him to better understand the psychology behind the crowd´s positioning. Consequently his preferred analytical tool is Elliott Wave Theory in combination with price action analysis.
Combining his experience in trading and investing with knowledge in content writing he strives to bring the most accurate and actionable information.